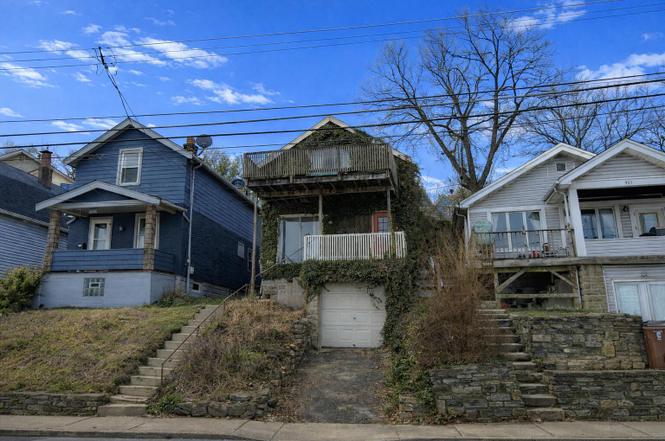
933 Highway Ave · Covington, KY
Flood risk 7/10 · Major
- FEMA flood zone
- X (unshaded)
- Chance of flooding over 30 yrs
- 0.76%
- Est. flood insurance / yr
- $507 – $1,088
Fire risk 1/10 · Minimal
- Est. fire insurance / yr
- $839 – $1,559
Heat risk 4/10 · Minor
- Hot days now (above 103°F)
- 7 days/yr
- Hot days in 30 yrs
- 19 days/yr
Wind risk 2/10 · Minimal
- Chance of severe wind over 30 yrs
- 1.0%
Air-quality risk 3/10 · Minor
- Unhealthy air days now
- 2 days/yr
- Unhealthy air days in 30 yrs
- 3 days/yr
Risk factors via First Street. Map © Google.
Why this score? — see what drove the B- grade
The composite is a weighted blend of 9 inputs, each scored 0–100. Each bar is that input's sub-score; the figure is the points it added to the 100-point composite (weight × sub-score).
- Cash flow +30.0/30.0
- 1% rule +10.0/10.0
- DSCR +10.0/10.0
- ARV discount +7.5/15.0
- Livability +4.3/5.0
- Rent growth +2.9/5.0
- Condition / age +2.5/5.0
- Schools +1.5/10.0
- Appreciation +0.0/10.0
$60,000
🖨 Deal sheet (PDF) 📄 Offer letter ✓ Due diligence
Listing remarks
Rare Ohio River view opportunity in West Covington. This 2-bedroom, 1.5-bath hillside home offers panoramic views of the Cincinnati skyline and river from multiple levels, including spacious upper and lower decks. Built-in one-car garage with driveway access. Located on a 28 x 80 lot in the Behringer subdivision. Home offers approximately 1,008 square feet per public record with a two-story layout, living area with deck access, eat-in kitchen, and second-floor bedrooms. Property requires significant renovation including foundation stabilization, moisture remediation, deck repairs, and full cosmetic updates throughout. Ideal investor, rehab, or rental opportunity in a high-demand riverfront
Key facts
- Panoramic views
- Two-story layout
- Ohio river view
Tags
Neighborhood map
What this means for you Summary
Snapshot
- This is a 2-bed/1.5-bath single-family listed at $60k.
Deal economics
- At list price, monthly cash flow is $1k ($13k/yr) — positive.
- The deal already cash-flows at list — no discount required.
- Meets the 1% rule at list price ($2k rent vs $60k).
- Recommended offer: $58k (3.0% below list) — sets the bar for market timing.
- Cap rate 29.6% vs local median 5.3% in Covington — top-decile yield for the area; either an underpriced asset or a hidden risk that comps aren't pricing in. Stress-test before assuming the spread holds.
Location & tenants
- Location reads 86/100 on livability (#40 in KY, #376 nationally) — a professional / high-income tenant draw. Strengths: amenities A+, commute A+, cost of living A+; Watch: employment D+.
- Covington Independent (suburban): math 10% / reading 27% proficiency, ranked #162 of 165 in KY (top 98%) — low school quality limits family demand, transient renter base, plan for 1-2y turnover; 78% free/reduced lunch — lower-income household profile, screen leases tightly.
- Zoned schools: John G Carlisle Elementary (math 2% / reading 27%, grade F, #620 of 676 statewide, top 93%, 304 students, 81% FRL); Holmes Middle School (math 8% / reading 26%, grade F, #211 of 217 statewide, top 97%, 656 students, 84% FRL); Holmes High School (math 12% / reading 17%, grade F, #227 of 254 statewide, top 89%, 878 students, 80% FRL) — zoned schools at 82% FRL track the district average.
- Market conditions: Rents rising (+1.6%/yr); 218 active listings in the ZIP; 40 comparable units currently listed for rent nearby; rentals leasing fast (median 5d on market — plan ~1-2 weeks tenant-placement turnaround); 699 units permitted in Kenton County in 2024 (287 in 5+ unit buildings).
- This rent runs 34% of the median local income ($70k/yr) — at the standard rent-burdened threshold; future hikes will face affordability resistance.
Forward outlook
- Local home prices are declining (-3.0%/yr); year-one equity from $415 of loan paydown is wiped out by about $2k of value loss. Plan a longer hold.
- Kenton County population projected at +5% by 2050 — modest demand growth; plan on rents tracking national, not racing it.
- At projected returns (-3.0% appreciation + 1.6% rent growth), your $17k cash investment doubles in ~2 years — after that, you're playing with house money.
Negotiation context
- It's been on market 43 days — a 3% lower offer ($58k) is reasonable based on typical stale-listing flexibility.
- Current owner paid $31k; list at $60k implies a 96% gain — meaningful room to come down on a strong offer.
Risks & watch-outs
- Watch-outs: flood insurance adds $66/mo; built in 1927 — expect roof / HVAC / electrical / plumbing capex.
- Climate carrying-cost: major flood risk — expect insurance premiums to compound above CPI over the hold.
Questions for the listing agent
- It's been on market 43 days. Have you received any prior offers? Is the seller open to a 3% concession, seller financing, or rate buy-down credit?
- Built in 1927 — when were the roof, HVAC, electrical panel, plumbing, and water heater last replaced?
- What's the actual annual flood-insurance premium (NFIP or private), and is the property in a SFHA with mandatory coverage?
- Is there a deadline driving the sale (1031 exchange, divorce, estate, relocation)? That informs how much negotiation room exists.
- What's the average days-on-market for RENTAL listings here right now (not sales)? A rising rental-DOM trend means longer vacancies and softer asking-rent achievability than the comps imply.
- What's the recent tenant-quality profile in this submarket — average credit score on applications, eviction rate, late-payment / NSF rate, and stable-employment percentage? A property-management company in the area should have these aggregated.
- How much new for-sale + rental construction is in the pipeline within 1–3 miles? Heavy new supply typically softens prices + rents 12–24 months out; constrained supply supports both.
Investment metrics
- 1% rule
- 3.31% ✓
- Cap rate
- 29.59%
- Cash-on-cash
- 83.21%
- DSCR
- 4.70
- GRM
- 2.5
CMA / ARV
- ARV (on-the-fly)
- $212,688
- Comps found
- 12
Show comp detail 12 sales within ~0.75 mi
| Address | Dist | Beds/Ba | Sqft | Sold | Price | $/sf | Match |
|---|---|---|---|---|---|---|---|
| 1037 John St | 0.24mi | 2/1.0 | 1,000 (-1%) | 4mo | $65,550 | $66 | 82 |
| 1106 Parkway Ave | 0.12mi | 2/1.5 | 1,040 (+3%) | 14mo | $245,000 | $236 | 78 |
| 1232 Clark St | 0.29mi | 2/2.0 | 946 (-6%) | 5mo | $203,000 | $215 | 70 |
| 1020 Winding Way | 0.47mi | 3/1.5 (+1) | 1,015 (+1%) | 7mo | $360,000 | $355 | 66 |
| 1323 Highway Ave | 0.47mi | 2/1.0 | 992 (-2%) | 15mo | $128,000 | $129 | 61 |
| 630 Western Ave | 0.51mi | 2/1.5 | 1,024 (+2%) | 16mo | $199,500 | $195 | 61 |
| 8 Montrose St | 0.59mi | 2/1.0 | 1,044 (+4%) | 14mo | $220,000 | $211 | 52 |
| 29 Augusta Ave | 0.50mi | 2/1.0 | 1,104 (+10%) | 8mo | $330,500 | $299 | 52 |
| 343 Hazen St | 0.70mi | 2/1.0 | 1,000 (-1%) | 15mo | $255,000 | $255 | 51 |
| 139 Montclair Ave | 0.66mi | 3/2.0 (+1) | 1,078 (+7%) | 6mo | $193,000 | $179 | 46 |
| 1319 Hazen St | 0.48mi | 2/1.0 | 874 (-13%) | 12mo | $135,000 | $154 | 44 |
| 738 Dalton St | 0.71mi | 3/2.0 (+1) | 1,104 (+10%) | 10mo | $200,000 | $181 | 36 |
Match score weights: distance 35% · size 25% · config 20% · recency 20%. Top-matched comps best support the ARV.
Projected returns pro-forma
-3.0% appreciation · 1.55% rent growth · sell at horizon
- IRR
- 76.9%
- Equity multiple
- 4.42×
- Total profit
- $57,445
- Equity at exit
- $8,946
- IRR
- 80.1%
- Equity multiple
- 8.68×
- Total profit
- $128,982
- Equity at exit
- $5,188
Cash invested: $16,800 (down + closing). Projections, not guarantees.
Landlord ↔ Tenant lean methodology
- Overall (STATE)
- 83 Strongly Landlord-Friendly
- State Kentucky
- 83 Strongly Landlord-Friendly · R+16
- County
- — inherits STATE
- City
- — inherits STATE
ZIP-level market 41011
- Rents YoY
- 1.6%
- Active inventory
- 218
- Price-to-rent
- 2.5×
Monthly cashflow live
- Estimated rent
- $1,987 high interval (Pro) →
- Mortgage (P&I)
- −$315
- Tax from tax record
- −$65 /mo · $782/yr
- Insurance
- −$25
- Flood insurance flood zone
- −$66 /mo · $798/yr
- HOA
- −$0
- Vacancy / Maint / Mgmt
- −$417
- Net cashflow
- $1,098
Break-even live
Sensitivity live
| Price | -10% $1,132 | -5% $1,115 | +0% $1,098 | +5% $1,081 | +10% $1,064 |
|---|---|---|---|---|---|
| Rent | -10% $941 | -5% $1,020 | +0% $1,098 | +5% $1,177 | +10% $1,255 |
| Rate | -1.0pp $1,129 | -0.5pp $1,114 | base $1,098 | +0.5pp $1,083 | +1.0pp $1,067 |
UW: 25.0% down · 7.5% · 30yr · 1.5% tax · 5.0% vac · 8.0% maint · 8.0% mgmt
Financing live
Cash to close
- Down payment
- $15,000
- Closing costs
- $1,800
- Reserves months
- —
- Total cash needed
- —
Loan-product check · same deal, 3 products live
Conventional
25% down · 7.5% · 30yr
- Down + closing
- —
- Monthly P&I
- —
- Monthly cashflow
- —
- DSCR
- —
- Eligible?
- —
Personal DTI + credit; lowest rate.
DSCR
20% down · 8.5% · 30yr
- Down + closing
- —
- Monthly P&I
- —
- Monthly cashflow
- —
- DSCR
- —
- Eligible?
- —
No personal income docs; deal must DSCR.
Hard money
10% down · 12.0% · 12mo
- Down + closing
- —
- Monthly P&I
- —
- Monthly cashflow
- —
- DSCR
- —
- Eligible?
- —
Short-term bridge; refi at stabilization.
Rent comps 40 comps
| Address | Beds | Baths | Sqft | Rent | $/sqft | DOM | Units | Dist |
|---|---|---|---|---|---|---|---|---|
| 22 Swain Ct Covington, KY | 1.0–3.0 | 1.0–2.0 | 951 | $1,895 | $1.99 | 3d | 3 | 0.20mi |
| 1261 Parkway Ave Covington, KY | 1.0–2.0 | 1.0 | 850 | $1,375 | $1.62 | 5d | 3 | 0.37mi |
| 515 Main St Covington, KY | 1.0–2.0 | 1.0–2.0 | 934 | $2,215 | $2.37 | 3d | 8 | 0.68mi |
| 353 W 4th St Cincinnati, OH | 2.0 | 2.0 | 1140 | $3,400 | $2.98 | 25d | 1 | 0.82mi |
| 218 W 5th St Covington, KY | 1.0 | 1.0 | 800 | $1,595 | $1.99 | 16d | 1 | 0.83mi |
| 50 W Rivercenter Blvd Covington, KY | 1.0–2.0 | 1.0–2.5 | 1273 | $3,640 | $2.86 | 3d | 9 | 0.89mi |
| 231 W 4th St Cincinnati, OH | 1.0 | 1.0 | 914 | $1,575 | $1.72 | 25d | 1 | 0.90mi |
| 47 Ash St Ludlow, KY | 1.0 | 1.0 | 850 | $950 | $1.12 | 13d | 1 | 0.93mi |
| 205 W 4th St Cincinnati, OH | 2.0 | 1.0–2.0 | 648 | $2,162 | $3.33 | 3d | 44 | 0.94mi |
| 151 W 4th St Cincinnati, OH | 2.0 | 1.0 | 726 | $2,399 | $3.30 | 3d | 102 | 0.97mi |
| 44 W Freedom Way Cincinnati, OH | 2.0 | 1.0–2.0 | 943 | $2,859 | $3.03 | 3d | 28 | 0.98mi |
| 309 Vine St Cincinnati, OH | 1.0–3.0 | 1.0–2.0 | 955 | $2,467 | $2.58 | 3d | 15 | 1.06mi |
| 103 E 3rd St Covington, KY | 2.0 | 2.5 | 1291 | $3,250 | $2.52 | 3d | 1 | 1.06mi |
| 1 W 4th St Cincinnati, OH | 3.0 | 1.0–3.5 | 1675 | $6,550 | $3.91 | 4d | 96 | 1.09mi |
| 239 Forest Ave Ludlow, KY | 3.0 | 1.0 | 1146 | $1,395 | $1.22 | 18d | 1 | 1.11mi |
| 1000 Parkvale Ct Park Hills, KY | 2.0 | 1.0 | 850 | $1,495 | $1.76 | 45d | 1 | 1.12mi |
| 1002 Parkvale Ct Unit 1004 1 Park Hills, KY | 2.0 | 1.0 | 850 | $995 | $1.17 | 45d | 1 | 1.13mi |
| 1002 Parkvale Ct Unit 1002 3 Park Hills, KY | 1.0 | 1.0 | 750 | $925 | $1.23 | 9d | 1 | 1.13mi |
| 135 Garfield Pl Cincinnati, OH | 1.0 | 1.0 | 670 | $1,413 | $2.11 | 3d | 6 | 1.14mi |
| 121 E Freedom Way Cincinnati, OH | 2.0 | 1.0–2.0 | 988 | $2,999 | $3.03 | 3d | 27 | 1.14mi |
| 336 Elm St Unit 2 Ludlow, KY | 2.0 | 1.0 | 1050 | $1,275 | $1.21 | 3d | 1 | 1.15mi |
| 336 Elm St Unit 4 Ludlow, KY | 2.0 | 1.0 | 1100 | $1,350 | $1.23 | 45d | 1 | 1.15mi |
| 151 Seventh St W Cincinnati, OH | 2.0 | 1.0–2.0 | 1191 | $2,129 | $1.79 | 3d | 4 | 1.15mi |
| 211 W 9th St Unit 5 Cincinnati, OH | 2.0 | 1.5 | 900 | $1,300 | $1.44 | 4d | 1 | 1.17mi |
| 1205 Lee St Unit 2 Covington, KY | 1.0 | 1.0 | 800 | $1,500 | $1.88 | 25d | 1 | 1.19mi |
| 111 Garfield Pl Unit GAR-0105 Cincinnati, OH | 1.0 | 1.0 | 750 | $1,190 | $1.59 | 5d | 1 | 1.20mi |
| 508 Greenup St Unit 508-02 Covington, KY | 2.0 | 1.0 | 1220 | $1,800 | $1.48 | 3d | 1 | 1.21mi |
| 414 Walnut St Cincinnati, OH | 1.0 | 1.0 | 752 | $2,510 | $3.34 | 3d | 23 | 1.21mi |
| 7 W 7th St Cincinnati, OH | 1.0–2.0 | 1.0–2.0 | 976 | $3,420 | $3.50 | 4d | 65 | 1.22mi |
| 124 W 9th St Unit 1523602P Cincinnati, OH | 1.0 | 1.0 | 807 | $6,605 | $8.18 | 4d | 1 | 1.25mi |
| 630 Vine St Cincinnati, OH | 2.0 | 1.0–2.0 | 741 | $2,239 | $3.02 | 5d | 18 | 1.25mi |
| 19 Garfield Pl Cincinnati, OH | 1.0–2.0 | 1.0–2.0 | 1680 | $2,260 | $1.34 | 3d | 11 | 1.25mi |
| 19 Garfield Pl Cincinnati, OH | 1.0–2.0 | 1.0–2.0 | 1054 | $2,300 | $2.18 | 45d | 20 | 1.25mi |
| 634 Greenup St Covington, KY | 1.0 | 1.5 | 1050 | $1,595 | $1.52 | 9d | 1 | 1.26mi |
| 521 Garrard St Apt 2 Covington, KY | 1.0 | 1.0 | 725 | $1,595 | $2.20 | 18d | 1 | 1.27mi |
| 521 Garrard St Apt 1 Covington, KY | 1.0 | 1.5 | 825 | $1,895 | $2.30 | 18d | 1 | 1.27mi |
| 521 Garrard St Apt 6 Covington, KY | 1.0 | 1.0 | 775 | $1,995 | $2.57 | 17d | 1 | 1.27mi |
| 521 Garrard St Apt 4 Covington, KY | 1.0 | 1.0 | 725 | $1,695 | $2.34 | 18d | 1 | 1.27mi |
| 521 Garrard St Apt 3 Covington, KY | 1.0 | 1.0 | 875 | $1,996 | $2.28 | 16d | 1 | 1.27mi |
| 580 Walnut St Cincinnati, OH | 2.0 | 1.0–2.5 | 1101 | $4,822 | $4.38 | 3d | 19 | 1.30mi |
Listing history 4 events
-
2026-04-01status Pending
-
2026-03-10price $60,000
-
2026-02-17$54,500 Active
-
1989-10-30soldstatus $30,650
ⓘ Source: listings_history table (triggers on properties + properties_extension) + one-shot
backfill from property_details.listing_events for pre-trigger history.
Tax reassessment forecast KY · Resets to sale price
- Current annual tax
- $782 · $65/mo
- Projected year-2 tax
- $782 · $65/mo
- Expected delta
- $0/yr ($0/mo · 0.0%)
ⓘ Screening estimate from a state-policy table — verify with the county assessor before closing.
Climate risk First Street
- Flood 7/10 Severe FEMA zone X (unshaded) · 76% chance over 30 yrs
- Wildfire 1/10 Low
- Heat 4/10 Moderate 7 d/yr ≥103°F today · 19 d/yr by 30 yrs out
- Wind 2/10 Low 100% chance of damaging wind over 30 yrs
- Air quality 3/10 Moderate 2 unhealthy d/yr today · 3 by 30 yrs out
Nearby sold comps map
Loading sold comps map…
Walkable amenities ~0.75 mi
Loading nearby amenities…
Taxation est. · year 1
- Rental income
- $23,843
- − Mortgage interest
- −$3,361
- − Property taxes
- −$782
- − Insurance
- −$1,098
- − Repairs & maintenance
- −$1,907
- − Management
- −$1,907
- − Depreciation
- −$1,745
- Taxable income
- $13,043
- Est. tax owed @ 24.0%
- −$3,130
- After-tax cash flow
- $10,051/yr
For passive investors: Depreciation is non-cash, so a rental often shows a tax loss while cash-flowing — sheltering income. Rental losses are passive: they offset passive income freely, and up to $25,000/yr can offset ordinary (W-2) income if you actively participate and your MAGI is under $100k (phasing out to $0 by $150k); unused losses carry forward. On sale, claimed depreciation is recaptured at up to 25%, and gains may owe capital-gains tax (a 1031 exchange can defer both). Figures are a year-1 estimate at your 24.0% rate — not tax advice; consult a CPA.
Schools (NCES district)
- District
- Covington Independent
- NCES district ID
- 2101350
- Math proficiency
- 10% ▼ -20.00%
- Reading proficiency
- 27% ▼ -14.00%
- Median HH income
- $33,681
- Composite
- 15.04/100
- National rank
- #9353
- State rank
- #162 of 165 in KY
Livability — Covington
- Score
- 86/100
- State rank
- #40
- US rank
- #376
Category grades
Schools grade is shown separately in the Schools card above.
Census & demographics
- Census place
- Covington, KY
- County
- Kenton County · 142,881 people
- City population
- 34,373
- Metro
- Cincinnati, OH-KY-IN
- Population (ZIP)
- 26,981
- Household income
- $69,970
- Rent vs Own
- Severe rent burden
- 1488.0
Population outlook (Kenton County) Hauer SSP2
- Today (2025)
- 174,205 people
- By 2030
- 177,897 · +2.1%
- By 2040
- 182,671 · +4.9%
- By 2050
- 183,543 · +5.4%
- By 2075
- 178,977 · +2.7%
- By 2100
- 159,920 · -8.2%
Race, ethnicity, and origin ACS 2023
- Neighborhood character
- Predominantly White (72%)
- Race & ethnicity
- White 72% Hispanic / Latino 12% Black 10% Two or more races 7% Asian 1%
- Hispanic origin (detail)
- Mexican 2%
- Common ancestry
- Lithuanian 2% Italian 1% Slovak 1%
- Foreign-born
- 7% · Canada
- Languages at home
- 90% English-only · Spanish 6% Other Indo-European 1%
Political lean MEDSL · Kenton
- 2024 margin
- Strong R (+21.7) · D 38.2% · R 59.9% · Other 1.9%
- 2008→2024 swing
- -0.9pp no change · 2008: -20.9pp · 2024: -21.7pp
- All cycles
- 2024: R+21.7 2020: R+19.3 2016: R+26.1 2012: R+24.3 2008: R+20.9
Not yet ingested
- Civics
- —
Market trends
- HPI YoY
- ▼ -215.20%
- Current HPI
- 237.0869
- Rent YoY
- ▲ 1.55%
- Metro
- Cincinnati, OH-KY-IN
- State GDP YoY
- ▲ 1.81%
- F500 in state
- 4
Industry mix (Fortune 500 HQ in KY)
| Industry | F500 HQs | Revenue |
|---|---|---|
| Healthcare | 1 | $118B |
|
||
| Food / Beverage | 1 | $7B |
|
||
Price history
+95.8% since first listed4 events — show timeline
- 2026-04-01 Pending — NKMLS
- 2026-03-10 Price Changed $60,000 NKMLS
- 2026-02-17 Listed $54,500 NKMLS
- 1989-10-30 Sold (Public Records) $30,650 Public Records
Property tax history
+2.5%/yrLatest (2025): $782 · -3.7% YoY. Source: county tax records.
Cash-flow waterfall
monthlySold comps — $/sqft
last 12 mo · ≤1 miLoading sold comps…