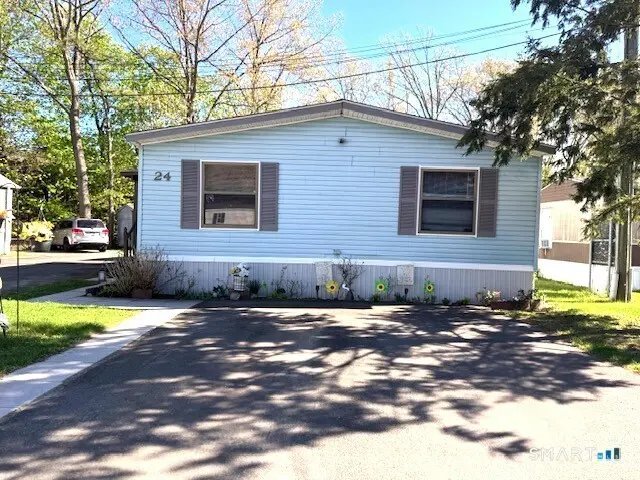
217 Dunham St Lot 24 · Bristol, CT
Flood risk 1/10 · Minimal
- FEMA flood zone
- X (unshaded)
- Chance of flooding over 30 yrs
- 0.0%
- Est. flood insurance / yr
- $507 – $1,088
Fire risk 1/10 · Minimal
- Est. fire insurance / yr
- $829 – $1,539
Heat risk 5/10 · Moderate
- Hot days now (above 97°F)
- 7 days/yr
- Hot days in 30 yrs
- 15 days/yr
Wind risk 6/10 · Moderate
- Chance of severe wind over 30 yrs
- 27.0%
Air-quality risk 3/10 · Minor
- Unhealthy air days now
- 2 days/yr
- Unhealthy air days in 30 yrs
- 3 days/yr
Risk factors via First Street. Map © Google.
Why this score? — see what drove the D+ grade
The composite is a weighted blend of 9 inputs, each scored 0–100. Each bar is that input's sub-score; the figure is the points it added to the 100-point composite (weight × sub-score).
- Cash flow +12.3/30.0
- 1% rule +7.6/10.0
- ARV discount +7.5/15.0
- Schools +5.2/10.0
- Livability +4.0/5.0
- DSCR +3.7/10.0
- Rent growth +2.5/5.0
- Condition / age +2.5/5.0
- Appreciation +0.0/10.0
$169,900
🖨 Deal sheet (PDF) 📄 Offer letter ✓ Due diligence
Listing remarks
Very Well maintained Ranch Style, OPEN FLOOR concept Manufactured Home is located in an ALL Age Manufactured Home Community. Offering Three Bedrooms with two Full bathrooms (one is a Primary Suite), Living Room, Dining Room, Kitchen and Laundry Room. Many updates: Propane Furnace, Roof, Appliances, Interior and more. Additional enjoyment with a closed in Porch and outdoor Patio with retractable Awning plus Shed for extra Storage.
Key facts
- Closed in porch
- Retractable awning
- Open floor concept
Tags
Property features AI
Finance
- Other: Living area approximately 1215 (per public record)
- Financial info: Property managed professionally off-site
- HOA & community: Homeowners association with a $600 monthly fee; Association fees include water, sewer, property management, and road maintenance
Exterior
- Parking: Private paved driveway; 2 parking spaces
- Utilities: Public water connected; Public sewer connected (sewer included in lot rent plus an annual usage fee); Propane fuel tank above ground; Electric hot water
- Home design: Single-family home; On leased land; Light blue exterior
- Construction: Frame/prefab construction; Asphalt shingle roof; No basement
- Exterior features: Enclosed porch; Porch; Patio; Awnings; Rear lot; Interior lot; Dry, level lot
Interior
- Kitchen: Gas range; Refrigerator; Dishwasher
- Bedrooms: 3 bedrooms
- Bathrooms: 2 full bathrooms
- Heating & cooling: Central air; Hot air heating fueled by propane; 40-gallon electric hot water tank
- Interior features: Open floor plan; Cable pre-wired
- Laundry & utility: Laundry room off the kitchen on the main level
Neighborhood map
What this means for you Summary
Snapshot
- This is a 3-bed/2.0-bath manufactured listed at $170k.
Deal economics
- At list price, monthly cash flow is $-31 ($-368/yr) — negative.
- To cash-flow at today's rent, offer at most $164k (3.2% below list).
- Meets the 1% rule at list price ($2k rent vs $170k).
- Recommended offer: $164k (3.2% below list) — sets the bar for cash-flow.
- Cap rate 6.1% vs local median 3.3% in Bristol — top-decile yield for the area; either an underpriced asset or a hidden risk that comps aren't pricing in. Stress-test before assuming the spread holds.
Location & tenants
- Location reads 81/100 on livability (#21 in CT, #1,585 nationally) — a professional / high-income tenant draw. Strengths: crime A+, housing A+, health & safety A+; Watch: commute F.
- Southington School District (suburban): math 52% / reading 64% proficiency, ranked #51 of 153 in CT (top 33%) — acceptable for families but not a draw, mixed tenant base, ~2y average lease; only 11% free/reduced lunch — higher-income household profile.
- Zoned schools: Thalberg Elementary School (math 52% / reading 56%, grade C, #207 of 553 statewide, top 38%, 431 students, 19% FRL); Joseph A. Depaolo Middle School (math 43% / reading 63%, grade C+, #71 of 175 statewide, top 41%, 694 students, 24% FRL); Southington High School (math 48% / reading 68%, grade C, #50 of 194 statewide, top 25%, 1,945 students, 22% FRL).
- Market conditions: 111 active listings in the ZIP; 3 comparable units currently listed for rent nearby; rentals at typical pace (median 25d on market — plan ~3-4 weeks tenant-placement turnaround); high-income renter base; 1,867 units permitted in Capitol Planning Region in 2024 (1,399 in 5+ unit buildings).
Forward outlook
- Local home prices are declining (-3.0%/yr); year-one equity from $1k of loan paydown is wiped out by about $5k of value loss. Plan a longer hold.
Negotiation context
- It's been on market 51 days — a 3% lower offer ($165k) is reasonable based on typical stale-listing flexibility.
- 2 sale attempts since 10y ago; this cycle's ask has dropped $20k (11%) from the opening price — seller is motivated, your offer sets the floor, not the list.
Risks & watch-outs
- Watch-outs: HOA is 28% of rent.
- Climate carrying-cost: major wind risk, 27% chance of damaging wind over 30y; extreme-heat days projected 7→15/yr by 2055 (HVAC capex compounding) — expect insurance premiums to compound above CPI over the hold.
Questions for the listing agent
- What do current leases actually rent for vs. the listed asking? Can we see a recent rent roll and the last 12 months of T-12 income?
- It's been on market 51 days. Have you received any prior offers? Is the seller open to a 3% concession, seller financing, or rate buy-down credit?
- What does the HOA fee cover, when was the last increase, and are there any pending special assessments or reserve-fund shortfalls?
- Is there a deadline driving the sale (1031 exchange, divorce, estate, relocation)? That informs how much negotiation room exists.
- The area grade is low — what's the realistic commute time and amenity access for the typical tenant pool here? Any planned neighborhood developments (good or bad) we should know about?
- What's the average days-on-market for RENTAL listings here right now (not sales)? A rising rental-DOM trend means longer vacancies and softer asking-rent achievability than the comps imply.
- What's the recent tenant-quality profile in this submarket — average credit score on applications, eviction rate, late-payment / NSF rate, and stable-employment percentage? A property-management company in the area should have these aggregated.
- How much new for-sale + rental construction is in the pipeline within 1–3 miles? Heavy new supply typically softens prices + rents 12–24 months out; constrained supply supports both.
Investment metrics
- 1% rule
- 1.26% ✓
- Cap rate
- 6.08%
- Cash-on-cash
- -0.77%
- DSCR
- 0.97
- GRM
- 6.6
CMA / ARV
- ARV (median comp)
- $349,244
- List price
- $169,900
- Delta
- -51.35%
- Verdict
- UNDERPRICED
- Comps
- 20 within 1.0 mi
Projected returns pro-forma
-3.0% appreciation · 3.0% rent growth · sell at horizon
- IRR
- -17.3%
- Equity multiple
- 0.39×
- Total profit
- $-29,113
- Equity at exit
- $25,333
- IRR
- -8.8%
- Equity multiple
- 0.45×
- Total profit
- $-26,355
- Equity at exit
- $14,690
Cash invested: $47,572 (down + closing). Projections, not guarantees.
Landlord ↔ Tenant lean methodology
- Overall (STATE)
- 27 Tenant-Leaning
- State Connecticut
- 27 Tenant-Leaning · D+7
- County
- — inherits STATE
- City
- — inherits STATE
ZIP-level market 06489
- Active inventory
- 111
- Price-to-rent
- 6.6×
Monthly cashflow live
- Estimated rent
- $2,147 medium interval (Pro) →
- Mortgage (P&I)
- −$891
- Tax from tax record
- −$165 /mo · $1,981/yr
- Insurance
- −$71
- HOA
- −$600
- Vacancy / Maint / Mgmt
- −$451
- Net cashflow
- $-31
Break-even live
Sensitivity live
| Price | -10% $66 | -5% $17 | +0% $-31 | +5% $-79 | +10% $-127 |
|---|---|---|---|---|---|
| Rent | -10% $-200 | -5% $-115 | +0% $-31 | +5% $54 | +10% $139 |
| Rate | -1.0pp $55 | -0.5pp $13 | base $-31 | +0.5pp $-75 | +1.0pp $-119 |
UW: 25.0% down · 7.5% · 30yr · 1.5% tax · 5.0% vac · 8.0% maint · 8.0% mgmt
Financing live
Cash to close
- Down payment
- $42,475
- Closing costs
- $5,097
- Reserves months
- —
- Total cash needed
- —
Loan-product check · same deal, 3 products live
Conventional
25% down · 7.5% · 30yr
- Down + closing
- —
- Monthly P&I
- —
- Monthly cashflow
- —
- DSCR
- —
- Eligible?
- —
Personal DTI + credit; lowest rate.
DSCR
20% down · 8.5% · 30yr
- Down + closing
- —
- Monthly P&I
- —
- Monthly cashflow
- —
- DSCR
- —
- Eligible?
- —
No personal income docs; deal must DSCR.
Hard money
10% down · 12.0% · 12mo
- Down + closing
- —
- Monthly P&I
- —
- Monthly cashflow
- —
- DSCR
- —
- Eligible?
- —
Short-term bridge; refi at stabilization.
Rent comps 3 comps
| Address | Beds | Baths | Sqft | Rent | $/sqft | DOM | Units | Dist |
|---|---|---|---|---|---|---|---|---|
| 5 Stoughton Rd Southington, CT | 2.0 | 1.0 | 720 | $1,850 | $2.57 | 45d | 1 | 0.66mi |
| 270 East St Unit R Plainville, CT | 2.0 | 1.0 | 792 | $2,200 | $2.78 | 20d | 1 | 1.12mi |
| 273 Queen St Unit 16F Southington, CT | 2.0 | 1.5 | 920 | $1,920 | $2.09 | 25d | 1 | 1.47mi |
HOA detail
- Monthly dues
- $600 · $7,200/yr
Listing history 19 events
-
2026-06-22days on market $169,900 Active 51 DOM
-
2026-06-18days on market $169,900 Active 48 DOM
-
2026-06-17price $169,900 Active 47 DOM
-
2026-06-17days on market $179,900 Active 47 DOM
-
2026-06-16days on market $179,900 Active 46 DOM
-
2026-06-15days on market $179,900 Active 45 DOM
-
2026-06-13days on market $179,900 Active 43 DOM
-
2026-06-10days on market $179,900 Active 40 DOM
-
2026-06-09days on market $179,900 Active 39 DOM
-
2026-06-08days on market $179,900 Active 38 DOM
-
2026-06-07days on market $179,900 Active 37 DOM
-
2026-06-05days on market $179,900 Active 34 DOM
-
2026-06-03days on market $179,900 Active 33 DOM
-
2026-06-02days on market $179,900 Active 32 DOM
-
2026-06-01days on market $179,900 Active 31 DOM
-
2026-05-31days on market $179,900 Active 30 DOM
-
2026-05-01$189,900 Active 433-char remark
-
2016-08-04historical
-
2016-07-28$69,900
ⓘ Source: listings_history table (triggers on properties + properties_extension) + one-shot
backfill from property_details.listing_events for pre-trigger history.
Tax reassessment forecast CT · Partial reset (capped growth)
- Current annual tax
- $1,981 · $165/mo
- Projected year-2 tax
- $2,808 · $234/mo
- Expected delta
- +$827/yr (+$69/mo · 41.8%)
ⓘ Screening estimate from a state-policy table — verify with the county assessor before closing.
Climate risk First Street
- Flood 1/10 Low FEMA zone X (unshaded) · 0% chance over 30 yrs
- Wildfire 1/10 Low
- Heat 5/10 Major 7 d/yr ≥97°F today · 15 d/yr by 30 yrs out
- Wind 6/10 Major 27% chance of damaging wind over 30 yrs
- Air quality 3/10 Moderate 2 unhealthy d/yr today · 3 by 30 yrs out
Nearby sold comps map
Loading sold comps map…
Walkable amenities ~0.75 mi
Loading nearby amenities…
Taxation est. · year 1
- Rental income
- $25,765
- − Mortgage interest
- −$9,517
- − Property taxes
- −$1,981
- − Insurance
- −$850
- − Repairs & maintenance
- −$2,061
- − Management
- −$2,061
- − HOA
- −$7,200
- − Depreciation
- −$4,943
- Taxable loss
- −$2,848
- Est. tax savings @ 24.0%
- +$683
- After-tax cash flow
- $315/yr
For passive investors: Depreciation is non-cash, so a rental often shows a tax loss while cash-flowing — sheltering income. Rental losses are passive: they offset passive income freely, and up to $25,000/yr can offset ordinary (W-2) income if you actively participate and your MAGI is under $100k (phasing out to $0 by $150k); unused losses carry forward. On sale, claimed depreciation is recaptured at up to 25%, and gains may owe capital-gains tax (a 1031 exchange can defer both). Figures are a year-1 estimate at your 24.0% rate — not tax advice; consult a CPA.
Schools (NCES district)
- District
- Southington School District
- NCES district ID
- 0904230
- Math proficiency
- 52% ▼ -9.00%
- Reading proficiency
- 64% ▼ -5.00%
- Median HH income
- $81,467
- Composite
- 52.38/100
- National rank
- #1581
- State rank
- #51 of 153 in CT
Livability — Bristol
- Score
- 81/100
- State rank
- #21
- US rank
- #1585
Category grades
Schools grade is shown separately in the Schools card above.
Census & demographics
- County
- Hartford County · 754,208 people
- City population
- 61,684
- Metro
- Hartford-East Hartford-Middletown, CT
- Population (ZIP)
- 32,706
- Household income
- $126,465
- Rent vs Own
- Severe rent burden
- 513.0
Population outlook (Capitol County) Hauer SSP2
- By 2040
- 1,063,519
Race, ethnicity, and origin ACS 2023
- Neighborhood character
- Predominantly White (87%)
- Race & ethnicity
- White 87% Two or more races 6% Hispanic / Latino 5% Asian 2% Black 1%
- Hispanic origin (detail)
- Puerto Rican 3%
- Common ancestry
- Romanian 13% Lithuanian 7% Russian 2%
- Foreign-born
- 9% · Canada, China, Jamaica
- Languages at home
- 88% English-only · Other Indo-European 4% Spanish 3% Russian/Polish/Slavic 2%
Political lean MEDSL · Capitol
- 2024 margin
- Strong D (+21.9) · D 60.1% · R 38.2% · Other 1.7%
- All cycles
- 2024: D+21.9
Not yet ingested
- Civics
- —
Market trends
- HPI YoY
- ▼ -161.57%
- Current HPI
- 179.8884
- Rent YoY
- —
- Metro
- Hartford-East Hartford-Middletown, CT
- State GDP YoY
- ▲ 1.06%
- F500 in state
- 38
Industry mix (Fortune 500 HQ in CT)
| Industry | F500 HQs | Revenue |
|---|---|---|
| Industrial Machinery | 4 | $38B |
|
||
| Insurance | 3 | $71B |
|
||
| Financial Services | 2 | $25B |
|
||
| Transportation / Logistics | 2 | $18B |
|
||
| Healthcare | 1 | $247B |
|
||
| Telecommunications | 1 | $55B |
|
||
Price history
+143.1% since first listed5 events — show timeline
- 2026-06-17 Price Changed $169,900 Smart MLS
- 2026-05-22 Price Changed $179,900 Smart MLS
- 2026-05-01 Listed $189,900 Smart MLS
- 2016-08-04 Listing Removed — Smart MLS
- 2016-07-28 Listed $69,900 Smart MLS
Property tax history
+3.0%/yrLatest (2025): $1,981 · +5.7% YoY. Source: county tax records.
Cash-flow waterfall
monthlySold comps — $/sqft
last 12 mo · ≤1 miLoading sold comps…