17021 N Bay Rd · Sunny Isles Beach, FL
Flood risk No data
- FEMA flood zone
- —
- Chance of flooding over 30 yrs
- —
- Est. flood insurance / yr
- —
Fire risk No data
- Est. fire insurance / yr
- —
Heat risk No data
- Hot days now (above threshold)
- —
- Hot days in 30 yrs
- —
Wind risk No data
- Chance of severe wind over 30 yrs
- —
Air-quality risk No data
- Unhealthy air days now
- —
- Unhealthy air days in 30 yrs
- —
Risk factors via First Street. Map © Google.
Why this score? — see what drove the B- grade
The composite is a weighted blend of 9 inputs, each scored 0–100. Each bar is that input's sub-score; the figure is the points it added to the 100-point composite (weight × sub-score).
- Cash flow +24.9/30.0
- DSCR +8.1/10.0
- ARV discount +7.5/15.0
- 1% rule +6.5/10.0
- Appreciation +5.3/10.0
- Condition / age +4.8/5.0
- Livability +4.3/5.0
- Schools +4.2/10.0
- Rent growth +2.7/5.0
$329,500
🖨 Deal sheet 📄 Offer letter ✓ Due diligence
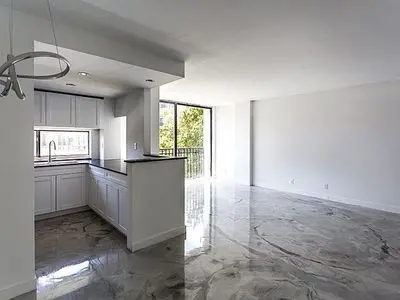
Listing remarks
Completely remodeled home, new floor, new kitchen, new bathrooms, new appliances, top location in Sunny Isles Beach, Florida& apos; s Riviera, great huge deck on the same level as apartment with a barbecue area, tennis courts, basketball courts and restrooms, five minute walk to the beach and right next to a plaza with stores, restaurants and a big park. A great place for a home that you don& apos; t have to worry about fixing things in a log time or a great investment.
Key facts
- New kitchen
- Barbecue area
- Tennis courts
Tags
Neighborhood map
What this means for you Summary
Snapshot
- This is a 1-bed/2.0-bath condo listed at $330k. Condition is rated excellent.
Deal economics
- At list price, monthly cash flow is $708 ($8k/yr) — positive.
- The deal already cash-flows at list — no discount required.
- Meets the 1% rule at list price ($4k rent vs $330k).
- Recommended offer: $320k (3.0% below list) — sets the bar for market timing.
- Cap rate 8.9% vs local median 0.8% in Sunny Isles Beach — top-decile yield for the area; either an underpriced asset or a hidden risk that comps aren't pricing in. Stress-test before assuming the spread holds.
Location & tenants
- Location reads 86/100 on livability (#20 in FL, #434 nationally) — a professional / high-income tenant draw. Strengths: schools A+, amenities A+, health & safety A+; Watch: housing C-, cost of living F.
- Miami-Dade (suburban): math 45% / reading 54% proficiency, ranked #40 of 73 in FL (top 55%) — families likely to look elsewhere, expect single-tenant / working-renter base with shorter leases; 64% free/reduced lunch — lower-income household profile, screen leases tightly.
- Market conditions: Rents flat; 1870 active listings in the ZIP; 10,051 units permitted in Miami-Dade County in 2024 (7,758 in 5+ unit buildings).
- At $3,778/mo this rent would consume 68% of the median local household income ($67k/yr) (locally 3106% of renters already pay >50% of income on rent) — very limited rent-growth headroom before tenants either downsize or default.
Forward outlook
- In year one you build about $4k of equity ($2k loan paydown + $2k appreciation (0.5% local appreciation)).
- Miami-Dade County population projected at +28% by 2050 — long-run rental-demand tailwind backs the buy-and-hold thesis.
- At projected returns (0.5% appreciation + 0.9% rent growth), your $92k cash investment doubles in ~7 years — after that, you're playing with house money.
- By year 8, paydown + projected appreciation supports a ~$35k cash-out refi (75% LTV) — recoverable capital for the next deal without selling this one.
Negotiation context
- It's been on market 37 days — a 3% lower offer ($320k) is reasonable based on typical stale-listing flexibility.
- 54 sale attempts since 3y ago with the ask held roughly flat each time — persistent listings suggest the price (not the market) is what's stuck; bring a comps-based counter.
Questions for the listing agent
- It's been on market 37 days. Have you received any prior offers? Is the seller open to a 3% concession, seller financing, or rate buy-down credit?
- Built in 1979 — when were the roof, HVAC, electrical panel, plumbing, and water heater last replaced?
- Any open or pending special assessments — roof, HVAC, plumbing, elevator, façade? What's the per-unit balance and payoff schedule, and is the seller paying it off at close or rolling it to the buyer?
- Is there a deadline driving the sale (1031 exchange, divorce, estate, relocation)? That informs how much negotiation room exists.
- Schools are A-rated — typically a magnet for longer-tenancy family renters. What's the average tenant stay here, and is there a school-zone premium baked into asking?
- What's the average days-on-market for RENTAL listings here right now (not sales)? A rising rental-DOM trend means longer vacancies and softer asking-rent achievability than the comps imply.
- What's the recent tenant-quality profile in this submarket — average credit score on applications, eviction rate, late-payment / NSF rate, and stable-employment percentage? A property-management company in the area should have these aggregated.
- How much new apartment / multifamily construction is in the pipeline within 1–3 miles? Heavy new supply (>2% of stock underway) typically softens rents 12–24 months out; light construction supports rent growth.
Investment metrics
- 1% rule
- 1.15% ✓
- Cap rate
- 8.87%
- Cash-on-cash
- 9.21%
- DSCR
- 1.41
- GRM
- 7.3
CMA / ARV
No comps found within radius.
Projected returns pro-forma
0.53% appreciation · 0.94% rent growth · sell at horizon
- IRR
- 8.1%
- Equity multiple
- 1.39×
- Total profit
- $36,077
- Equity at exit
- $104,449
- IRR
- 11.1%
- Equity multiple
- 2.22×
- Total profit
- $112,246
- Equity at exit
- $132,787
Cash invested: $92,260 (down + closing). Projections, not guarantees.
Landlord ↔ Tenant lean methodology
- Overall (STATE)
- 87 Strongly Landlord-Friendly
- State Florida
- 87 Strongly Landlord-Friendly · R+3
- County
- — inherits STATE
- City
- — inherits STATE
ZIP-level market 33160
- Home prices YoY
- 0.2%
- Rents YoY
- 0.9%
- Active inventory
- 1870
- Price-to-rent
- 7.3×
Monthly cashflow live
- Estimated rent
- $3,778 medium interval (Pro) →
- Mortgage (P&I)
- −$1,728
- Tax est. 1.5%
- −$412 /mo · $4,942/yr
- Insurance
- −$137
- HOA
- −$0
- Vacancy / Maint / Mgmt
- −$793
- Net cashflow
- $708
Break-even live
UW: 25.0% down · 7.5% · 30yr · 1.5% tax · 5.0% vac · 8.0% maint · 8.0% mgmt
Financing live
Cash to close
- Down payment
- $82,375
- Closing costs
- $9,885
- Reserves months
- —
- Total cash needed
- —
Loan-product check · same deal, 3 products live
Conventional
25% down · 7.5% · 30yr
- Down + closing
- —
- Monthly P&I
- —
- Monthly cashflow
- —
- DSCR
- —
- Eligible?
- —
Personal DTI + credit; lowest rate.
DSCR
20% down · 8.5% · 30yr
- Down + closing
- —
- Monthly P&I
- —
- Monthly cashflow
- —
- DSCR
- —
- Eligible?
- —
No personal income docs; deal must DSCR.
Hard money
10% down · 12.0% · 12mo
- Down + closing
- —
- Monthly P&I
- —
- Monthly cashflow
- —
- DSCR
- —
- Eligible?
- —
Short-term bridge; refi at stabilization.
HOA detail condo
- Monthly dues
- $0 · $0/yr
- Assessments
- None detected in remarks — confirm with the listing agent.
Listing history 50 events
-
2026-06-18days on market $329,500 Active 37 DOM
-
2026-06-17days on market $329,500 Active 36 DOM
-
2026-06-16days on market $329,500 Active 35 DOM
-
2026-06-15days on market $329,500 Active 34 DOM
-
2026-06-13days on market $329,500 Active 32 DOM
-
2026-06-09days on market $329,500 Active 28 DOM
-
2026-06-08days on market $329,500 Active 27 DOM
-
2026-06-08days on market $329,500 Active 26 DOM
-
2026-06-04days on market $329,500 Active 23 DOM
-
2026-06-03days on market $329,500 Active 22 DOM
-
2026-06-02days on market $329,500 Active 21 DOM
-
2026-06-01days on market $329,500 Active 20 DOM
-
2026-05-31days on market $329,500 Active 19 DOM
-
2026-05-12$329,500 Active
-
2026-04-03$1,890
-
2026-03-31$1,890
-
2026-03-30historical $3,200
-
2026-03-19historical $3,200
-
2026-03-18$3,200
-
2026-03-14$2,000
-
2025-10-09historical $1,999
-
2025-10-04historical $1,999
-
2025-09-12$1,999
-
2025-09-07$3,000
-
2025-06-27historical $1,368
-
2025-05-13$1,368
-
2025-05-09historical $3,300
-
2025-02-22$3,300
-
2025-01-25historical $2,800
-
2025-01-25historical $2,800
-
2025-01-25$2,800
-
2025-01-21$3,300
-
2025-01-18historical $3,300
-
2025-01-16historical $3,300
-
2025-01-16historical $3,300
-
2025-01-11historical $3,300
-
2025-01-11$3,300
-
2025-01-06$3,300
-
2025-01-06historical $3,300
-
2025-01-01historical $3,300
-
2025-01-01$3,300
-
2024-12-31$2,600
-
2024-12-28$3,300
-
2024-12-28historical $3,300
-
2024-12-23historical $3,300
-
2024-12-23$3,300
-
2024-12-19$3,300
-
2024-12-19historical $1,900
-
2024-12-18$1,900
-
2024-12-14$3,300
ⓘ Source: listings_history table (triggers on properties + properties_extension) + one-shot
backfill from property_details.listing_events for pre-trigger history.
Nearby sold comps map
Loading sold comps map…
Walkable amenities ~0.75 mi
Loading nearby amenities…
Taxation est. · year 1
- Rental income
- $45,342
- − Mortgage interest
- −$18,457
- − Property taxes
- −$4,942
- − Insurance
- −$1,648
- − Repairs & maintenance
- −$3,627
- − Management
- −$3,627
- − Depreciation
- −$9,585
- Taxable income
- $3,455
- Est. tax owed @ 24.0%
- −$829
- After-tax cash flow
- $7,666/yr
For passive investors: Depreciation is non-cash, so a rental often shows a tax loss while cash-flowing — sheltering income. Rental losses are passive: they offset passive income freely, and up to $25,000/yr can offset ordinary (W-2) income if you actively participate and your MAGI is under $100k (phasing out to $0 by $150k); unused losses carry forward. On sale, claimed depreciation is recaptured at up to 25%, and gains may owe capital-gains tax (a 1031 exchange can defer both). Figures are a year-1 estimate at your 24.0% rate — not tax advice; consult a CPA.
Condition & rehab AI · 2 photos
This completely remodeled condo in Sunny Isles Beach, Florida is in excellent condition with no visible repairs needed. It offers a great location and is move-in ready with a huge deck and access to amenities.
Value-add opportunities
- Both landscaping — Enhances curb appeal and adds value
- Both furniture — Completes the living space and makes it move-in ready
Renovation cost estimate screening
Value-add ROI direction
- Both landscaping — Enhances curb appeal and adds value ↑
- Both furniture — Completes the living space and makes it move-in ready ↑
ⓘ Cost ranges are severity-bucket heuristics (US national rule-of-thumb). Get contractor quotes + a written scope before underwriting a rehab budget.
Schools (NCES district)
- District
- Miami-Dade
- NCES district ID
- 1200390
- Math proficiency
- 45% ▼ -16.00%
- Reading proficiency
- 54% ▼ -5.00%
- Median HH income
- $43,928
- Composite
- 41.76/100
- National rank
- #3397
- State rank
- #40 of 73 in FL
Livability — Sunny Isles Beach
- Score
- 86/100
- State rank
- #20
- US rank
- #434
Category grades
Schools grade is shown separately in the Schools card above.
Census & demographics
- Census place
- Sunny Isles Beach, FL
- County
- Miami-Dade County · 2,697,751 people
- Metro
- Miami-Fort Lauderdale-Pompano Beach, FL
- Population (ZIP)
- 43,718
- Household income
- $67,040
- Rent vs Own
- Severe rent burden
- 3106.0
Population outlook (Miami-Dade County) Hauer SSP2
- Today (2025)
- 3,126,439 people
- By 2030
- 3,325,765 · +6.4%
- By 2040
- 3,697,561 · +18.3%
- By 2050
- 4,012,134 · +28.3%
- By 2075
- 4,605,612 · +47.3%
- By 2100
- 4,866,598 · +55.7%
Race, ethnicity, and origin ACS 2023
- Neighborhood character
- Diverse neighborhood (Simpson 0.59)
- Race & ethnicity
- Hispanic / Latino 46% White 44% Two or more races 27% Black 4% Asian 2%
- Hispanic origin (detail)
- Mexican 1% Puerto Rican 3% Cuban 8% Dominican 1% Salvadoran 4%
- Common ancestry
- Scotch-Irish 8% Hispanic 3% Subsaharan African 3%
- Foreign-born
- 61% · Canada, Jamaica, Dominican Republic
- Languages at home
- 29% English-only · Spanish 45% Russian/Polish/Slavic 12% Other Indo-European 5%
Political lean MEDSL · Miami-Dade
- 2024 margin
- R (+11.4) · D 43.9% · R 55.4%
- 2008→2024 swing
- -27.6pp toward R · 2008: 16.1pp · 2024: -11.4pp
- All cycles
- 2024: R+11.4 2020: D+7.3 2016: D+29.6 2012: D+23.7 2008: D+16.1
Not yet ingested
- Civics
- —
Market trends
- HPI YoY
- ▲ 0.53%
- Current HPI
- 284.9293
- Rent YoY
- ▲ 0.94%
- Metro
- Miami-Fort Lauderdale-Pompano Beach, FL
- State GDP YoY
- ▲ 3.28%
- F500 in state
- 36
Industry mix (Fortune 500 HQ in FL)
| Industry | F500 HQs | Revenue |
|---|---|---|
| Industrial Technology | 2 | $29B |
|
||
| Insurance | 2 | $17B |
|
||
| Retail | 1 | $60B |
|
||
| Technology Distribution | 1 | $58B |
|
||
| Homebuilding | 1 | $35B |
|
||
| Technology Manufacturing | 1 | $35B |
|
||
Price history
+16375.0% since first listed106 events — show timeline
- 2026-05-12 Listed $329,500 FSBO.com
- 2026-04-03 Listed for Rent $1,890 REALLYO
- 2026-03-31 Listed for Rent $1,890 RENTALBEAST
- 2026-03-30 Rental Removed $3,200 SHOWMOJO
- 2026-03-19 Rental Removed $3,200 REALLYO
- 2026-03-18 Listed for Rent $3,200 REALLYO
- 2026-03-14 Listed for Rent $2,000 SHOWMOJO
- 2025-10-09 Rental Removed $1,999 LISTANZA
- 2025-10-04 Rental Removed $1,999 LISTANZA
- 2025-09-12 Listed for Rent $1,999 LISTANZA
- 2025-09-07 Listed for Rent $3,000 LISTANZA
- 2025-06-27 Rental Removed $1,368 SHOWMOJO
- 2025-05-13 Listed for Rent $1,368 SHOWMOJO
- 2025-05-09 Rental Removed $3,300 REALLYO
- 2025-02-22 Listed for Rent $3,300 REALLYO
- 2025-01-25 Rental Removed $2,800 LISTANZA
- 2025-01-25 Rental Removed $2,800 REALLYO
- 2025-01-25 Listed for Rent $2,800 LISTANZA
- 2025-01-21 Listed for Rent $3,300 REALLYO
- 2025-01-18 Rental Removed $3,300 MARMLS
- 2025-01-16 Rental Removed $3,300 MARMLS
- 2025-01-16 Rental Removed $3,300 REALLYO
- 2025-01-11 Rental Removed $3,300 REALLYO
- 2025-01-11 Listed for Rent $3,300 REALLYO
- 2025-01-06 Listed for Rent $3,300 REALLYO
- 2025-01-06 Rental Removed $3,300 REALLYO
- 2025-01-01 Rental Removed $3,300 REALLYO
- 2025-01-01 Listed for Rent $3,300 REALLYO
- 2024-12-31 Listed for Rent $2,600 MARMLS
- 2024-12-28 Listed for Rent $3,300 REALLYO
- 2024-12-28 Rental Removed $3,300 REALLYO
- 2024-12-23 Rental Removed $3,300 REALLYO
- 2024-12-23 Listed for Rent $3,300 REALLYO
- 2024-12-19 Listed for Rent $3,300 REALLYO
- 2024-12-19 Rental Removed $1,900 REALLYO
- 2024-12-18 Listed for Rent $1,900 MARMLS
- 2024-12-14 Listed for Rent $3,300 REALLYO
- 2024-12-14 Rental Removed $3,300 REALLYO
- 2024-12-09 Rental Removed $3,300 REALLYO
- 2024-12-09 Listed for Rent $3,300 REALLYO
- 2024-12-04 Listed for Rent $3,300 REALLYO
- 2024-12-04 Rental Removed $3,300 REALLYO
- 2024-11-29 Listed for Rent $3,300 REALLYO
- 2024-11-29 Rental Removed $3,300 REALLYO
- 2024-11-24 Listed for Rent $3,300 REALLYO
- 2024-11-24 Rental Removed $3,300 REALLYO
- 2024-11-21 Listed for Rent $3,300 REALLYO
- 2024-11-21 Rental Removed $3,300 REALLYO
- 2024-11-16 Rental Removed $3,300 REALLYO
- 2024-11-16 Listed for Rent $3,300 REALLYO
- 2024-11-12 Listed for Rent $3,300 REALLYO
- 2024-11-12 Rental Removed $3,300 REALLYO
- 2024-11-08 Listed for Rent $3,300 REALLYO
- 2024-11-08 Rental Removed $3,300 REALLYO
- 2024-11-04 Listed for Rent $3,300 REALLYO
- 2024-11-04 Rental Removed $3,300 REALLYO
- 2024-10-31 Listed for Rent $3,300 REALLYO
- 2024-10-31 Rental Removed $3,300 REALLYO
- 2024-10-27 Listed for Rent $3,300 REALLYO
- 2024-10-27 Rental Removed $3,300 REALLYO
- 2024-10-23 Listed for Rent $3,300 REALLYO
- 2024-10-23 Rental Removed $3,300 REALLYO
- 2024-10-19 Listed for Rent $3,300 REALLYO
- 2024-10-19 Rental Removed $3,300 REALLYO
- 2024-10-14 Listed for Rent $3,300 REALLYO
- 2024-10-14 Rental Removed $3,300 REALLYO
- 2024-10-10 Listed for Rent $3,300 REALLYO
- 2024-10-09 Rental Removed $3,300 RENTALBEAST
- 2024-09-05 Listed for Rent $3,300 RENTALBEAST
- 2024-09-05 Rental Removed $3,300 REALLYO
- 2024-09-04 Listed for Rent $3,300 REALLYO
- 2024-09-04 Rental Removed $3,300 REALLYO
- 2024-08-31 Rental Removed $3,300 REALLYO
- 2024-08-31 Listed for Rent $3,300 REALLYO
- 2024-08-26 Listed for Rent $3,300 REALLYO
- 2024-08-26 Rental Removed $3,300 REALLYO
- 2024-08-22 Listed for Rent $3,300 REALLYO
- 2024-08-22 Rental Removed $3,300 REALLYO
- 2024-08-20 Listed for Rent $3,300 REALLYO
- 2024-08-04 Rental Removed $3,300 REALLYO
- 2024-08-04 Rental Removed $3,300 REALLYO
- 2024-08-04 Listed for Rent $3,300 REALLYO
- 2024-08-01 Rental Removed $2,150 REALLYO
- 2024-07-31 Listed for Rent $2,150 REALLYO
- 2024-07-31 Listed for Rent $3,300 REALLYO
- 2024-07-26 Rental Removed $3,300 REALLYO
- 2024-07-26 Rental Removed $3,300 REALLYO
- 2024-07-26 Listed for Rent $3,300 REALLYO
- 2024-07-25 Listed for Rent $2,150 REALLYO
- 2024-07-25 Rental Removed $2,150 REALLYO
- 2024-07-19 Listed for Rent $2,150 REALLYO
- 2024-07-11 Rental Removed $2,150 REALLYO
- 2024-07-03 Listed for Rent $2,150 REALLYO
- 2024-07-03 Rental Removed $2,150 REALLYO
- 2024-06-25 Listed for Rent $2,150 REALLYO
- 2024-06-25 Rental Removed $2,150 REALLYO
- 2024-06-15 Listed for Rent $2,150 REALLYO
- 2024-06-15 Rental Removed $2,150 REALLYO
- 2024-06-08 Listed for Rent $2,150 REALLYO
- 2024-06-08 Rental Removed $2,150 REALLYO
- 2024-06-01 Listed for Rent $2,150 REALLYO
- 2024-06-01 Rental Removed $2,150 REALLYO
- 2024-05-24 Listed for Rent $2,150 REALLYO
- 2023-09-01 Rental Removed $1,900 RENT.
- 2023-08-23 Price Changed $1,900 RENT.
- 2023-08-01 Listed for Rent $2,000 RENT.
Cash-flow waterfall
monthlySold comps — $/sqft
last 12 mo · ≤1 miLoading sold comps…