 🏗️ New Construction
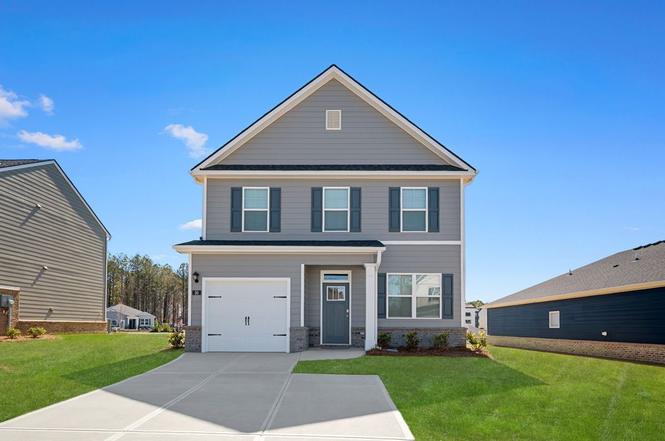
Ansley Plan · Graniteville, SC
Flood risk 1/10 · Minimal
- FEMA flood zone
- X (unshaded)
- Chance of flooding over 30 yrs
- 0.0%
- Est. flood insurance / yr
- $507 – $1,088
Fire risk 5/10 · Moderate
- Est. fire insurance / yr
- $783 – $1,453
Heat risk 7/10 · Major
- Hot days now (above 108°F)
- 7 days/yr
- Hot days in 30 yrs
- 17 days/yr
Wind risk 6/10 · Moderate
- Chance of severe wind over 30 yrs
- 68.0%
Air-quality risk 4/10 · Minor
- Unhealthy air days now
- 4 days/yr
- Unhealthy air days in 30 yrs
- 4 days/yr
Risk factors via First Street. Map © Google.
Why this score? — see what drove the D+ grade
The composite is a weighted blend of 9 inputs, each scored 0–100. Each bar is that input's sub-score; the figure is the points it added to the 100-point composite (weight × sub-score).
- Cash flow +11.2/30.0
- Appreciation +9.2/10.0
- ARV discount +7.5/15.0
- 1% rule +3.3/10.0
- DSCR +3.3/10.0
- Schools +3.2/10.0
- Livability +3.0/5.0
- Rent growth +2.5/5.0
- Condition / age +2.5/5.0
$258,800
🖨 Deal sheet (PDF) 📄 Offer letter ✓ Due diligence
Listing remarks
The Ansley floorplan at Highland Hills offers 3 bedrooms, 2 full bathrooms, plus a powder room in a two-story home covering 1,663 square feet. The one-car garage ensures space for a vehicle and plenty of storage. In this floorplan, you'll find a home that truly makes the most of its space. The open concept kitchen overlooks an airy family room and features an island that offers bar stool seating plus granite countertops and stainless steel appliances that are both stylish and energy efficient. This traditional plan also includes a separate dining area, perfect for family meals, entertaining friends and hosting the holidays. Upstairs boasts a private bedroom suite that expands the entire bac
Key facts
- Open concept kitchen
- Granite countertops
- Separate dining area
Tags
Property features AI
Finance
- Financial info: List price $258,800
Exterior
- Home design: Single-family plan (Ansley)
- Exterior features: Address: 6019 Vermilion Loop, Graniteville, SC 29829
Interior
- Bedrooms: 3 bedrooms
- Bathrooms: 2 full baths and 1 half bath (2.5 total)
- Interior features: Plan: Ansley; Living area approximately 1663
Neighborhood map
What this means for you Summary
Snapshot
- This is a 3-bed/2.5-bath townhouse listed at $259k.
Deal economics
- At list price, monthly cash flow is $-96 ($-1k/yr) — negative.
- To cash-flow at today's rent, offer at most $234k (9.6% below list).
- To meet the 1% rule (rent ≥ 1% of price), the offer needs to be $205k (21.0% below list).
- Recommended offer: $205k (21.0% below list) — sets the bar for 1% rule.
Location & tenants
- Location reads 59/100 on livability (#240 in SC) — a working-class tenant base; expect higher turnover. Strengths: cost of living A+, crime B+; Watch: amenities F, commute F, employment F.
- Aiken 01 (suburban): math 31% / reading 44% proficiency, ranked #36 of 80 in SC (top 45%) — families likely to look elsewhere, expect single-tenant / working-renter base with shorter leases.
- Zoned schools: Byrd Elementary (math 28% / reading 36%, grade F, #369 of 597 statewide, top 64%, 657 students, 37% FRL); Leavelle Mccampbell Middle (math 19% / reading 32%, grade F, #162 of 229 statewide, top 71%, 650 students, 55% FRL); Midland Valley High (math 31% / reading 83%, grade C, #120 of 196 statewide, top 64%, 1,477 students, 62% FRL) — zoned schools at 51% FRL track the district average.
- Market conditions: 298 active listings in the ZIP; 15 comparable units currently listed for rent nearby; rentals at typical pace (median 23d on market — plan ~3-4 weeks tenant-placement turnaround); solid renter incomes; 2,500 units permitted in Aiken County in 2024 (1,023 in 5+ unit buildings).
Forward outlook
- In year one you build about $22k of equity ($2k loan paydown + $21k appreciation (8.4% local appreciation)).
- Aiken County population projected at +9% by 2050 — modest demand growth; plan on rents tracking national, not racing it.
- By year 2, paydown + projected appreciation supports a ~$36k cash-out refi (75% LTV) — recoverable capital for the next deal without selling this one.
Negotiation context
- It's been on market 303 days — a 12% lower offer ($228k) is reasonable based on typical stale-listing flexibility.
Risks & watch-outs
- Climate carrying-cost: major wind risk, 68% chance of damaging wind over 30y; moderate wildfire risk; extreme-heat days projected 7→17/yr by 2055 (HVAC capex compounding) — expect insurance premiums to compound above CPI over the hold.
Questions for the listing agent
- What do current leases actually rent for vs. the listed asking? Can we see a recent rent roll and the last 12 months of T-12 income?
- It's been on market 303 days. Have you received any prior offers? Is the seller open to a 21% concession, seller financing, or rate buy-down credit?
- Why hasn't it sold? Are there any deal-killer items the seller is aware of (foundation, flood, title, zoning, code violations)?
- Is there a deadline driving the sale (1031 exchange, divorce, estate, relocation)? That informs how much negotiation room exists.
- Schools are F-rated, which usually means shorter tenancies and higher turnover. Who's the typical renter profile here, and what's been the actual vacancy rate?
- The area grade is low — what's the realistic commute time and amenity access for the typical tenant pool here? Any planned neighborhood developments (good or bad) we should know about?
- What's the average days-on-market for RENTAL listings here right now (not sales)? A rising rental-DOM trend means longer vacancies and softer asking-rent achievability than the comps imply.
- What's the recent tenant-quality profile in this submarket — average credit score on applications, eviction rate, late-payment / NSF rate, and stable-employment percentage? A property-management company in the area should have these aggregated.
- How much new for-sale + rental construction is in the pipeline within 1–3 miles? Heavy new supply typically softens prices + rents 12–24 months out; constrained supply supports both.
Investment metrics
- 1% rule
- 0.83% ✗
- Cap rate
- 5.83%
- Cash-on-cash
- -1.67%
- DSCR
- 0.93
- GRM
- 10.1
CMA / ARV
- ARV (on-the-fly)
- $247,787
- Comps found
- 12
Show comp detail 12 sales within ~0.75 mi
| Address | Dist | Beds/Ba | Sqft | Sold | Price | $/sf | Match |
|---|---|---|---|---|---|---|---|
| 1014 Quaint Parish Circle Cir | 0.58mi | 3/2.5 | 1,435 (-14%) | 5mo | $210,930 | $147 | 46 |
| 1036 Quaint Parish Cir | 0.58mi | 3/2.5 | 1,435 (-14%) | 6mo | $210,930 | $147 | 45 |
| 806 Quaint Parish Cir | 0.57mi | 3/2.5 | 1,435 (-14%) | 7mo | $215,000 | $150 | 44 |
| 1026 Quaint Parish Cir | 0.58mi | 3/2.5 | 1,435 (-14%) | 8mo | $215,930 | $150 | 44 |
| 1032 Quaint Parish Cir | 0.58mi | 3/2.5 | 1,435 (-14%) | 8mo | $215,930 | $150 | 44 |
| 1037 Quaint Parish Cir | 0.55mi | 3/2.5 | 1,435 (-14%) | 10mo | $209,430 | $146 | 43 |
| 887 Quaint Parish Cir | 0.54mi | 3/2.5 | 1,435 (-14%) | 11mo | $213,545 | $149 | 43 |
| 979 Quaint Parish Cir | 0.55mi | 3/2.5 | 1,435 (-14%) | 12mo | $212,670 | $148 | 42 |
| 895 Quaint Parish Cir | 0.53mi | 3/2.5 | 1,435 (-14%) | 13mo | $213,352 | $149 | 41 |
| 1004 Quaint Parish Cir | 0.58mi | 3/2.5 | 1,435 (-14%) | 12mo | $217,435 | $152 | 40 |
| 996 Quaint Parish Cir | 0.58mi | 3/2.5 | 1,435 (-14%) | 13mo | $214,045 | $149 | 39 |
| 1008 Quaint Parish Cir | 0.58mi | 3/2.5 | 1,435 (-14%) | 13mo | $213,045 | $148 | 39 |
Match score weights: distance 35% · size 25% · config 20% · recency 20%. Top-matched comps best support the ARV.
Projected returns pro-forma
8.38% appreciation · 3.0% rent growth · sell at horizon
- IRR
- 19.6%
- Equity multiple
- 2.47×
- Total profit
- $102,028
- Equity at exit
- $194,693
- IRR
- 18.2%
- Equity multiple
- 5.34×
- Total profit
- $301,022
- Equity at exit
- $392,777
Cash invested: $69,380 (down + closing). Projections, not guarantees.
Landlord ↔ Tenant lean methodology
- Overall (STATE)
- 90 Strongly Landlord-Friendly
- State South Carolina
- 90 Strongly Landlord-Friendly · R+6
- County
- — inherits STATE
- City
- — inherits STATE
ZIP-level market 29829
- Home prices YoY
- 3.0%
- Active inventory
- 298
- Price-to-rent
- 10.5×
Monthly cashflow live
- Estimated rent
- $2,046 high interval (Pro) →
- Mortgage (P&I)
- −$1,299
- Tax est. 1.5%
- −$310 /mo · $3,717/yr
- Insurance
- −$103
- HOA
- −$0
- Vacancy / Maint / Mgmt
- −$430
- Net cashflow
- $-96
Break-even live
Sensitivity live
| Price | -10% $75 | -5% $-11 | +0% $-96 | +5% $-182 | +10% $-268 |
|---|---|---|---|---|---|
| Rent | -10% $-258 | -5% $-177 | +0% $-96 | +5% $-15 | +10% $65 |
| Rate | -1.0pp $28 | -0.5pp $-33 | base $-96 | +0.5pp $-161 | +1.0pp $-226 |
UW: 25.0% down · 7.5% · 30yr · 1.5% tax · 5.0% vac · 8.0% maint · 8.0% mgmt
Financing live
Cash to close
- Down payment
- $61,947
- Closing costs
- $7,434
- Reserves months
- —
- Total cash needed
- —
Loan-product check · same deal, 3 products live
Conventional
25% down · 7.5% · 30yr
- Down + closing
- —
- Monthly P&I
- —
- Monthly cashflow
- —
- DSCR
- —
- Eligible?
- —
Personal DTI + credit; lowest rate.
DSCR
20% down · 8.5% · 30yr
- Down + closing
- —
- Monthly P&I
- —
- Monthly cashflow
- —
- DSCR
- —
- Eligible?
- —
No personal income docs; deal must DSCR.
Hard money
10% down · 12.0% · 12mo
- Down + closing
- —
- Monthly P&I
- —
- Monthly cashflow
- —
- DSCR
- —
- Eligible?
- —
Short-term bridge; refi at stabilization.
Rent comps 15 comps
| Address | Beds | Baths | Sqft | Rent | $/sqft | DOM | Units | Dist |
|---|---|---|---|---|---|---|---|---|
| 934 Quaint Parish Cir Graniteville, SC | 3.0 | 2.5 | 1435 | $1,800 | $1.25 | 25d | 1 | 0.54mi |
| 507 Satinwood Cir Graniteville, SC | 3.0–4.0 | 2.0–2.5 | 1776 | $1,989 | $1.12 | 15d | 5 | 0.64mi |
| 4060 Stone Pass Dr Graniteville, SC | 4.0 | 2.0 | 1600 | $1,925 | $1.20 | 25d | 1 | 1.02mi |
| 2477 Banyon Cir Graniteville, SC | 3.0 | 2.5 | 1300 | $1,574 | $1.21 | 25d | 1 | 1.10mi |
| 2137 Banyon Cir Graniteville, SC | 3.0 | 2.5 | 1305 | $1,549 | $1.19 | 15d | 1 | 1.12mi |
| 2129 Banyon Cir Graniteville, SC | 3.0 | 2.5 | 1305 | $1,549 | $1.19 | 23d | 1 | 1.12mi |
| 2541 Banyon Cir Graniteville, SC | 3.0 | 2.5 | 1300 | $1,574 | $1.21 | 15d | 1 | 1.14mi |
| 2097 Banyon Cir Graniteville, SC | 3.0 | 2.5 | 1305 | $1,549 | $1.19 | 23d | 1 | 1.14mi |
| 4074 Thimbleberry Dr Graniteville, SC | 3.0 | 2.5 | 1854 | $1,900 | $1.02 | 23d | 1 | 1.26mi |
| 39 Springdale Rd Graniteville, SC | 4.0 | 2.5 | 1744 | $2,100 | $1.20 | 25d | 1 | 1.26mi |
| 43 Springdale Rd Graniteville, SC | 4.0 | 2.5 | 1725 | $2,090 | $1.21 | 15d | 1 | 1.26mi |
| 45 Springdale Rd Graniteville, SC | 4.0 | 2.5 | 1744 | $2,100 | $1.20 | 23d | 1 | 1.26mi |
| 47 Springdale Rd Graniteville, SC | 4.0 | 2.5 | 1725 | $2,090 | $1.21 | 25d | 1 | 1.26mi |
| 6130 Mahogany Ter Graniteville, SC | 4.0 | 2.0 | 1893 | $2,250 | $1.19 | 15d | 1 | 1.28mi |
| 4044 Thimbleberry Dr Graniteville, SC | 3.0 | 2.5 | 1694 | $1,925 | $1.14 | 23d | 1 | 1.29mi |
Listing history 16 events
-
2026-06-21days on market $258,800 Active 303 DOM
-
2026-06-18days on market $258,800 Active 300 DOM
-
2026-06-17days on market $258,800 Active 299 DOM
-
2026-06-16days on market $258,800 Active 298 DOM
-
2026-06-15days on market $258,800 Active 297 DOM
-
2026-06-14days on market $258,800 Active 295 DOM
-
2026-06-13days on market $258,800 Active 294 DOM
-
2026-06-10days on market $258,800 Active 292 DOM
-
2026-06-09days on market $258,800 Active 291 DOM
-
2026-06-08days on market $258,800 Active 290 DOM
-
2026-06-07days on market $258,800 Active 289 DOM
-
2026-06-03days on market $258,800 Active 285 DOM
-
2026-06-02days on market $258,800 Active 284 DOM
-
2026-06-01days on market $258,800 Active 283 DOM
-
2026-05-31days on market $258,800 Active 282 DOM
-
2026-05-30days on market $258,800 Active 281 DOM
ⓘ Source: listings_history table (triggers on properties + properties_extension) + one-shot
backfill from property_details.listing_events for pre-trigger history.
Climate risk First Street
- Flood 1/10 Low FEMA zone X (unshaded) · 0% chance over 30 yrs
- Wildfire 5/10 Major
- Heat 7/10 Severe 7 d/yr ≥108°F today · 17 d/yr by 30 yrs out
- Wind 6/10 Major 68% chance of damaging wind over 30 yrs
- Air quality 4/10 Moderate 4 unhealthy d/yr today · 4 by 30 yrs out
Nearby sold comps map
Loading sold comps map…
Walkable amenities ~0.75 mi
Loading nearby amenities…
Taxation est. · year 1
- Rental income
- $24,548
- − Mortgage interest
- −$13,880
- − Property taxes
- −$3,717
- − Insurance
- −$1,239
- − Repairs & maintenance
- −$1,964
- − Management
- −$1,964
- − Depreciation
- −$7,208
- Taxable loss
- −$5,423
- Est. tax savings @ 24.0%
- +$1,302
- After-tax cash flow
- $146/yr
For passive investors: Depreciation is non-cash, so a rental often shows a tax loss while cash-flowing — sheltering income. Rental losses are passive: they offset passive income freely, and up to $25,000/yr can offset ordinary (W-2) income if you actively participate and your MAGI is under $100k (phasing out to $0 by $150k); unused losses carry forward. On sale, claimed depreciation is recaptured at up to 25%, and gains may owe capital-gains tax (a 1031 exchange can defer both). Figures are a year-1 estimate at your 24.0% rate — not tax advice; consult a CPA.
Schools (NCES district)
- District
- Aiken 01
- NCES district ID
- 4500720
- Math proficiency
- 31% ▼ -11.00%
- Reading proficiency
- 44% ▼ -1.00%
- Median HH income
- $45,081
- Composite
- 31.91/100
- National rank
- #5857
- State rank
- #36 of 80 in SC
Livability — Graniteville
- Score
- 59/100
- State rank
- #240
- US rank
- #19924
Category grades
Schools grade is shown separately in the Schools card above.
Census & demographics
- County
- Aiken County · 116,534 people
- City population
- 931
- Metro
- Augusta-Richmond County, GA-SC
- Population (ZIP)
- 12,385
- Household income
- $84,228
- Rent vs Own
- Severe rent burden
- 213.0
Population outlook (Aiken County) Hauer SSP2
- Today (2025)
- 178,003 people
- By 2030
- 182,876 · +2.7%
- By 2040
- 189,970 · +6.7%
- By 2050
- 193,840 · +8.9%
- By 2075
- 199,453 · +12.1%
- By 2100
- 192,403 · +8.1%
Race, ethnicity, and origin ACS 2023
- Neighborhood character
- Diverse neighborhood (Simpson 0.58)
- Race & ethnicity
- White 59% Black 26% Hispanic / Latino 12% Two or more races 9% Asian 1%
- Hispanic origin (detail)
- Mexican 8% Puerto Rican 1%
- Common ancestry
- Italian 2% Swedish 2% Slovak 1%
- Foreign-born
- 6% · Canada
- Languages at home
- 89% English-only · Spanish 10% Other Indo-European 1%
Political lean MEDSL · Aiken
- 2024 margin
- Strong R (+25.9) · D 36.4% · R 62.2% · Other 1.4%
- 2008→2024 swing
- -1.9pp toward R · 2008: -24.0pp · 2024: -25.9pp
- All cycles
- 2024: R+25.9 2020: R+22.7 2016: R+27.5 2012: R+26.0 2008: R+24.0
Not yet ingested
- Civics
- —
Market trends
- HPI YoY
- ▲ 8.38%
- Current HPI
- 286.4155
- Rent YoY
- —
- Metro
- Augusta-Richmond County, GA-SC
- State GDP YoY
- ▲ 4.51%
- F500 in state
- 2
Industry mix (Fortune 500 HQ in SC)
| Industry | F500 HQs | Revenue |
|---|---|---|
| Packaging | 1 | $7B |
|
||
Cash-flow waterfall
monthlySold comps — $/sqft
last 12 mo · ≤1 miLoading sold comps…