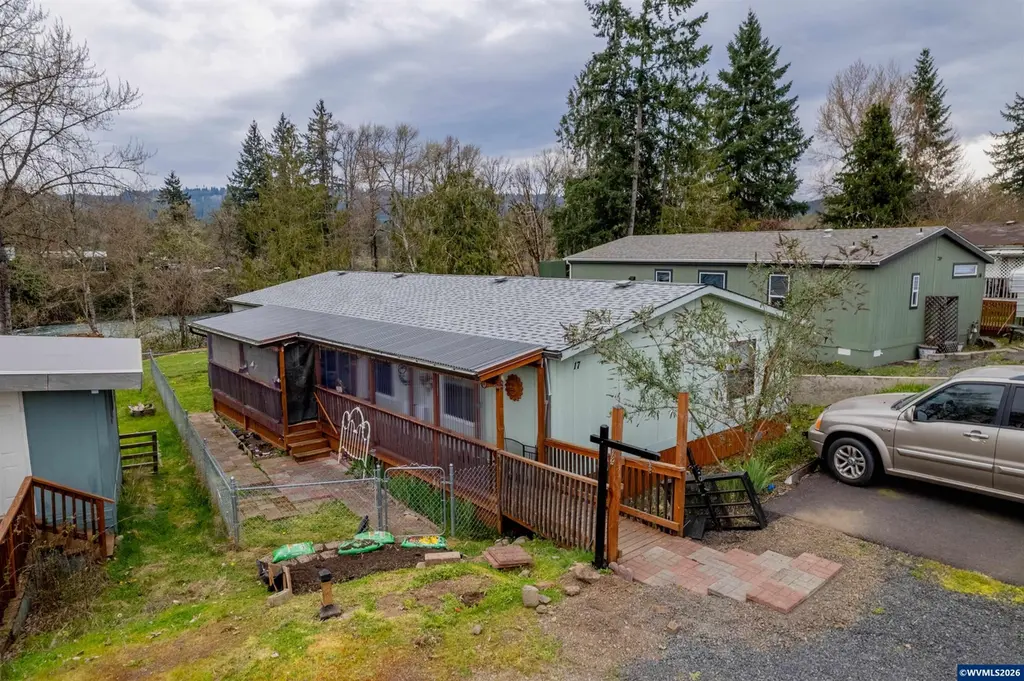
1530 Tamarack St #17 · Sweet Home, OR
Flood risk 1/10 · Minimal
- FEMA flood zone
- X (unshaded)
- Chance of flooding over 30 yrs
- 0.0%
- Est. flood insurance / yr
- $507 – $1,088
Fire risk 5/10 · Moderate
- Est. fire insurance / yr
- $498 – $926
Heat risk 4/10 · Minor
- Hot days now (above 91°F)
- 8 days/yr
- Hot days in 30 yrs
- 18 days/yr
Wind risk 1/10 · Minimal
- Chance of severe wind over 30 yrs
- —
Air-quality risk 10/10 · Severe
- Unhealthy air days now
- 11 days/yr
- Unhealthy air days in 30 yrs
- 15 days/yr
Risk factors via First Street. Map © Google.
Why this score? — see what drove the B- grade
The composite is a weighted blend of 9 inputs, each scored 0–100. Each bar is that input's sub-score; the figure is the points it added to the 100-point composite (weight × sub-score).
- Cash flow +30.0/30.0
- 1% rule +10.0/10.0
- DSCR +10.0/10.0
- ARV discount +7.5/15.0
- Livability +3.2/5.0
- Schools +2.9/10.0
- Rent growth +2.5/5.0
- Condition / age +2.5/5.0
- Appreciation +0.0/10.0
$99,900
🖨 Deal sheet 📄 Offer letter ✓ Due diligence
Listing remarks MLS
Beautifully maintained home in a desirable park! The spacious kitchen flows seamlessly into the dining and living areas, creating an inviting open layout. Relax under the covered deck and enjoy the peaceful sounds of the river just beyond your fully fenced yard. A newer roof and heat pump with A/C for year-round comfort. Don’t miss this opportunity!
Key facts
- Covered deck
- Newer roof
- Spacious kitchen
Tags
Neighborhood map
What this means for you Summary
Snapshot
- This is a 3-bed/2.0-bath other listed at $100k.
Deal economics
- At list price, monthly cash flow is $745 ($9k/yr) — positive.
- The deal already cash-flows at list — no discount required.
- Meets the 1% rule at list price ($2k rent vs $100k).
- Recommended offer: $94k (6.0% below list) — sets the bar for market timing.
- Cap rate 15.2% vs local median 2.9% in Sweet Home — top-decile yield for the area; either an underpriced asset or a hidden risk that comps aren't pricing in. Stress-test before assuming the spread holds.
Location & tenants
- Location reads 63/100 on livability (#233 in OR) — a middle-class / working-renter tenant base. Strengths: cost of living A+, housing A+; Watch: health & safety C-, schools D-, amenities F.
- Sweet Home SD 55 (town): math 26% / reading 42% proficiency, ranked #29 of 58 in OR (top 50%) — families likely to look elsewhere, expect single-tenant / working-renter base with shorter leases.
- Market conditions: 166 active listings in the ZIP; 2 comparable units currently listed for rent nearby; 311 units permitted in Linn County in 2024 (60 in 5+ unit buildings).
Forward outlook
- Local home prices are declining (-3.0%/yr); year-one equity from $691 of loan paydown is wiped out by about $3k of value loss. Plan a longer hold.
- Linn County population projected at +5% by 2050 — modest demand growth; plan on rents tracking national, not racing it.
- At projected returns (-3.0% appreciation + 3.0% rent growth), your $28k cash investment doubles in ~4 years — after that, you're playing with house money.
Negotiation context
- It's been on market 66 days — a 6% lower offer ($94k) is reasonable based on typical stale-listing flexibility.
- 7 sale attempts since 4y ago with the ask held roughly flat each time — persistent listings suggest the price (not the market) is what's stuck; bring a comps-based counter.
Risks & watch-outs
- Climate carrying-cost: moderate wildfire risk — expect insurance premiums to compound above CPI over the hold.
Questions for the listing agent
- It's been on market 66 days. Have you received any prior offers? Is the seller open to a 6% concession, seller financing, or rate buy-down credit?
- Why hasn't it sold? Are there any deal-killer items the seller is aware of (foundation, flood, title, zoning, code violations)?
- Is there a deadline driving the sale (1031 exchange, divorce, estate, relocation)? That informs how much negotiation room exists.
- Schools are D-rated, which usually means shorter tenancies and higher turnover. Who's the typical renter profile here, and what's been the actual vacancy rate?
- What's the average days-on-market for RENTAL listings here right now (not sales)? A rising rental-DOM trend means longer vacancies and softer asking-rent achievability than the comps imply.
- What's the recent tenant-quality profile in this submarket — average credit score on applications, eviction rate, late-payment / NSF rate, and stable-employment percentage? A property-management company in the area should have these aggregated.
- How much new for-sale + rental construction is in the pipeline within 1–3 miles? Heavy new supply typically softens prices + rents 12–24 months out; constrained supply supports both.
Investment metrics
- 1% rule
- 1.73% ✓
- Cap rate
- 15.24%
- Cash-on-cash
- 31.95%
- DSCR
- 2.42
- GRM
- 4.8
CMA / ARV
- ARV (median comp)
- $226,337
- List price
- $99,900
- Delta
- -55.86%
- Verdict
- UNDERPRICED
- Comps
- 6 within 1.0 mi
Projected returns pro-forma
-3.0% appreciation · 3.0% rent growth · sell at horizon
- IRR
- 26.9%
- Equity multiple
- 2.12×
- Total profit
- $31,234
- Equity at exit
- $14,895
- IRR
- 34.5%
- Equity multiple
- 4.15×
- Total profit
- $88,214
- Equity at exit
- $8,638
Cash invested: $27,972 (down + closing). Projections, not guarantees.
Landlord ↔ Tenant lean methodology
- Overall (STATE)
- 28 Tenant-Leaning
- State Oregon
- 28 Tenant-Leaning · D+6
- County
- — inherits STATE
- City
- — inherits STATE
ZIP-level market 97386
- Active inventory
- 166
- Price-to-rent
- 4.8×
Monthly cashflow live
- Estimated rent
- $1,728 medium interval (Pro) →
- Mortgage (P&I)
- −$524
- Tax from tax record
- −$54 /mo · $653/yr
- Insurance
- −$42
- HOA
- −$0
- Vacancy / Maint / Mgmt
- −$363
- Net cashflow
- $745
Break-even live
UW: 25.0% down · 7.5% · 30yr · 1.5% tax · 5.0% vac · 8.0% maint · 8.0% mgmt
Financing live
Cash to close
- Down payment
- $24,975
- Closing costs
- $2,997
- Reserves months
- —
- Total cash needed
- —
Loan-product check · same deal, 3 products live
Conventional
25% down · 7.5% · 30yr
- Down + closing
- —
- Monthly P&I
- —
- Monthly cashflow
- —
- DSCR
- —
- Eligible?
- —
Personal DTI + credit; lowest rate.
DSCR
20% down · 8.5% · 30yr
- Down + closing
- —
- Monthly P&I
- —
- Monthly cashflow
- —
- DSCR
- —
- Eligible?
- —
No personal income docs; deal must DSCR.
Hard money
10% down · 12.0% · 12mo
- Down + closing
- —
- Monthly P&I
- —
- Monthly cashflow
- —
- DSCR
- —
- Eligible?
- —
Short-term bridge; refi at stabilization.
Rent comps 2 comps
| Address | Beds | Baths | Sqft | Rent | $/sqft | DOM | Units | Dist |
|---|---|---|---|---|---|---|---|---|
| 2034 Long St Sweet Home, OR | 3.0 | 1.0 | 1050 | $1,750 | $1.67 | 44d | 1 | 0.50mi |
| 1317 Fir St Sweet Home, OR | 2.0 | 2.0 | 1426 | $1,700 | $1.19 | 21d | 1 | 0.83mi |
Listing history 33 events
-
2026-06-19days on market $99,900 Active 66 DOM
-
2026-06-18days on market $99,900 Active 65 DOM
-
2026-06-17days on market $99,900 Active 64 DOM
-
2026-06-16days on market $99,900 Active 63 DOM
-
2026-06-15days on market $99,900 Active 62 DOM
-
2026-06-14days on market $99,900 Active 60 DOM
-
2026-06-13days on market $99,900 Active 59 DOM
-
2026-06-10days on market $99,900 Active 57 DOM
-
2026-06-09days on market $99,900 Active 56 DOM
-
2026-06-08days on market $99,900 Active 55 DOM
-
2026-06-07days on market $99,900 Active 54 DOM
-
2026-06-05days on market $99,900 Active 51 DOM
-
2026-06-02days on market $99,900 Active 49 DOM
-
2026-06-01days on market $99,900 Active 48 DOM
-
2026-05-31days on market $99,900 Active 47 DOM
-
2026-05-30days on market $99,900 Active 46 DOM
-
2026-04-14$99,900 Active 357-char remark
Show marketing remark (357 chars)
Beautifully maintained home in a desirable park! The spacious kitchen flows seamlessly into the dining and living areas, creating an inviting open layout. Relax under the covered deck and enjoy the peaceful sounds of the river just beyond your fully fenced yard. A newer roof and heat pump with A/C for year-round comfort. Don’t miss this opportunity!
-
2024-08-01historical
-
2024-05-31status Active
-
2024-04-29historical Active under Contract
-
2024-04-22price $90,000
-
2024-04-05price $130,000
-
2024-03-22$150,000 Active
-
2023-07-01historical
-
2023-06-30$155,000
-
2022-07-26soldstatus $125,000 Sold
-
2022-07-26soldstatus $125,000 Sold
-
2022-07-18status Pending
-
2022-07-12historical Active under Contract
-
2022-06-15historical
-
2022-06-14$149,900 Active
-
2022-06-14$149,900 Active
-
2022-06-14$149,900 Active
ⓘ Source: listings_history table (triggers on properties + properties_extension) + one-shot
backfill from property_details.listing_events for pre-trigger history.
Tax reassessment forecast OR · Resets to sale price
- Current annual tax
- $653 · $54/mo
- Projected year-2 tax
- $969 · $81/mo
- Expected delta
- +$316/yr (+$26/mo · 48.4%)
ⓘ Screening estimate from a state-policy table — verify with the county assessor before closing.
Climate risk First Street
- Flood 1/10 Low FEMA zone X (unshaded) · 0% chance over 30 yrs
- Wildfire 5/10 Major
- Heat 4/10 Moderate 8 d/yr ≥91°F today · 18 d/yr by 30 yrs out
- Wind 1/10 Low
- Air quality 10/10 Extreme 11 unhealthy d/yr today · 15 by 30 yrs out
Nearby sold comps map
Loading sold comps map…
Walkable amenities ~0.75 mi
Loading nearby amenities…
Taxation est. · year 1
- Rental income
- $20,731
- − Mortgage interest
- −$5,596
- − Property taxes
- −$653
- − Insurance
- −$500
- − Repairs & maintenance
- −$1,658
- − Management
- −$1,658
- − Depreciation
- −$2,906
- Taxable income
- $7,759
- Est. tax owed @ 24.0%
- −$1,862
- After-tax cash flow
- $7,076/yr
For passive investors: Depreciation is non-cash, so a rental often shows a tax loss while cash-flowing — sheltering income. Rental losses are passive: they offset passive income freely, and up to $25,000/yr can offset ordinary (W-2) income if you actively participate and your MAGI is under $100k (phasing out to $0 by $150k); unused losses carry forward. On sale, claimed depreciation is recaptured at up to 25%, and gains may owe capital-gains tax (a 1031 exchange can defer both). Figures are a year-1 estimate at your 24.0% rate — not tax advice; consult a CPA.
Schools (NCES district)
- District
- Sweet Home SD 55
- NCES district ID
- 4111970
- Math proficiency
- 26% ▼ -7.00%
- Reading proficiency
- 42% ▼ -3.00%
- Median HH income
- $41,727
- Composite
- 28.67/100
- National rank
- #6698
- State rank
- #29 of 58 in OR
Livability — Sweet Home
- Score
- 63/100
- State rank
- #233
- US rank
- #15826
Category grades
Schools grade is shown separately in the Schools card above.
Census & demographics
- Census place
- Sweet Home, OR
- Population (ZIP)
- 15,509
Population outlook (Linn County) Hauer SSP2
- Today (2025)
- 127,026 people
- By 2030
- 129,540 · +2.0%
- By 2040
- 132,780 · +4.5%
- By 2050
- 133,614 · +5.2%
- By 2075
- 129,061 · +1.6%
- By 2100
- 112,224 · -11.7%
Race, ethnicity, and origin ACS 2023
- Neighborhood character
- Predominantly White (86%)
- Race & ethnicity
- White 86% Two or more races 8% Hispanic / Latino 5% Asian 1%
- Hispanic origin (detail)
- Mexican 4%
- Common ancestry
- Portuguese 6% Italian 5% Slovak 3%
- Foreign-born
- 2% · Canada
- Languages at home
- 95% English-only · Spanish 3% German/W. Germanic 1% Tagalog/Filipino 1%
Political lean MEDSL · Linn
- 2024 margin
- Strong R (+24.4) · D 36.2% · R 60.6% · Other 3.1%
- 2008→2024 swing
- -13.0pp toward R · 2008: -11.4pp · 2024: -24.4pp
- All cycles
- 2024: R+24.4 2020: R+23.4 2016: R+27.8 2012: R+17.2 2008: R+11.4
Not yet ingested
- Civics
- —
Market trends
- HPI YoY
- ▼ -173.31%
- Current HPI
- 241.0077
- Rent YoY
- —
- Metro
- —
- State GDP YoY
- ▲ 2.05%
- F500 in state
- 2
Industry mix (Fortune 500 HQ in OR)
| Industry | F500 HQs | Revenue |
|---|---|---|
| Consumer Goods | 1 | $51B |
|
||
Price history
-33.4% since first listed17 events — show timeline
- 2026-04-14 Listed $99,900 WVMLS
- 2024-08-01 Listing Removed — WVMLS
- 2024-05-31 Relisted — WVMLS
- 2024-04-29 Contingent — WVMLS
- 2024-04-22 Price Changed $90,000 WVMLS
- 2024-04-05 Price Changed $130,000 WVMLS
- 2024-03-22 Listed $150,000 WVMLS
- 2023-07-01 Listing Removed — WVMLS
- 2023-06-30 Listed $155,000 WVMLS
- 2022-07-26 Sold (MLS) $125,000 WVMLS
- 2022-07-26 Sold (MLS) $125,000 RMLS
- 2022-07-18 Pending — RMLS
- 2022-07-12 Contingent — WVMLS
- 2022-06-15 Listing Removed — WVMLS
- 2022-06-14 Listed $149,900 WVMLS
- 2022-06-14 Listed $149,900 WVMLS
- 2022-06-14 Listed $149,900 RMLS
Property tax history
-6.8%/yrLatest (2025): $653 · +2.8% YoY. Source: county tax records.
Cash-flow waterfall
monthlySold comps — $/sqft
last 12 mo · ≤1 miLoading sold comps…