 Triplex
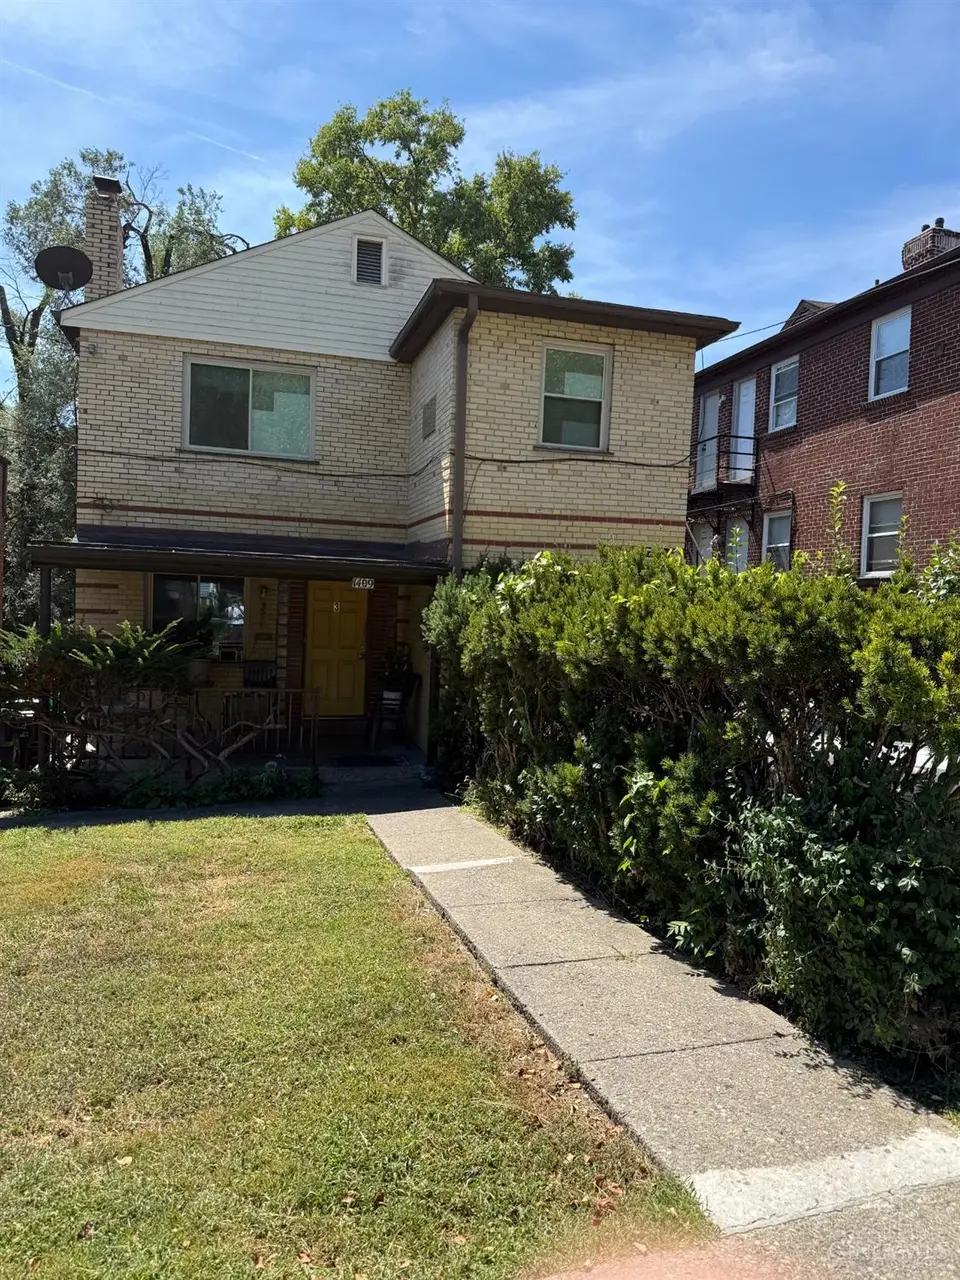
1409 Yarmouth Ave · Cincinnati, OH
Flood risk 1/10 · Minimal
- FEMA flood zone
- X (unshaded)
- Chance of flooding over 30 yrs
- 0.0%
- Est. flood insurance / yr
- $473 – $860
Fire risk 1/10 · Minimal
- Est. fire insurance / yr
- $713 – $1,323
Heat risk 5/10 · Moderate
- Hot days now (above 103°F)
- 7 days/yr
- Hot days in 30 yrs
- 19 days/yr
Wind risk 2/10 · Minimal
- Chance of severe wind over 30 yrs
- 1.0%
Air-quality risk 3/10 · Minor
- Unhealthy air days now
- 2 days/yr
- Unhealthy air days in 30 yrs
- 3 days/yr
Risk factors via First Street. Map © Google.
Why this score? — see what drove the B- grade
The composite is a weighted blend of 9 inputs, each scored 0–100. Each bar is that input's sub-score; the figure is the points it added to the 100-point composite (weight × sub-score).
- Cash flow +25.0/30.0
- ARV discount +15.0/15.0
- DSCR +8.2/10.0
- 1% rule +6.3/10.0
- Rent growth +4.2/5.0
- Livability +4.0/5.0
- Schools +2.5/10.0
- Condition / age +2.5/5.0
- Appreciation +0.0/10.0
$300,000
🖨 Deal sheet 📄 Offer letter ✓ Due diligence
Multi-family units
County records classify this as Multi-Family (2-4 Unit). Listing-text estimate: 3 units. confirmed
Listing remarks MLS
Turnkey investment with immediate cash flow! This well-maintained 3-unit multifamily property is 100% occupied with stable tenants, making it an excellent addition to any portfolio.
Key facts
- 4,922 sq ft lot
- 3 garage spots
- Built 1900
Property features AI
Exterior
- Parking: Detached or on-site garage with 3 garage spaces; 3 off-street open parking spaces; Off-street parking
- Utilities: Public water; Public sewer; Natural gas
- Home design: Triplex; Two levels; Poured foundation
- Construction: Brick construction; Shingle roof
- Exterior features: Casement windows
Interior
- Bedrooms: One 1-bedroom unit; One 2-bedroom unit; One 4-bedroom unit
- Bathrooms: Three full bathrooms (one in each unit)
- Heating & cooling: Forced-air gas heating; Central air conditioning
- Interior features: Full basement
Neighborhood map
What this means for you Summary
Snapshot
- This is a 3 × 2-bed/1.0-bath units multifamily listed at $300k.
Deal economics
- At list price, monthly cash flow is $654 ($8k/yr) — positive. Per door: $218/mo.
- The deal already cash-flows at list — no discount required.
- Meets the 1% rule at list price ($3k rent vs $300k).
- Recommended offer: $291k (3.0% below list) — sets the bar for market timing.
- Cap rate 8.9% vs local median 3.9% in Cincinnati — top-decile yield for the area; either an underpriced asset or a hidden risk that comps aren't pricing in. Stress-test before assuming the spread holds.
Location & tenants
- Location reads 80/100 on livability (#130 in OH, #1,856 nationally) — a professional / high-income tenant draw. Strengths: amenities A+, commute A+, cost of living A+; Watch: employment D, crime F.
- Cincinnati Public Schools (urban): math 25% / reading 36% proficiency, ranked #581 of 656 in OH (top 89%) — families likely to look elsewhere, expect single-tenant / working-renter base with shorter leases; 70% free/reduced lunch — lower-income household profile, screen leases tightly.
- Market conditions: Rents rising fast (+6.6%/yr); 44 active listings in the ZIP; lower-income renter base — watch delinquency; 801 units permitted in Hamilton County in 2024 (190 in 5+ unit buildings).
- At $3,387/mo this rent would consume 90% of the median local household income ($45k/yr) (locally 1467% of renters already pay >50% of income on rent) — very limited rent-growth headroom before tenants either downsize or default.
Forward outlook
- Local home prices are declining (-3.0%/yr); year-one equity from $2k of loan paydown is wiped out by about $9k of value loss. Plan a longer hold.
- At projected returns (-3.0% appreciation + 6.6% rent growth), your $84k cash investment doubles in ~9 years — after that, you're playing with house money.
Negotiation context
- It's been on market 52 days — a 3% lower offer ($291k) is reasonable based on typical stale-listing flexibility.
- 8 sale attempts since 30y ago with the ask held roughly flat each time — persistent listings suggest the price (not the market) is what's stuck; bring a comps-based counter.
- Current owner paid $175k; list at $300k implies a 71% gain — meaningful room to come down on a strong offer.
Risks & watch-outs
- Watch-outs: built in 1900 — expect roof / HVAC / electrical / plumbing capex.
- Climate carrying-cost: extreme-heat days projected 7→19/yr by 2055 (HVAC capex compounding) — expect insurance premiums to compound above CPI over the hold.
Questions for the listing agent
- It's been on market 52 days. Have you received any prior offers? Is the seller open to a 3% concession, seller financing, or rate buy-down credit?
- Can we see the unit-by-unit rent roll, current vacancy, and any below-market leases? What's the average tenancy length?
- What capital expenditures (roof, boiler, parking lot, exteriors) have been made in the last 5 years, and what's planned in the next 2?
- Built in 1900 — when were the roof, HVAC, electrical panel, plumbing, and water heater last replaced?
- Is there a deadline driving the sale (1031 exchange, divorce, estate, relocation)? That informs how much negotiation room exists.
- Schools are B-rated — typically a magnet for longer-tenancy family renters. What's the average tenant stay here, and is there a school-zone premium baked into asking?
- Crime grade is F in this area — have there been break-ins, vandalism, or insurance claims at this property in the last 3 years? What carrier currently insures it and at what premium?
- What's the average days-on-market for RENTAL listings here right now (not sales)? A rising rental-DOM trend means longer vacancies and softer asking-rent achievability than the comps imply.
- What's the recent tenant-quality profile in this submarket — average credit score on applications, eviction rate, late-payment / NSF rate, and stable-employment percentage? A property-management company in the area should have these aggregated.
- How much new apartment / multifamily construction is in the pipeline within 1–3 miles? Heavy new supply (>2% of stock underway) typically softens rents 12–24 months out; light construction supports rent growth.
Investment metrics
- 1% rule
- 1.13% ✓
- Cap rate
- 8.91%
- Cash-on-cash
- 9.34%
- DSCR
- 1.42
- GRM
- 7.4
CMA / ARV
- ARV (on-the-fly)
- $441,456
- Comps found
- 2
Show comp detail 2 sales within ~0.75 mi
| Address | Dist | Beds/Ba | Sqft | Sold | Price | $/sf | Match |
|---|---|---|---|---|---|---|---|
| 1219 Franklin Ave | 0.19mi | 4/— | 2,764 (-15%) | 6mo | $375,000 | $136 | 62 |
| 4902 Paddock Rd | 0.25mi | 4/2.0 | 2,885 (-11%) | 19mo | $179,000 | $62 | 50 |
Match score weights: distance 35% · size 25% · config 20% · recency 20%. Top-matched comps best support the ARV.
Projected returns pro-forma
-3.0% appreciation · 6.62% rent growth · sell at horizon
- IRR
- 1.7%
- Equity multiple
- 1.07×
- Total profit
- $5,817
- Equity at exit
- $44,731
- IRR
- 14.6%
- Equity multiple
- 2.37×
- Total profit
- $115,268
- Equity at exit
- $25,939
Cash invested: $84,000 (down + closing). Projections, not guarantees.
Landlord ↔ Tenant lean methodology
- Overall (STATE)
- 73 Landlord-Friendly
- State Ohio
- 73 Landlord-Friendly · R+6
- County
- — inherits STATE
- City
- — inherits STATE
ZIP-level market 45237
- Home prices YoY
- -33.0%
- Rents YoY
- 6.6%
- Active inventory
- 44
- Price-to-rent
- 22.1×
Monthly cashflow live
- Estimated rent
- $3,387 high interval (Pro) →
- Mortgage (P&I)
- −$1,573
- Tax from tax record
- −$324 /mo · $3,887/yr
- Insurance
- −$125
- HOA
- −$0
- Vacancy / Maint / Mgmt
- −$711
- Net cashflow
- $654
Break-even live
3-unit breakdown (identical units grouped — click to expand)
| Units | Beds | Baths | Est. rent |
|---|---|---|---|
| 3× units | 2 | 1 | $3,387 |
| #1 | 2 | 1 | $1,129 |
| #2 | 2 | 1 | $1,129 |
| #3 | 2 | 1 | $1,129 |
| Total (3 units) | $3,387 | ||
UW: 25.0% down · 7.5% · 30yr · 1.5% tax · 5.0% vac · 8.0% maint · 8.0% mgmt
Financing live
Cash to close
- Down payment
- $75,000
- Closing costs
- $9,000
- Reserves months
- —
- Total cash needed
- —
Loan-product check · same deal, 3 products live
Conventional
25% down · 7.5% · 30yr
- Down + closing
- —
- Monthly P&I
- —
- Monthly cashflow
- —
- DSCR
- —
- Eligible?
- —
Personal DTI + credit; lowest rate.
DSCR
20% down · 8.5% · 30yr
- Down + closing
- —
- Monthly P&I
- —
- Monthly cashflow
- —
- DSCR
- —
- Eligible?
- —
No personal income docs; deal must DSCR.
Hard money
10% down · 12.0% · 12mo
- Down + closing
- —
- Monthly P&I
- —
- Monthly cashflow
- —
- DSCR
- —
- Eligible?
- —
Short-term bridge; refi at stabilization.
Listing history 32 events
-
2026-06-18days on market $300,000 Active 52 DOM
-
2026-06-17days on market $300,000 Active 51 DOM
-
2026-06-16days on market $300,000 Active 50 DOM
-
2026-06-15days on market $300,000 Active 49 DOM
-
2026-06-13days on market $300,000 Active 47 DOM
-
2026-06-13days on market $300,000 Active 46 DOM
-
2026-06-09days on market $300,000 Active 43 DOM
-
2026-06-08days on market $300,000 Active 42 DOM
-
2026-06-07days on market $300,000 Active 41 DOM
-
2026-06-03days on market $300,000 Active 37 DOM
-
2026-06-02days on market $300,000 Active 36 DOM
-
2026-06-01days on market $300,000 Active 35 DOM
-
2026-05-31days on market $300,000 Active 34 DOM
-
2026-04-27$300,000 Active
-
2026-04-21$700
-
2026-03-16historical 182-char remark
Show marketing remark (182 chars)
Turnkey investment with immediate cash flow! This well-maintained 3-unit multifamily property is 100% occupied with stable tenants, making it an excellent addition to any portfolio.
-
2025-09-17$300,000 Active 182-char remark
Show marketing remark (182 chars)
Turnkey investment with immediate cash flow! This well-maintained 3-unit multifamily property is 100% occupied with stable tenants, making it an excellent addition to any portfolio.
-
2024-09-15historical $700
-
2024-09-13$700
-
2024-08-02historical $700
-
2024-08-02$700
-
2021-06-03soldstatus $175,000 Sold 480-char remark
Show marketing remark (480 chars)
Numbers Work Nicely! 3 unit Brick building- 3 apartments- 3 bedroom, 2 bedroom, 1 bedroom- separate furnace & central air (two newer furnaces & a/c compressors). Longer term tenants. New windows, well maintained & managed. $2175 income per month with opportunity to increase. 3 bedroom has private entry, One & Two bedroom has separate dedicated side stairway access. High performing Rental History, easy to lease, low maintenance building, Solid rental location.
-
2021-03-28historical Contingency Pending 480-char remark
Show marketing remark (480 chars)
Numbers Work Nicely! 3 unit Brick building- 3 apartments- 3 bedroom, 2 bedroom, 1 bedroom- separate furnace & central air (two newer furnaces & a/c compressors). Longer term tenants. New windows, well maintained & managed. $2175 income per month with opportunity to increase. 3 bedroom has private entry, One & Two bedroom has separate dedicated side stairway access. High performing Rental History, easy to lease, low maintenance building, Solid rental location.
-
2021-03-24$169,000 Active 480-char remark
Show marketing remark (480 chars)
Numbers Work Nicely! 3 unit Brick building- 3 apartments- 3 bedroom, 2 bedroom, 1 bedroom- separate furnace & central air (two newer furnaces & a/c compressors). Longer term tenants. New windows, well maintained & managed. $2175 income per month with opportunity to increase. 3 bedroom has private entry, One & Two bedroom has separate dedicated side stairway access. High performing Rental History, easy to lease, low maintenance building, Solid rental location.
-
2019-05-17soldstatus $105,000
-
2019-04-25soldstatus $105,000 Sold
-
2019-04-02historical Accept Backup Offers
-
2019-01-09price $115,000
-
2018-11-30$125,000 Active
-
1996-07-08soldstatus $70,000
-
1996-07-03soldstatus $70,000
-
1996-03-12$74,900
ⓘ Source: listings_history table (triggers on properties + properties_extension) + one-shot
backfill from property_details.listing_events for pre-trigger history.
Tax reassessment forecast OH · Partial reset (capped growth)
- Current annual tax
- $3,887 · $324/mo
- Projected year-2 tax
- $4,284 · $357/mo
- Expected delta
- +$396/yr (+$33/mo · 10.2%)
ⓘ Screening estimate from a state-policy table — verify with the county assessor before closing.
Climate risk First Street
- Flood 1/10 Low FEMA zone X (unshaded) · 0% chance over 30 yrs
- Wildfire 1/10 Low
- Heat 5/10 Major 7 d/yr ≥103°F today · 19 d/yr by 30 yrs out
- Wind 2/10 Low 100% chance of damaging wind over 30 yrs
- Air quality 3/10 Moderate 2 unhealthy d/yr today · 3 by 30 yrs out
Nearby sold comps map
Loading sold comps map…
Walkable amenities ~0.75 mi
Loading nearby amenities…
Taxation est. · year 1
- Rental income
- $40,644
- − Mortgage interest
- −$16,805
- − Property taxes
- −$3,887
- − Insurance
- −$1,500
- − Repairs & maintenance
- −$3,252
- − Management
- −$3,252
- − Depreciation
- −$8,727
- Taxable income
- $3,222
- Est. tax owed @ 24.0%
- −$773
- After-tax cash flow
- $7,070/yr
For passive investors: Depreciation is non-cash, so a rental often shows a tax loss while cash-flowing — sheltering income. Rental losses are passive: they offset passive income freely, and up to $25,000/yr can offset ordinary (W-2) income if you actively participate and your MAGI is under $100k (phasing out to $0 by $150k); unused losses carry forward. On sale, claimed depreciation is recaptured at up to 25%, and gains may owe capital-gains tax (a 1031 exchange can defer both). Figures are a year-1 estimate at your 24.0% rate — not tax advice; consult a CPA.
Schools (NCES district)
- District
- Cincinnati Public Schools
- NCES district ID
- 3904375
- Math proficiency
- 25% ▼ -19.00%
- Reading proficiency
- 36% ▼ -14.00%
- Median HH income
- $35,743
- Composite
- 25.21/100
- National rank
- #7508
- State rank
- #581 of 656 in OH
Livability — Cincinnati
- Score
- 80/100
- State rank
- #130
- US rank
- #1856
Category grades
Schools grade is shown separately in the Schools card above.
Census & demographics
- Census place
- Cincinnati, OH
- County
- Hamilton County · 701,295 people
- City population
- 505,555
- Metro
- Cincinnati, OH-KY-IN
- Population (ZIP)
- 20,903
- Household income
- $44,913
- Rent vs Own
- Severe rent burden
- 1467.0
Population outlook (Hamilton County) Hauer SSP2
- Today (2025)
- 826,054 people
- By 2030
- 830,947 · +0.6%
- By 2040
- 832,319 · +0.8%
- By 2050
- 822,428 · -0.4%
- By 2075
- 788,688 · -4.5%
- By 2100
- 710,674 · -14.0%
Race, ethnicity, and origin ACS 2023
- Neighborhood character
- Predominantly Black (71%)
- Race & ethnicity
- Black 71% White 22% Two or more races 4% Hispanic / Latino 2%
- Common ancestry
- Romanian 2% Italian 1% Scotch-Irish 1%
- Foreign-born
- 3% · Canada
- Languages at home
- 96% English-only · Spanish 2%
Political lean MEDSL · Hamilton
- 2024 margin
- D (+14.9) · D 57.0% · R 42.1%
- 2008→2024 swing
- +7.9pp toward D · 2008: 7.0pp · 2024: 14.9pp
- All cycles
- 2024: D+14.9 2020: D+15.9 2016: D+9.5 2012: D+4.9 2008: D+7.0
Not yet ingested
- Civics
- —
Market trends
- HPI YoY
- ▼ -110.54%
- Current HPI
- 224.4728
- Rent YoY
- ▲ 6.62%
- Metro
- Cincinnati, OH-KY-IN
- State GDP YoY
- ▲ 1.98%
- F500 in state
- 48
Industry mix (Fortune 500 HQ in OH)
| Industry | F500 HQs | Revenue |
|---|---|---|
| Insurance | 3 | $145B |
|
||
| Industrial Machinery | 3 | $49B |
|
||
| Financial Services | 3 | $24B |
|
||
| Consumer Goods | 2 | $93B |
|
||
| Aerospace / Defense | 2 | $47B |
|
||
| Utilities | 2 | $33B |
|
||
Price history
+300.5% since first listed19 events — show timeline
- 2026-04-27 Listed $300,000 Cincy MLS
- 2026-04-21 Listed for Rent $700 CINCYMLS
- 2026-03-16 Listing Removed — Cincy MLS
- 2025-09-17 Listed $300,000 Cincy MLS
- 2024-09-15 Rental Removed $700 RENTALBEAST
- 2024-09-13 Listed for Rent $700 RENTALBEAST
- 2024-08-02 Rental Removed $700 CINCYMLS
- 2024-08-02 Listed for Rent $700 CINCYMLS
- 2021-06-03 Sold (MLS) $175,000 Cincy MLS
- 2021-03-28 Contingent — Cincy MLS
- 2021-03-24 Listed $169,000 Cincy MLS
- 2019-05-17 Sold (Public Records) $105,000 Public Records
- 2019-04-25 Sold (MLS) $105,000 Cincy MLS
- 2019-04-02 Contingent — Cincy MLS
- 2019-01-09 Price Changed $115,000 Cincy MLS
- 2018-11-30 Listed $125,000 Cincy MLS
- 1996-07-08 Sold (Public Records) $70,000 Public Records
- 1996-07-03 Sold (MLS) $70,000 Cincy MLS
- 1996-03-12 Listed $74,900 Cincy MLS
Property tax history
+14.7%/yrLatest (2025): $3,887 · +0.1% YoY. Source: county tax records.
Cash-flow waterfall
monthlySold comps — $/sqft
last 12 mo · ≤1 miLoading sold comps…