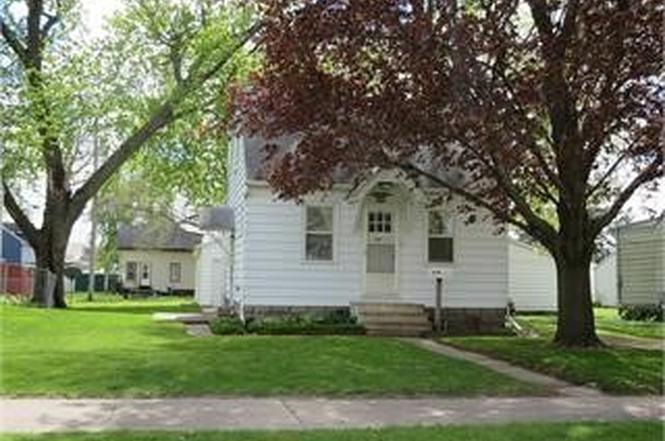
1912 Sycamore St · Waterloo, IA
Flood risk 3/10 · Minor
- FEMA flood zone
- X
- Chance of flooding over 30 yrs
- 0.2%
- Est. flood insurance / yr
- $473 – $860
Fire risk 1/10 · Minimal
- Est. fire insurance / yr
- $902 – $1,676
Heat risk 3/10 · Minor
- Hot days now (above 101°F)
- 7 days/yr
- Hot days in 30 yrs
- 16 days/yr
Wind risk 2/10 · Minimal
- Chance of severe wind over 30 yrs
- —
Air-quality risk 1/10 · Minimal
- Unhealthy air days now
- 0 days/yr
- Unhealthy air days in 30 yrs
- 0 days/yr
Risk factors via First Street. Map © Google.
Why this score? — see what drove the B+ grade
The composite is a weighted blend of 9 inputs, each scored 0–100. Each bar is that input's sub-score; the figure is the points it added to the 100-point composite (weight × sub-score).
- Cash flow +29.2/30.0
- ARV discount +15.0/15.0
- DSCR +10.0/10.0
- 1% rule +8.6/10.0
- Schools +4.4/10.0
- Rent growth +4.2/5.0
- Livability +4.0/5.0
- Condition / age +2.5/5.0
- Appreciation +0.0/10.0
$60,000
🖨 Deal sheet (PDF) 📄 Offer letter ✓ Due diligence
Listing remarks
Charming 2 bedroom just waiting for your finishing touches. Will make a wonderful first home or a great investment property. enjoy dinner in the formal dining evenings on the back patio or enjoy the yard
Key facts
- Yard
- Back patio
- 6,098 sq ft lot
Tags
Neighborhood map
What this means for you Summary
Snapshot
- This is a 2-bed/1.5-bath single-family listed at $60k.
Deal economics
- At list price, monthly cash flow is $209 ($3k/yr) — positive.
- The deal already cash-flows at list — no discount required.
- Meets the 1% rule at list price ($816 rent vs $60k).
- Cap rate 10.5% vs local median 4.2% in Waterloo — top-decile yield for the area; either an underpriced asset or a hidden risk that comps aren't pricing in. Stress-test before assuming the spread holds.
Location & tenants
- Location reads 81/100 on livability (#74 in IA, #1,589 nationally) — a professional / high-income tenant draw. Strengths: commute A+, cost of living A+, housing A+; Watch: crime F, employment D-.
- Waterloo Community School District (urban): math 50% / reading 54% proficiency, ranked #276 of 289 in IA (top 96%) — acceptable for families but not a draw, mixed tenant base, ~2y average lease.
- Zoned schools: Lowell Elementary School (math 42% / reading 42%, grade F, #563 of 616 statewide, top 93%, 513 students, 74% FRL); Bunger Middle School (math 48% / reading 47%, grade C-, #226 of 246 statewide, top 92%, 431 students, 75% FRL); West High School (math 55% / reading 63%, grade C+, #273 of 336 statewide, top 81%, 1,652 students, 62% FRL).
- Market conditions: Rents rising fast (+6.7%/yr); 98 active listings in the ZIP; 39 comparable units currently listed for rent nearby; rentals lingering (median 44d on market — plan ~5-8 weeks vacancy on turnover, expect pricing pressure); 51% of comp listings sitting > 30 days — soft ceiling on asking rent; 287 units permitted in Black Hawk County in 2024 (67 in 5+ unit buildings).
Forward outlook
- Local home prices are declining (-3.0%/yr); year-one equity from $415 of loan paydown is wiped out by about $2k of value loss. Plan a longer hold.
- Black Hawk County population projected at +10% by 2050 — modest demand growth; plan on rents tracking national, not racing it.
- At projected returns (-3.0% appreciation + 6.7% rent growth), your $17k cash investment doubles in ~7 years — after that, you're playing with house money.
Negotiation context
- Only 8 days on market — expect competitive offers; lowballing is unlikely to land.
Risks & watch-outs
- Watch-outs: built in 1941 — expect roof / HVAC / electrical / plumbing capex.
Questions for the listing agent
- Built in 1941 — when were the roof, HVAC, electrical panel, plumbing, and water heater last replaced?
- Is there a deadline driving the sale (1031 exchange, divorce, estate, relocation)? That informs how much negotiation room exists.
- Crime grade is F in this area — have there been break-ins, vandalism, or insurance claims at this property in the last 3 years? What carrier currently insures it and at what premium?
- What's the average days-on-market for RENTAL listings here right now (not sales)? A rising rental-DOM trend means longer vacancies and softer asking-rent achievability than the comps imply.
- What's the recent tenant-quality profile in this submarket — average credit score on applications, eviction rate, late-payment / NSF rate, and stable-employment percentage? A property-management company in the area should have these aggregated.
- How much new for-sale + rental construction is in the pipeline within 1–3 miles? Heavy new supply typically softens prices + rents 12–24 months out; constrained supply supports both.
Investment metrics
- 1% rule
- 1.36% ✓
- Cap rate
- 10.47%
- Cash-on-cash
- 14.94%
- DSCR
- 1.66
- GRM
- 6.1
CMA / ARV
- ARV (on-the-fly)
- $84,048
- Comps found
- 12
Show comp detail 12 sales within ~0.75 mi
| Address | Dist | Beds/Ba | Sqft | Sold | Price | $/sf | Match |
|---|---|---|---|---|---|---|---|
| 1927 Lafayette St | 0.11mi | 2/1.0 | 868 (+6%) | 3mo | $51,250 | $59 | 80 |
| 135 Dearborn Ave | 0.21mi | 2/1.0 | 778 (-5%) | 4mo | $50,000 | $64 | 77 |
| 137 French St | 0.50mi | 1/1.0 (-1) | 798 (-2%) | 5mo | $25,000 | $31 | 62 |
| 822 Colorado St | 0.36mi | 2/1.0 | 720 (-12%) | 2mo | $79,900 | $111 | 60 |
| 400 Gladys St | 0.54mi | 2/1.0 | 790 (-3%) | 12mo | $103,000 | $130 | 58 |
| 201 Lamont St | 0.46mi | 2/1.0 | 768 (-6%) | 13mo | $163,250 | $213 | 56 |
| 227 E 10th St | 0.70mi | 2/1.0 | 870 (+7%) | 1mo | $70,000 | $80 | 53 |
| 301 Idaho St | 0.49mi | 2/1.0 | 864 (+6%) | 16mo | $89,000 | $103 | 52 |
| 207 Polk St St | 0.51mi | 2/1.0 | 720 (-12%) | 6mo | $76,000 | $106 | 49 |
| 216 Polk St St | 0.50mi | 3/2.0 (+1) | 918 (+12%) | 5mo | $78,000 | $85 | 44 |
| 507 California St | 0.62mi | 2/1.0 | 704 (-14%) | 5mo | $60,000 | $85 | 42 |
| 100 Prince St | 0.48mi | 2/2.0 | 924 (+13%) | 19mo | $119,000 | $129 | 38 |
Match score weights: distance 35% · size 25% · config 20% · recency 20%. Top-matched comps best support the ARV.
Projected returns pro-forma
-3.0% appreciation · 6.67% rent growth · sell at horizon
- IRR
- 9.7%
- Equity multiple
- 1.40×
- Total profit
- $6,744
- Equity at exit
- $8,946
- IRR
- 21.8%
- Equity multiple
- 3.20×
- Total profit
- $36,948
- Equity at exit
- $5,188
Cash invested: $16,800 (down + closing). Projections, not guarantees.
Landlord ↔ Tenant lean methodology
- Overall (STATE)
- 83 Strongly Landlord-Friendly
- State Iowa
- 83 Strongly Landlord-Friendly · R+6
- County
- — inherits STATE
- City
- — inherits STATE
ZIP-level market 50703
- Rents YoY
- 6.7%
- Active inventory
- 98
- Price-to-rent
- 6.1×
Monthly cashflow live
- Estimated rent
- $816 high interval (Pro) →
- Mortgage (P&I)
- −$315
- Tax from tax record
- −$96 /mo · $1,150/yr
- Insurance
- −$25
- HOA
- −$0
- Vacancy / Maint / Mgmt
- −$171
- Net cashflow
- $209
Break-even live
Sensitivity live
| Price | -10% $243 | -5% $226 | +0% $209 | +5% $192 | +10% $175 |
|---|---|---|---|---|---|
| Rent | -10% $145 | -5% $177 | +0% $209 | +5% $241 | +10% $274 |
| Rate | -1.0pp $239 | -0.5pp $224 | base $209 | +0.5pp $194 | +1.0pp $178 |
UW: 25.0% down · 7.5% · 30yr · 1.5% tax · 5.0% vac · 8.0% maint · 8.0% mgmt
Financing live
Cash to close
- Down payment
- $15,000
- Closing costs
- $1,800
- Reserves months
- —
- Total cash needed
- —
Loan-product check · same deal, 3 products live
Conventional
25% down · 7.5% · 30yr
- Down + closing
- —
- Monthly P&I
- —
- Monthly cashflow
- —
- DSCR
- —
- Eligible?
- —
Personal DTI + credit; lowest rate.
DSCR
20% down · 8.5% · 30yr
- Down + closing
- —
- Monthly P&I
- —
- Monthly cashflow
- —
- DSCR
- —
- Eligible?
- —
No personal income docs; deal must DSCR.
Hard money
10% down · 12.0% · 12mo
- Down + closing
- —
- Monthly P&I
- —
- Monthly cashflow
- —
- DSCR
- —
- Eligible?
- —
Short-term bridge; refi at stabilization.
Rent comps 39 comps
| Address | Beds | Baths | Sqft | Rent | $/sqft | DOM | Units | Dist |
|---|---|---|---|---|---|---|---|---|
| 2006 Lafayette St Waterloo, IA | 2.0 | 1.0 | 576 | $650 | $1.13 | 21d | 1 | 0.07mi |
| 2304 Lafayette St Waterloo, IA | 2.0 | 1.0 | 971 | $825 | $0.85 | 44d | 1 | 0.34mi |
| 313 Dearborn Ave Waterloo, IA | 1.0 | 1.0 | 780 | $575 | $0.74 | 44d | 1 | 0.36mi |
| 333 Lamont St Waterloo, IA | 2.0 | 1.0 | 720 | $975 | $1.35 | 44d | 1 | 0.41mi |
| 151 French St Waterloo, IA | 2.0 | 1.0 | 640 | $825 | $1.29 | 21d | 1 | 0.50mi |
| 230 Polk St Waterloo, IA | 3.0 | 1.0 | 992 | $850 | $0.86 | 21d | 1 | 0.50mi |
| 243 Polk St Waterloo, IA | 2.0 | 1.0 | 720 | $850 | $1.18 | 21d | 1 | 0.53mi |
| 235 Madison St Waterloo, IA | 2.0 | 1.0 | 816 | $675 | $0.83 | 21d | 1 | 0.61mi |
| 269 Madison St Waterloo, IA | 2.0 | 1.0 | 816 | $675 | $0.83 | 21d | 1 | 0.64mi |
| 823 Glenwood St Waterloo, IA | 2.0 | 1.0 | 999 | $895 | $0.90 | 44d | 1 | 0.69mi |
| 425 Glenwood St Waterloo, IA | 2.0 | 1.0 | 846 | $825 | $0.98 | 21d | 1 | 0.76mi |
| 408 E 8th St Waterloo, IA | 3.0 | 1.0 | 600 | $850 | $1.42 | 44d | 1 | 0.80mi |
| 910 Mulberry St Apt 3 Waterloo, IA | 2.0 | 1.0 | 1064 | $695 | $0.65 | 21d | 1 | 0.87mi |
| 920-928 Sycamore St Unit 920-07 Waterloo, IA | 2.0 | 2.0 | 1054 | $1,250 | $1.19 | 44d | 1 | 0.87mi |
| 924 Sycamore St #1 Waterloo, IA | 2.0 | 2.0 | 1054 | $1,250 | $1.19 | 44d | 1 | 0.88mi |
| 824 Sycamore St Unit 824-09 Waterloo, IA | 2.0 | 2.0 | 1054 | $1,250 | $1.19 | 44d | 1 | 0.94mi |
| 611 Sycamore St Unit 302 Waterloo, IA | 1.0 | 1.0 | 550 | $750 | $1.36 | 21d | 1 | 1.09mi |
| 606 Sycamore St Unit A Waterloo, IA | 1.0 | 1.0 | 622 | $875 | $1.41 | 44d | 1 | 1.10mi |
| 520 Lafayette St Unit A Waterloo, IA | 2.0 | 1.0 | 800 | $750 | $0.94 | 44d | 1 | 1.14mi |
| 1001 1/2 Randolph St Waterloo, IA | 1.0 | 1.0 | 624 | $475 | $0.76 | 21d | 1 | 1.17mi |
| 716 Beech St Waterloo, IA | 2.0 | 1.0 | 672 | $875 | $1.30 | 44d | 1 | 1.18mi |
| 706 South St Waterloo, IA | 2.0 | 1.0 | 750 | $675 | $0.90 | 44d | 1 | 1.30mi |
| 706 South St Unit B Waterloo, IA | 2.0 | 1.0 | 750 | $635 | $0.85 | 21d | 1 | 1.30mi |
| 303 Franklin St Apt 2 Waterloo, IA | 2.0 | 1.0 | 600 | $650 | $1.08 | 44d | 1 | 1.31mi |
| 335 Cedar St Waterloo, IA | 1.0 | 1.0 | 540 | $1,510 | $2.80 | 21d | 1 | 1.34mi |
| 1014 Leavitt St Waterloo, IA | 2.0 | 1.0 | 700 | $1,060 | $1.51 | 21d | 2 | 1.35mi |
| 1008 Leavitt St Waterloo, IA | 2.0 | 1.0 | 700 | $920 | $1.31 | 21d | 1 | 1.36mi |
| 611 Johnson St Unit 11 Waterloo, IA | 2.0 | 1.0 | 800 | $895 | $1.12 | 44d | 1 | 1.39mi |
| 611 Johnson St Unit 8 Waterloo, IA | 2.0 | 1.0 | 800 | $825 | $1.03 | 44d | 1 | 1.39mi |
| 2001 City View St Evansdale, IA | 2.0 | 1.0 | 652 | $795 | $1.22 | 21d | 1 | 1.40mi |
| 2014 Clearview St Evansdale, IA | 2.0 | 1.0 | 708 | $795 | $1.12 | 44d | 1 | 1.41mi |
| 302 Commercial St Waterloo, IA | 1.0 | 1.0 | 901 | $1,100 | $1.22 | 21d | 1 | 1.41mi |
| 1911 Springview St Evansdale, IA | 2.0 | 1.0 | 960 | $875 | $0.91 | 44d | 1 | 1.42mi |
| 1112 Byron Ave Unit 1114 Waterloo, IA | 2.0 | 1.0 | 896 | $930 | $1.04 | 21d | 1 | 1.45mi |
| 401 Argyle St Waterloo, IA | 2.0 | 1.0 | 800 | $800 | $1.00 | 44d | 1 | 1.46mi |
| 609 Wellington Ct Waterloo, IA | 1.0 | 1.0 | 567 | $600 | $1.06 | 44d | 2 | 1.47mi |
| 609 Wellington Ct Apt D6 Waterloo, IA | 1.0 | 1.0 | 588 | $600 | $1.02 | 21d | 1 | 1.47mi |
| 1121 W 7th St Waterloo, IA | 1.0 | 1.0 | 800 | $725 | $0.91 | 44d | 1 | 1.49mi |
| 2014 Springview St Waterloo, IA | 2.0 | 1.0 | 1064 | $975 | $0.92 | 21d | 1 | 1.49mi |
Listing history 2 events
-
2024-07-26status Pending
-
2024-07-17$60,000 Active
ⓘ Source: listings_history table (triggers on properties + properties_extension) + one-shot
backfill from property_details.listing_events for pre-trigger history.
Tax reassessment forecast IA · Partial reset (capped growth)
- Current annual tax
- $1,150 · $96/mo
- Projected year-2 tax
- $1,150 · $96/mo
- Expected delta
- $0/yr ($0/mo · 0.0%)
ⓘ Screening estimate from a state-policy table — verify with the county assessor before closing.
Climate risk First Street
- Flood 3/10 Moderate FEMA zone X · 20% chance over 30 yrs
- Wildfire 1/10 Low
- Heat 3/10 Moderate 7 d/yr ≥101°F today · 16 d/yr by 30 yrs out
- Wind 2/10 Low
- Air quality 1/10 Low 0 unhealthy d/yr today · 0 by 30 yrs out
Nearby sold comps map
Loading sold comps map…
Walkable amenities ~0.75 mi
Loading nearby amenities…
Taxation est. · year 1
- Rental income
- $9,791
- − Mortgage interest
- −$3,361
- − Property taxes
- −$1,150
- − Insurance
- −$300
- − Repairs & maintenance
- −$783
- − Management
- −$783
- − Depreciation
- −$1,745
- Taxable income
- $1,668
- Est. tax owed @ 24.0%
- −$400
- After-tax cash flow
- $2,109/yr
For passive investors: Depreciation is non-cash, so a rental often shows a tax loss while cash-flowing — sheltering income. Rental losses are passive: they offset passive income freely, and up to $25,000/yr can offset ordinary (W-2) income if you actively participate and your MAGI is under $100k (phasing out to $0 by $150k); unused losses carry forward. On sale, claimed depreciation is recaptured at up to 25%, and gains may owe capital-gains tax (a 1031 exchange can defer both). Figures are a year-1 estimate at your 24.0% rate — not tax advice; consult a CPA.
Schools (NCES district)
- District
- Waterloo Community School District
- NCES district ID
- 1930480
- Math proficiency
- 50% ▼ -4.00%
- Reading proficiency
- 54% ▲ 1.00%
- Median HH income
- $42,545
- Composite
- 43.72/100
- National rank
- #2950
- State rank
- #276 of 289 in IA
Livability — Waterloo
- Score
- 81/100
- State rank
- #74
- US rank
- #1589
Category grades
Schools grade is shown separately in the Schools card above.
Census & demographics
- Census place
- Waterloo, IA
- County
- Black Hawk County · 112,933 people
- City population
- 69,066
- Metro
- Waterloo-Cedar Falls, IA
- Population (ZIP)
- 17,952
- Household income
- $50,060
- Rent vs Own
- Severe rent burden
- 871.0
Population outlook (Black Hawk County) Hauer SSP2
- Today (2025)
- 139,716 people
- By 2030
- 142,853 · +2.2%
- By 2040
- 147,843 · +5.8%
- By 2050
- 153,247 · +9.7%
- By 2075
- 167,977 · +20.2%
- By 2100
- 177,320 · +26.9%
Race, ethnicity, and origin ACS 2023
- Neighborhood character
- Diverse neighborhood (Simpson 0.62)
- Race & ethnicity
- White 55% Black 26% Hispanic / Latino 10% Two or more races 7% Asian 2%
- Hispanic origin (detail)
- Mexican 6%
- Common ancestry
- Iranian 1% Portuguese 1% Lithuanian 1%
- Foreign-born
- 7% · Canada, Philippines, China
- Languages at home
- 89% English-only · Spanish 7% Other Asian/Pacific 2% Russian/Polish/Slavic 1%
Political lean MEDSL · Black Hawk
- 2024 margin
- Toss-up / Even · D 50.0% · R 48.8% · Other 1.2%
- 2008→2024 swing
- -21.3pp toward R · 2008: 22.4pp · 2024: 1.2pp
- All cycles
- 2024: D+1.2 2020: D+9.0 2016: D+7.3 2012: D+20.0 2008: D+22.4
Not yet ingested
- Civics
- —
Market trends
- HPI YoY
- ▼ -117.18%
- Current HPI
- 132.9478
- Rent YoY
- ▲ 6.67%
- Metro
- Waterloo-Cedar Falls, IA
- State GDP YoY
- ▲ 2.48%
- F500 in state
- 4
Industry mix (Fortune 500 HQ in IA)
| Industry | F500 HQs | Revenue |
|---|---|---|
| Financial Services | 1 | $16B |
|
||
| Retail / Convenience | 1 | $15B |
|
||
Price history
2 events — show timeline
- 2024-07-26 Pending — CRAAR, CDRMLS
- 2024-07-17 Listed $60,000 CRAAR, CDRMLS
Property tax history
+6.3%/yrLatest (2025): $1,150 · +8.5% YoY. Source: county tax records.
Cash-flow waterfall
monthlySold comps — $/sqft
last 12 mo · ≤1 miLoading sold comps…