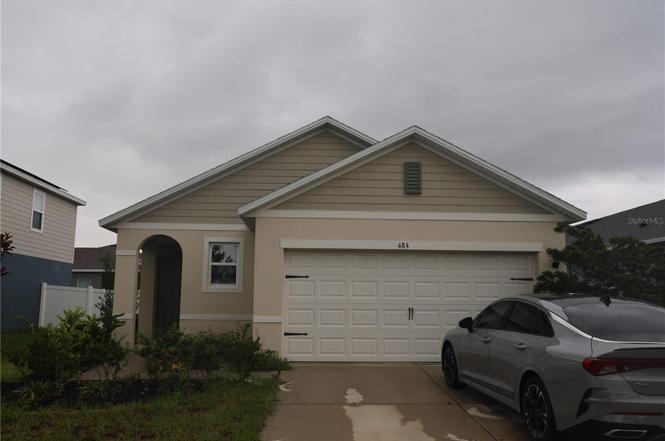
484 Lily Ln · Loughman, FL
Flood risk 1/10 · Minimal
- FEMA flood zone
- X (unshaded)
- Chance of flooding over 30 yrs
- 0.0%
- Est. flood insurance / yr
- $507 – $1,088
Fire risk 5/10 · Moderate
- Est. fire insurance / yr
- $947 – $1,759
Heat risk 8/10 · Major
- Hot days now (above 108°F)
- 7 days/yr
- Hot days in 30 yrs
- 22 days/yr
Wind risk 9/10 · Severe
- Chance of severe wind over 30 yrs
- 99.0%
Air-quality risk 1/10 · Minimal
- Unhealthy air days now
- 0 days/yr
- Unhealthy air days in 30 yrs
- 0 days/yr
Risk factors via First Street. Map © Google.
Why this score? — see what drove the D+ grade
The composite is a weighted blend of 9 inputs, each scored 0–100. Each bar is that input's sub-score; the figure is the points it added to the 100-point composite (weight × sub-score).
- Cash flow +17.3/30.0
- ARV discount +7.5/15.0
- 1% rule +6.6/10.0
- DSCR +5.4/10.0
- Schools +3.5/10.0
- Livability +3.1/5.0
- Condition / age +2.5/5.0
- Rent growth +1.8/5.0
- Appreciation +0.0/10.0
$200,000
🖨 Deal sheet 📄 Offer letter ✓ Due diligence
Listing remarks
Short Sale. Seller accepting CASH and CONVENTIONAL financing ONLY!! Bankruptcy short sale will take about 120 days to get response from lien holders. Needs TLC. Located in one of the fastest-growing areas in the country, this 3-bedroom, 2-bathroom home offers the perfect blend of comfort, efficiency, and convenience. Just minutes from world-famous theme parks, top-rated golf courses, shopping, medical centers, and restaurants, this home is ideally situated between Florida’s beautiful east and west coasts. Featuring 1,535 sq. ft. of living space, this popular Allex floor plan by D. R. Horton boasts a thoughtfully designed layout. The primary suite is tucked into the rear corner of th
Key facts
- Maximum privacy
- Spacious pantry
- Natural light
Tags
Property features AI
Finance
- Other: Total annual fees $360 (monthly $30)
- Financial info: Other annual assessment: $1,773; Total annual taxes: $6,079; Lease restrictions apply
- HOA & community: Has HOA (Highland Community Management); HOA dues $15 monthly ($180 annually); Community amenities: park, playground, pool; Pets allowed
Exterior
- Parking: Attached garage (2 spaces)
- Utilities: Public water; Public sewer; Electricity connected; Broadband/high-speed internet available
- Home design: Single family residence; One story; Faces west
- Construction: Block and stucco construction; Shingle roof; Slab foundation; Built on a 0.13-acre lot
- Exterior features: Patio; Porch; Sidewalk; Sliding doors; Vinyl fencing; Paved road access
Interior
- Kitchen: Dishwasher; Microwave; Range
- Bedrooms: 3 bedrooms
- Flooring: Carpet; Ceramic tile
- Bathrooms: 2 full bathrooms
- Heating & cooling: Electric heating; Central air conditioning
- Interior features: Walk-in closet(s); Window treatments
- Laundry & utility: Inside laundry
Neighborhood map
What this means for you Summary
Snapshot
- This is a 3-bed/2.0-bath single-family listed at $200k.
Deal economics
- At list price, monthly cash flow is $147 ($2k/yr) — positive.
- The deal already cash-flows at list — no discount required.
- Meets the 1% rule at list price ($2k rent vs $200k).
- Recommended offer: $176k (12.0% below list) — sets the bar for market timing.
- Cap rate 7.2% vs local median 3.8% in Loughman — top-decile yield for the area; either an underpriced asset or a hidden risk that comps aren't pricing in. Stress-test before assuming the spread holds.
Location & tenants
- Location reads 61/100 on livability (#781 in FL) — a middle-class / working-renter tenant base. Strengths: housing A+, crime A-; Watch: schools F, amenities F, commute F.
- Polk (suburban): math 39% / reading 43% proficiency, ranked #62 of 73 in FL (top 85%) — families likely to look elsewhere, expect single-tenant / working-renter base with shorter leases.
- Market conditions: Rents soft (-2.7%/yr); 1382 active listings in the ZIP; 26 comparable units currently listed for rent nearby; rentals at typical pace (median 23d on market — plan ~3-4 weeks tenant-placement turnaround); solid renter incomes; 10,384 units permitted in Polk County in 2024 (1,716 in 5+ unit buildings).
- This rent runs 34% of the median local income ($81k/yr) — at the standard rent-burdened threshold; future hikes will face affordability resistance.
Forward outlook
- Local home prices are declining (-3.0%/yr); year-one equity from $1k of loan paydown is wiped out by about $6k of value loss. Plan a longer hold.
- Polk County population projected at +33% by 2050 — long-run rental-demand tailwind backs the buy-and-hold thesis.
Negotiation context
- It's been on market 170 days — a 12% lower offer ($176k) is reasonable based on typical stale-listing flexibility.
- 3 sale attempts since 2y ago; this cycle's ask has dropped $30k (13%) from the opening price — seller is motivated, your offer sets the floor, not the list.
Risks & watch-outs
- Watch-outs: property tax is 3.1% of price.
- Climate carrying-cost: severe wind risk, 99% chance of damaging wind over 30y; moderate wildfire risk; extreme-heat days projected 7→22/yr by 2055 (HVAC capex compounding) — expect insurance premiums to compound above CPI over the hold.
Questions for the listing agent
- It's been on market 170 days. Have you received any prior offers? Is the seller open to a 12% concession, seller financing, or rate buy-down credit?
- Property tax is high relative to price — has the assessment been appealed recently, and will the sale trigger a re-assessment?
- What does the HOA fee cover, when was the last increase, and are there any pending special assessments or reserve-fund shortfalls?
- Why hasn't it sold? Are there any deal-killer items the seller is aware of (foundation, flood, title, zoning, code violations)?
- Is there a deadline driving the sale (1031 exchange, divorce, estate, relocation)? That informs how much negotiation room exists.
- Schools are F-rated, which usually means shorter tenancies and higher turnover. Who's the typical renter profile here, and what's been the actual vacancy rate?
- The area grade is low — what's the realistic commute time and amenity access for the typical tenant pool here? Any planned neighborhood developments (good or bad) we should know about?
- What's the average days-on-market for RENTAL listings here right now (not sales)? A rising rental-DOM trend means longer vacancies and softer asking-rent achievability than the comps imply.
- What's the recent tenant-quality profile in this submarket — average credit score on applications, eviction rate, late-payment / NSF rate, and stable-employment percentage? A property-management company in the area should have these aggregated.
- How much new for-sale + rental construction is in the pipeline within 1–3 miles? Heavy new supply typically softens prices + rents 12–24 months out; constrained supply supports both.
Investment metrics
- 1% rule
- 1.16% ✓
- Cap rate
- 7.18%
- Cash-on-cash
- 3.15%
- DSCR
- 1.14
- GRM
- 7.2
CMA / ARV
No comps found within radius.
Projected returns pro-forma
-3.0% appreciation · 0.0% rent growth · sell at horizon
- IRR
- -15.3%
- Equity multiple
- 0.47×
- Total profit
- $-29,598
- Equity at exit
- $29,821
- IRR
- -14.5%
- Equity multiple
- 0.30×
- Total profit
- $-38,999
- Equity at exit
- $17,292
Cash invested: $56,000 (down + closing). Projections, not guarantees.
Landlord ↔ Tenant lean methodology
- Overall (STATE)
- 87 Strongly Landlord-Friendly
- State Florida
- 87 Strongly Landlord-Friendly · R+3
- County
- — inherits STATE
- City
- — inherits STATE
ZIP-level market 33837
- Home prices YoY
- -33.9%
- Rents YoY
- -2.7%
- Active inventory
- 1382
- Price-to-rent
- 7.2×
Monthly cashflow live
- Estimated rent
- $2,310 high interval (Pro) →
- Mortgage (P&I)
- −$1,049
- Tax from tax record
- −$516 /mo · $6,190/yr
- Insurance
- −$83
- HOA
- −$30
- Vacancy / Maint / Mgmt
- −$485
- Net cashflow
- $147
Break-even live
UW: 25.0% down · 7.5% · 30yr · 1.5% tax · 5.0% vac · 8.0% maint · 8.0% mgmt
Financing live
Cash to close
- Down payment
- $50,000
- Closing costs
- $6,000
- Reserves months
- —
- Total cash needed
- —
Loan-product check · same deal, 3 products live
Conventional
25% down · 7.5% · 30yr
- Down + closing
- —
- Monthly P&I
- —
- Monthly cashflow
- —
- DSCR
- —
- Eligible?
- —
Personal DTI + credit; lowest rate.
DSCR
20% down · 8.5% · 30yr
- Down + closing
- —
- Monthly P&I
- —
- Monthly cashflow
- —
- DSCR
- —
- Eligible?
- —
No personal income docs; deal must DSCR.
Hard money
10% down · 12.0% · 12mo
- Down + closing
- —
- Monthly P&I
- —
- Monthly cashflow
- —
- DSCR
- —
- Eligible?
- —
Short-term bridge; refi at stabilization.
Rent comps 26 comps
| Address | Beds | Baths | Sqft | Rent | $/sqft | DOM | Units | Dist |
|---|---|---|---|---|---|---|---|---|
| 507 Lily Ln Davenport, FL | 4.0 | 2.0 | 1952 | $2,300 | $1.18 | 18d | 1 | 0.07mi |
| 2821 Pierr St Davenport, FL | 3.0 | 2.5 | 1873 | $2,000 | $1.07 | 23d | 1 | 0.18mi |
| 2788 Pierr St Davenport, FL | 3.0 | 2.5 | 1700 | $2,150 | $1.26 | 14d | 1 | 0.18mi |
| 3133 Laurent Loop Davenport, FL | 3.0 | 2.5 | 1834 | $2,000 | $1.09 | 23d | 1 | 0.27mi |
| 3141 Laurent Loop Davenport, FL | 3.0 | 2.5 | 1888 | $1,950 | $1.03 | 2d | 1 | 0.28mi |
| 2837 Pierr St Davenport, FL | 3.0 | 2.5 | 1738 | $2,100 | $1.21 | 3d | 1 | 0.29mi |
| 1731 Oceania Ave Davenport, FL | 4.0 | 2.5 | 2110 | $2,560 | $1.21 | 14d | 1 | 0.30mi |
| 1824 Brisbane Pl Davenport, FL | 3.0 | 2.0 | 1596 | $2,200 | $1.38 | 18d | 1 | 0.30mi |
| 2172 Desert Rose Dr Davenport, FL | 3.0 | 2.0 | 1545 | $2,250 | $1.46 | 23d | 1 | 0.33mi |
| 3302 Laurent Loop Davenport, FL | 3.0 | 2.5 | 1840 | $2,230 | $1.21 | 3d | 1 | 0.33mi |
| 1337 Cascade Dr Davenport, FL | 3.0 | 2.0 | 1506 | $2,025 | $1.34 | 13d | 1 | 0.37mi |
| 3255 Laurent Loop Davenport, FL | 3.0 | 2.5 | 1873 | $2,225 | $1.19 | 18d | 1 | 0.38mi |
| 1106 James Paul Rd Davenport, FL | 4.0 | 2.0 | 1897 | $2,550 | $1.34 | 23d | 1 | 0.74mi |
| 1011 John Jacob Rd Davenport, FL | 3.0 | 2.0 | 1555 | $2,200 | $1.41 | 23d | 1 | 0.74mi |
| 316 Heroic Rd Davenport, FL | 4.0 | 3.0 | 2080 | $3,000 | $1.44 | 14d | 1 | 0.77mi |
| 1126 James Paul Rd Davenport, FL | 4.0 | 2.5 | 2041 | $2,200 | $1.08 | 14d | 1 | 0.78mi |
| 506 Hatteras Rd Davenport, FL | 4.0 | 3.0 | 2120 | $2,890 | $1.36 | 3d | 1 | 0.81mi |
| 700 Daring Dr Davenport, FL | 4.0 | 2.0 | 1853 | $2,350 | $1.27 | 23d | 1 | 0.89mi |
| 865 Daring Dr Davenport, FL | 4.0 | 2.5 | 1890 | $2,650 | $1.40 | 23d | 1 | 0.89mi |
| 652 Daring Dr Davenport, FL | 3.0 | 2.0 | 2109 | $2,150 | $1.02 | 23d | 1 | 0.90mi |
| 852 Daring Dr Davenport, FL | 3.0 | 2.0 | 1555 | $1,990 | $1.28 | 23d | 1 | 0.90mi |
| 616 Daring Dr Davenport, FL | 4.0 | 2.0 | 2090 | $2,500 | $1.20 | 23d | 1 | 0.91mi |
| 334 Preserve Pointe Blvd Davenport, FL | 3.0 | 2.0 | 1511 | $2,200 | $1.46 | 23d | 1 | 1.25mi |
| 707 Scrub Oak Hammock Rd Davenport, FL | 4.0 | 2.0 | 1656 | $2,100 | $1.27 | 23d | 1 | 1.27mi |
| 711 Scrub Oak Hammock Rd Davenport, FL | 3.0 | 2.0 | 1467 | $2,000 | $1.36 | 23d | 1 | 1.28mi |
| 594 Preserve Pointe Blvd Davenport, FL | 3.0 | 2.5 | 2207 | $2,180 | $0.99 | 10d | 1 | 1.34mi |
HOA detail
- Monthly dues
- $30 · $360/yr
Listing history 20 events
-
2026-06-18days on market $200,000 Active 170 DOM
-
2026-06-17days on market $200,000 Active 169 DOM
-
2026-06-16days on market $200,000 Active 168 DOM
-
2026-06-15days on market $200,000 Active 167 DOM
-
2026-06-13days on market $200,000 Active 165 DOM
-
2026-06-10days on market $200,000 Active 162 DOM
-
2026-06-09days on market $200,000 Active 161 DOM
-
2026-06-08days on market $200,000 Active 160 DOM
-
2026-06-07days on market $200,000 Active 159 DOM
-
2026-06-05days on market $200,000 Active 156 DOM
-
2026-06-03days on market $200,000 Active 154 DOM
-
2026-06-01days on market $200,000 Active 153 DOM
-
2026-05-31days on market $200,000 Active 152 DOM
-
2026-03-03price $270,000
-
2026-03-03status Active
-
2025-09-30status Pending
-
2025-09-09price $205,000
-
2025-07-29$230,000 Active
-
2024-07-07price $339,900
-
2024-02-01$349,900 Active
ⓘ Source: listings_history table (triggers on properties + properties_extension) + one-shot
backfill from property_details.listing_events for pre-trigger history.
Tax reassessment forecast FL · Resets to sale price
- Current annual tax
- $6,190 · $516/mo
- Projected year-2 tax
- $6,190 · $516/mo
- Expected delta
- $0/yr ($0/mo · 0.0%)
ⓘ Screening estimate from a state-policy table — verify with the county assessor before closing.
Climate risk First Street
- Flood 1/10 Low FEMA zone X (unshaded) · 0% chance over 30 yrs
- Wildfire 5/10 Major
- Heat 8/10 Severe 7 d/yr ≥108°F today · 22 d/yr by 30 yrs out
- Wind 9/10 Extreme 99% chance of damaging wind over 30 yrs
- Air quality 1/10 Low 0 unhealthy d/yr today · 0 by 30 yrs out
Nearby sold comps map
Loading sold comps map…
Walkable amenities ~0.75 mi
Loading nearby amenities…
Taxation est. · year 1
- Rental income
- $27,721
- − Mortgage interest
- −$11,203
- − Property taxes
- −$6,190
- − Insurance
- −$1,000
- − Repairs & maintenance
- −$2,218
- − Management
- −$2,218
- − HOA
- −$360
- − Depreciation
- −$5,818
- Taxable loss
- −$1,285
- Est. tax savings @ 24.0%
- +$308
- After-tax cash flow
- $2,073/yr
For passive investors: Depreciation is non-cash, so a rental often shows a tax loss while cash-flowing — sheltering income. Rental losses are passive: they offset passive income freely, and up to $25,000/yr can offset ordinary (W-2) income if you actively participate and your MAGI is under $100k (phasing out to $0 by $150k); unused losses carry forward. On sale, claimed depreciation is recaptured at up to 25%, and gains may owe capital-gains tax (a 1031 exchange can defer both). Figures are a year-1 estimate at your 24.0% rate — not tax advice; consult a CPA.
Schools (NCES district)
- District
- Polk
- NCES district ID
- 1201590
- Math proficiency
- 39% ▼ -11.00%
- Reading proficiency
- 43% ▼ -4.00%
- Median HH income
- $43,979
- Composite
- 34.74/100
- National rank
- #5132
- State rank
- #62 of 73 in FL
Livability — Loughman
- Score
- 61/100
- State rank
- #781
- US rank
- #17702
Category grades
Schools grade is shown separately in the Schools card above.
Census & demographics
- County
- Polk County · 740,051 people
- City population
- 23,652
- Metro
- Lakeland-Winter Haven, FL
- Population (ZIP)
- 47,389
- Household income
- $81,276
- Rent vs Own
- Severe rent burden
- 424.0
Population outlook (Polk County) Hauer SSP2
- Today (2025)
- 752,975 people
- By 2030
- 804,621 · +6.9%
- By 2040
- 906,117 · +20.3%
- By 2050
- 1,000,476 · +32.9%
- By 2075
- 1,197,520 · +59.0%
- By 2100
- 1,271,518 · +68.9%
Race, ethnicity, and origin ACS 2023
- Neighborhood character
- Diverse neighborhood (Simpson 0.68)
- Race & ethnicity
- Hispanic / Latino 42% White 36% Two or more races 16% Black 15% Asian 2%
- Hispanic origin (detail)
- Mexican 7% Puerto Rican 22% Cuban 2% Dominican 1%
- Common ancestry
- Hispanic 5% Romanian 3% Lithuanian 1%
- Foreign-born
- 18% · Canada, Jamaica
- Languages at home
- 55% English-only · Spanish 35% French/Haitian/Cajun 6% Other Indo-European 2%
Political lean MEDSL · Polk
- 2024 margin
- Strong R (+20.7) · D 39.2% · R 59.9%
- 2008→2024 swing
- -14.6pp toward R · 2008: -6.1pp · 2024: -20.7pp
- All cycles
- 2024: R+20.7 2020: R+14.4 2016: R+14.1 2012: R+6.8 2008: R+6.1
Not yet ingested
- Civics
- —
Market trends
- HPI YoY
- ▼ -131.62%
- Current HPI
- 256.8165
- Rent YoY
- ▼ -2.73%
- Metro
- Lakeland-Winter Haven, FL
- State GDP YoY
- ▲ 3.28%
- F500 in state
- 36
Industry mix (Fortune 500 HQ in FL)
| Industry | F500 HQs | Revenue |
|---|---|---|
| Industrial Technology | 2 | $29B |
|
||
| Insurance | 2 | $17B |
|
||
| Retail | 1 | $60B |
|
||
| Technology Distribution | 1 | $58B |
|
||
| Homebuilding | 1 | $35B |
|
||
| Technology Manufacturing | 1 | $35B |
|
||
Price history
-22.8% since first listed7 events — show timeline
- 2026-03-03 Price Changed $270,000 Stellar MLS as Distributed by MLS Grid
- 2026-03-03 Relisted — Stellar MLS as Distributed by MLS Grid
- 2025-09-30 Pending — Stellar MLS as Distributed by MLS Grid
- 2025-09-09 Price Changed $205,000 Stellar MLS as Distributed by MLS Grid
- 2025-07-29 Listed $230,000 Stellar MLS as Distributed by MLS Grid
- 2024-07-07 Price Changed $339,900 Stellar MLS as Distributed by MLS Grid
- 2024-02-01 Listed $349,900 Stellar MLS as Distributed by MLS Grid
Property tax history
+28.9%/yrLatest (2025): $6,190 · +1.8% YoY. Source: county tax records.
Cash-flow waterfall
monthlySold comps — $/sqft
last 12 mo · ≤1 miLoading sold comps…