1421 S 6th St · Atchison, KS
Flood risk 1/10 · Minimal
- FEMA flood zone
- X (unshaded)
- Chance of flooding over 30 yrs
- 0.0%
- Est. flood insurance / yr
- $473 – $860
Fire risk 4/10 · Minor
- Est. fire insurance / yr
- $1,154 – $2,142
Heat risk 4/10 · Minor
- Hot days now (above 108°F)
- 7 days/yr
- Hot days in 30 yrs
- 17 days/yr
Wind risk 2/10 · Minimal
- Chance of severe wind over 30 yrs
- —
Air-quality risk 2/10 · Minimal
- Unhealthy air days now
- 0 days/yr
- Unhealthy air days in 30 yrs
- 1 days/yr
Risk factors via First Street. Map © Google.
Why this score? — see what drove the C+ grade
The composite is a weighted blend of 9 inputs, each scored 0–100. Each bar is that input's sub-score; the figure is the points it added to the 100-point composite (weight × sub-score).
- Cash flow +30.0/30.0
- 1% rule +10.0/10.0
- DSCR +10.0/10.0
- Livability +3.3/5.0
- Rent growth +2.5/5.0
- Condition / age +2.5/5.0
- Schools +1.8/10.0
- ARV discount +1.6/15.0
- Appreciation +0.0/10.0
$96,600
🖨 Deal sheet (PDF) 📄 Offer letter ✓ Due diligence
Key facts
- 9,147 sq ft lot
- Garage
- Built 1980
Property features AI
Exterior
- Parking: Garage faces front; 1-car garage
- Utilities: Public water; Public sewer
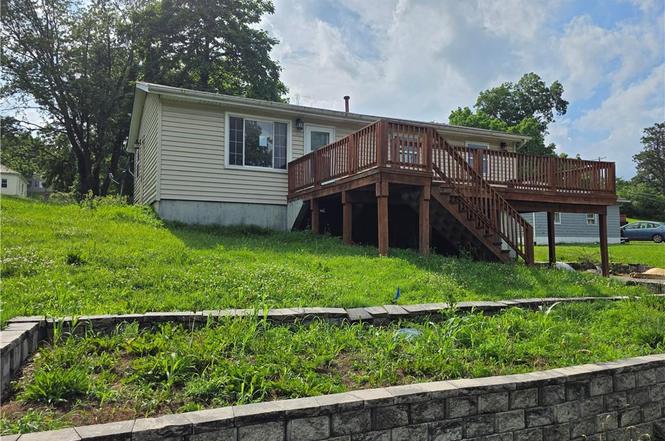
- Home design: Single-family residence; Raised ranch floor plan; Residential property
- Construction: Vinyl siding; Composition roof; Garage(s) on property; Built approximately 41–50 years ago; Finished lower level (below-grade finished area)
- Exterior features: Deck; Covered patio; Fixer up
Interior
- Kitchen: Eat-in kitchen
- Bedrooms: 3 bedrooms; Basement bedroom (finished, full)
- Bathrooms: 2 full bathrooms
- Heating & cooling: Natural gas heating; Electric cooling (central)
- Interior features: Ceiling fan(s)
- Laundry & utility: Laundry in basement
Neighborhood map
What this means for you Summary
Snapshot
- This is a 4-bed/2.0-bath single-family listed at $97k.
Deal economics
- At list price, monthly cash flow is $631 ($8k/yr) — positive.
- The deal already cash-flows at list — no discount required.
- Meets the 1% rule at list price ($2k rent vs $97k).
- Cap rate 14.1% vs local median 6.7% in Atchison — top-decile yield for the area; either an underpriced asset or a hidden risk that comps aren't pricing in. Stress-test before assuming the spread holds.
Location & tenants
- Location reads 66/100 on livability (#268 in KS) — a middle-class / working-renter tenant base. Strengths: cost of living A+, housing A+, crime A-; Watch: employment D, amenities F, commute F.
- Atchison Public Schools (town): math 18% / reading 25% proficiency, ranked #154 of 169 in KS (top 91%) — low school quality limits family demand, transient renter base, plan for 1-2y turnover.
- Zoned schools: Atchison Elementary School (math 21% / reading 29%, grade F, #537 of 684 statewide, top 79%, 703 students, 68% FRL); Atchison Middle School (math 18% / reading 21%, grade F, #152 of 219 statewide, top 72%, 313 students, 65% FRL); Atchison High School (math 12% / reading 22%, grade F, #235 of 327 statewide, top 74%, 429 students, 56% FRL).
- Market conditions: 79 active listings in the ZIP; 12 units permitted in Atchison County in 2024 (0 in 5+ unit buildings).
- This rent runs 34% of the median local income ($61k/yr) — at the standard rent-burdened threshold; future hikes will face affordability resistance.
Forward outlook
- Local home prices are declining (-3.0%/yr); year-one equity from $668 of loan paydown is wiped out by about $3k of value loss. Plan a longer hold.
- Atchison County population projected at -14% by 2050 — secular population decline; favor cash flow + early exit over multi-decade hold.
- At projected returns (-3.0% appreciation + 3.0% rent growth), your $27k cash investment doubles in ~5 years — after that, you're playing with house money.
Negotiation context
- Only 8 days on market — expect competitive offers; lowballing is unlikely to land.
- 2 sale attempts; this cycle's ask has dropped $18k (16%) from the opening price — seller is motivated, your offer sets the floor, not the list.
Risks & watch-outs
- Watch-outs: property tax is 2.7% of price.
Questions for the listing agent
- Property tax is high relative to price — has the assessment been appealed recently, and will the sale trigger a re-assessment?
- Is there a deadline driving the sale (1031 exchange, divorce, estate, relocation)? That informs how much negotiation room exists.
- Schools are D-rated, which usually means shorter tenancies and higher turnover. Who's the typical renter profile here, and what's been the actual vacancy rate?
- What's the average days-on-market for RENTAL listings here right now (not sales)? A rising rental-DOM trend means longer vacancies and softer asking-rent achievability than the comps imply.
- What's the recent tenant-quality profile in this submarket — average credit score on applications, eviction rate, late-payment / NSF rate, and stable-employment percentage? A property-management company in the area should have these aggregated.
- How much new for-sale + rental construction is in the pipeline within 1–3 miles? Heavy new supply typically softens prices + rents 12–24 months out; constrained supply supports both.
Investment metrics
- 1% rule
- 1.82% ✓
- Cap rate
- 14.13%
- Cash-on-cash
- 27.99%
- DSCR
- 2.25
- GRM
- 4.6
CMA / ARV
- ARV (on-the-fly)
- $85,440
- Comps found
- 5
Show comp detail 5 sales within ~0.75 mi
| Address | Dist | Beds/Ba | Sqft | Sold | Price | $/sf | Match |
|---|---|---|---|---|---|---|---|
| 1446 S 7th St | 0.06mi | 3/1.0 (-1) | 1,066 (+11%) | 8mo | $35,000 | $33 | 63 |
| 712 W St | 0.34mi | 3/1.0 (-1) | 1,028 (+7%) | 3mo | $144,500 | $141 | 61 |
| 1216 S 10th St | 0.38mi | 3/2.0 (-1) | 1,056 (+10%) | 10mo | $110,000 | $104 | 52 |
| 609 R St | 0.67mi | 3/2.0 (-1) | 1,078 (+12%) | 2mo | $39,000 | $36 | 41 |
| 917 & 923 S 5th St | 0.45mi | 3/1.0 (-1) | 896 (-7%) | 23mo | $79,995 | $89 | 40 |
Match score weights: distance 35% · size 25% · config 20% · recency 20%. Top-matched comps best support the ARV.
Projected returns pro-forma
-3.0% appreciation · 3.0% rent growth · sell at horizon
- IRR
- 22.2%
- Equity multiple
- 1.91×
- Total profit
- $24,613
- Equity at exit
- $14,403
- IRR
- 30.3%
- Equity multiple
- 3.72×
- Total profit
- $73,515
- Equity at exit
- $8,352
Cash invested: $27,048 (down + closing). Projections, not guarantees.
Landlord ↔ Tenant lean methodology
- Overall (STATE)
- 83 Strongly Landlord-Friendly
- State Kansas
- 83 Strongly Landlord-Friendly · R+10
- County
- — inherits STATE
- City
- — inherits STATE
ZIP-level market 66002
- Active inventory
- 79
- Price-to-rent
- 4.6×
Monthly cashflow live
- Estimated rent
- $1,762 medium interval (Pro) →
- Mortgage (P&I)
- −$507
- Tax from tax record
- −$214 /mo · $2,571/yr
- Insurance
- −$40
- HOA
- −$0
- Vacancy / Maint / Mgmt
- −$370
- Net cashflow
- $631
Break-even live
Sensitivity live
| Price | -10% $686 | -5% $658 | +0% $631 | +5% $604 | +10% $576 |
|---|---|---|---|---|---|
| Rent | -10% $492 | -5% $561 | +0% $631 | +5% $700 | +10% $770 |
| Rate | -1.0pp $680 | -0.5pp $655 | base $631 | +0.5pp $606 | +1.0pp $580 |
UW: 25.0% down · 7.5% · 30yr · 1.5% tax · 5.0% vac · 8.0% maint · 8.0% mgmt
Financing live
Cash to close
- Down payment
- $24,150
- Closing costs
- $2,898
- Reserves months
- —
- Total cash needed
- —
Loan-product check · same deal, 3 products live
Conventional
25% down · 7.5% · 30yr
- Down + closing
- —
- Monthly P&I
- —
- Monthly cashflow
- —
- DSCR
- —
- Eligible?
- —
Personal DTI + credit; lowest rate.
DSCR
20% down · 8.5% · 30yr
- Down + closing
- —
- Monthly P&I
- —
- Monthly cashflow
- —
- DSCR
- —
- Eligible?
- —
No personal income docs; deal must DSCR.
Hard money
10% down · 12.0% · 12mo
- Down + closing
- —
- Monthly P&I
- —
- Monthly cashflow
- —
- DSCR
- —
- Eligible?
- —
Short-term bridge; refi at stabilization.
Listing history 15 events
-
2026-06-21days on market $96,600 Active 8 DOM
-
2026-06-18days on market $96,600 Active 5 DOM
-
2026-06-17days on market $96,600 Active 4 DOM
-
2026-06-16days on market $96,600 Active 3 DOM
-
2026-06-15statusdays on market $96,600 Active 2 DOM
-
2026-06-07statusdays on market $96,600 Pending 82 DOM
-
2026-06-05days on market $96,600 Active 81 DOM
-
2026-06-03pricedays on market $96,600 Active 80 DOM
-
2026-06-02days on market $105,800 Active 79 DOM
-
2026-06-01days on market $105,800 Active 78 DOM
-
2026-05-31days on market $105,800 Active 77 DOM
-
2026-04-30price $105,800
-
2026-04-28status Active
-
2026-04-24historical
-
2026-03-10$115,000 Active
ⓘ Source: listings_history table (triggers on properties + properties_extension) + one-shot
backfill from property_details.listing_events for pre-trigger history.
Tax reassessment forecast KS · Resets to sale price
- Current annual tax
- $2,571 · $214/mo
- Projected year-2 tax
- $2,571 · $214/mo
- Expected delta
- $0/yr ($0/mo · 0.0%)
ⓘ Screening estimate from a state-policy table — verify with the county assessor before closing.
Climate risk First Street
- Flood 1/10 Low FEMA zone X (unshaded) · 0% chance over 30 yrs
- Wildfire 4/10 Moderate
- Heat 4/10 Moderate 7 d/yr ≥108°F today · 17 d/yr by 30 yrs out
- Wind 2/10 Low
- Air quality 2/10 Low 0 unhealthy d/yr today · 1 by 30 yrs out
Nearby sold comps map
Loading sold comps map…
Walkable amenities ~0.75 mi
Loading nearby amenities…
Taxation est. · year 1
- Rental income
- $21,144
- − Mortgage interest
- −$5,411
- − Property taxes
- −$2,571
- − Insurance
- −$483
- − Repairs & maintenance
- −$1,692
- − Management
- −$1,692
- − Depreciation
- −$2,810
- Taxable income
- $6,486
- Est. tax owed @ 24.0%
- −$1,557
- After-tax cash flow
- $6,014/yr
For passive investors: Depreciation is non-cash, so a rental often shows a tax loss while cash-flowing — sheltering income. Rental losses are passive: they offset passive income freely, and up to $25,000/yr can offset ordinary (W-2) income if you actively participate and your MAGI is under $100k (phasing out to $0 by $150k); unused losses carry forward. On sale, claimed depreciation is recaptured at up to 25%, and gains may owe capital-gains tax (a 1031 exchange can defer both). Figures are a year-1 estimate at your 24.0% rate — not tax advice; consult a CPA.
Schools (NCES district)
- District
- Atchison Public Schools
- NCES district ID
- 2003540
- Math proficiency
- 18% ▼ -7.00%
- Reading proficiency
- 25% ▼ -6.00%
- Median HH income
- $43,220
- Composite
- 18.48/100
- National rank
- #8922
- State rank
- #154 of 169 in KS
Livability — Atchison
- Score
- 66/100
- State rank
- #268
- US rank
- #12122
Category grades
Schools grade is shown separately in the Schools card above.
Census & demographics
- Census place
- Atchison, KS
- County
- Atchison County · 13,276 people
- City population
- 13,276
- Metro
- Atchison, KS
- Population (ZIP)
- 13,276
- Household income
- $61,364
- Rent vs Own
- Severe rent burden
- 228.0
Population outlook (Atchison County) Hauer SSP2
- Today (2025)
- 16,056 people
- By 2030
- 15,610 · -2.8%
- By 2040
- 14,691 · -8.5%
- By 2050
- 13,856 · -13.7%
- By 2075
- 12,402 · -22.8%
- By 2100
- 10,883 · -32.2%
Race, ethnicity, and origin ACS 2023
- Neighborhood character
- Predominantly White (85%)
- Race & ethnicity
- White 85% Two or more races 6% Black 5% Hispanic / Latino 4%
- Common ancestry
- Slovak 3% Romanian 2% Lithuanian 2%
- Foreign-born
- 3% · Canada
- Languages at home
- 96% English-only · Spanish 3%
Political lean MEDSL · Atchison
- 2024 margin
- Solid R (+37.4) · D 30.3% · R 67.7% · Other 2.0%
- 2008→2024 swing
- -29.7pp toward R · 2008: -7.7pp · 2024: -37.4pp
- All cycles
- 2024: R+37.4 2020: R+34.4 2016: R+31.8 2012: R+20.8 2008: R+7.7
Not yet ingested
- Civics
- —
Market trends
- HPI YoY
- ▼ -252.16%
- Current HPI
- 192.1037
- Rent YoY
- —
- Metro
- Atchison, KS
- State GDP YoY
- —
- F500 in state
- 0
Price history
-8.0% since first listed4 events — show timeline
- 2026-04-30 Price Changed $105,800 Heartland MLS as Distributed by MLS Grid
- 2026-04-28 Relisted — Heartland MLS as Distributed by MLS Grid
- 2026-04-24 Listing Removed — Heartland MLS as Distributed by MLS Grid
- 2026-03-10 Listed $115,000 Heartland MLS as Distributed by MLS Grid
Property tax history
+7.4%/yrLatest (2021): $2,571 · +38.5% YoY. Source: county tax records.
Cash-flow waterfall
monthlySold comps — $/sqft
last 12 mo · ≤1 miLoading sold comps…