1999 9 1/2 St NW #303 · Washington, DC
Flood risk No data
- FEMA flood zone
- —
- Chance of flooding over 30 yrs
- —
- Est. flood insurance / yr
- —
Fire risk No data
- Est. fire insurance / yr
- —
Heat risk No data
- Hot days now (above threshold)
- —
- Hot days in 30 yrs
- —
Wind risk No data
- Chance of severe wind over 30 yrs
- —
Air-quality risk No data
- Unhealthy air days now
- —
- Unhealthy air days in 30 yrs
- —
Risk factors via First Street. Map © Google.
Why this score? — see what drove the D grade
The composite is a weighted blend of 9 inputs, each scored 0–100. Each bar is that input's sub-score; the figure is the points it added to the 100-point composite (weight × sub-score).
- Cash flow +12.5/30.0
- ARV discount +7.5/15.0
- 1% rule +4.6/10.0
- DSCR +3.7/10.0
- Livability +3.7/5.0
- Schools +3.6/10.0
- Condition / age +2.5/5.0
- Rent growth +2.3/5.0
- Appreciation +0.0/10.0
$337,139
🖨 Deal sheet (PDF) 📄 Offer letter ✓ Due diligence
Listing remarks
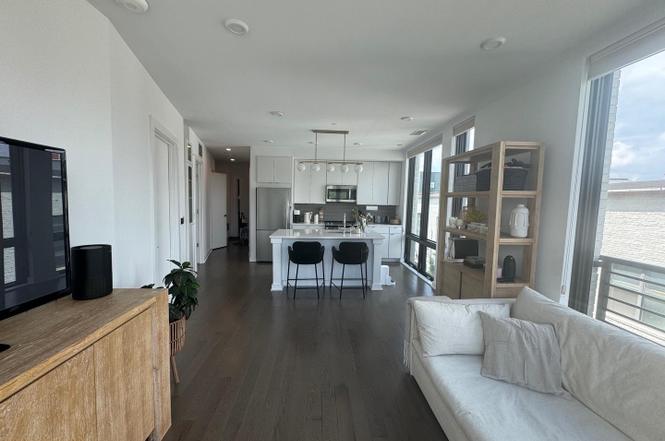
Property showings are scheduled for qualified buyers only. Mortgage pre-approval letter and IZ qualification verification are required prior to schedule a showing. IZ NON-Lottery Unit: This is an Inclusionary Zoning (IZ) 80% MFI unit. Total maximum annual household incomes (pre-tax, projected over the next 12 months) are: $104,900 (2 people), $118,000 (3 people), $131,000 (4 people), $141,600 (5 people). In the heart of the U Street Corridor, this stunning 2-bedroom, 1-bath corner condo offers modern elegance, abundant natural light, and unbeatable convenience. Built in 2021, the condo features walls of glass with north and west exposures, soaring 9-foot ceilings, and beautiful hardwood fl
Key facts
- 9-foot ceilings
- Hardwood floors
- Chef's kitchen
Tags
Property features AI
Finance
- Other: Condominium ownership; Pets allowed (cats and dogs); Accessibility features including elevator and 32+ inch wide doors
- HOA & community: Monthly condo fee of $523.28; HOA covers water, sewer, trash, and management; Building elevator
Exterior
- Parking: On-street parking; Other parking
- Utilities: Public water; Public sewer; Electric service
- Home design: Condominium unit/flat; Mid-rise building (5–8 floors); Unit located on entry floor 3; Building name: THE FOLD; Excellent property condition; Estimated year built
- Construction: Brick construction; Double-pane windows; Construction not completed (building); Estimated above-grade finished area 865
- Exterior features: No basement; Above grade and below grade structures
Interior
- Kitchen: Built-in microwave; Dishwasher; Disposal; Electric oven/range; Refrigerator
- Bedrooms: Two bedrooms on the main level
- Flooring: Wood flooring
- Bathrooms: One full bathroom
- Heating & cooling: Heat pump(s); Central air (electric); Electric hot water
- Interior features: Built-ins; Combination kitchen and living area; Open floor plan; Gourmet kitchen; Recessed lighting; Window treatments; Wood floors; Other
- Laundry & utility: Stacked washer/dryer in unit; Washer and dryer in unit; Washer/dryer hookup in unit
Neighborhood map
What this means for you Summary
Snapshot
- This is a 2-bed/1.0-bath condo listed at $337k.
Deal economics
- At list price, monthly cash flow is $-50 ($-599/yr) — negative.
- To cash-flow at today's rent, offer at most $328k (2.6% below list).
- To meet the 1% rule (rent ≥ 1% of price), the offer needs to be $323k (4.3% below list).
- Recommended offer: $297k (12.0% below list) — sets the bar for market timing.
- Cap rate 6.1% vs local median 2.5% in Washington — top-decile yield for the area; either an underpriced asset or a hidden risk that comps aren't pricing in. Stress-test before assuming the spread holds.
Location & tenants
- Location reads 73/100 on livability (#1 in DC) — a middle-class / working-renter tenant base. Strengths: amenities A+, commute A+, employment A+; Watch: crime F, cost of living F.
- District Of Columbia Public Schools (urban): math 33% / reading 40% proficiency, ranked #8 of 32 in DC (top 25%) — families likely to look elsewhere, expect single-tenant / working-renter base with shorter leases; 65% free/reduced lunch — lower-income household profile, screen leases tightly.
- Zoned schools: Garrison Es (375 students, 0% FRL); Cardozo Education Campus (639 students, 0% FRL) — zoned schools average 0% FRL vs 65% district-wide (65 pts lower); this property's tenant base skews higher-income than the district average.
- Market conditions: Rents soft (-0.8%/yr); 377 active listings in the ZIP; 40 comparable units currently listed for rent nearby; rentals at typical pace (median 20d on market — plan ~3-4 weeks tenant-placement turnaround); high-income renter base; 1,737 units permitted in District of Columbia in 2024 (1,506 in 5+ unit buildings).
Forward outlook
- Local home prices are declining (-3.0%/yr); year-one equity from $2k of loan paydown is wiped out by about $10k of value loss. Plan a longer hold.
- District of Columbia County population projected at +50% by 2050 — long-run rental-demand tailwind backs the buy-and-hold thesis.
Negotiation context
- It's been on market 310 days — a 12% lower offer ($297k) is reasonable based on typical stale-listing flexibility.
Questions for the listing agent
- What do current leases actually rent for vs. the listed asking? Can we see a recent rent roll and the last 12 months of T-12 income?
- It's been on market 310 days. Have you received any prior offers? Is the seller open to a 12% concession, seller financing, or rate buy-down credit?
- What does the HOA fee cover, when was the last increase, and are there any pending special assessments or reserve-fund shortfalls?
- Any open or pending special assessments — roof, HVAC, plumbing, elevator, façade? What's the per-unit balance and payoff schedule, and is the seller paying it off at close or rolling it to the buyer?
- Why hasn't it sold? Are there any deal-killer items the seller is aware of (foundation, flood, title, zoning, code violations)?
- Is there a deadline driving the sale (1031 exchange, divorce, estate, relocation)? That informs how much negotiation room exists.
- Crime grade is F in this area — have there been break-ins, vandalism, or insurance claims at this property in the last 3 years? What carrier currently insures it and at what premium?
- The area grade is low — what's the realistic commute time and amenity access for the typical tenant pool here? Any planned neighborhood developments (good or bad) we should know about?
- What's the average days-on-market for RENTAL listings here right now (not sales)? A rising rental-DOM trend means longer vacancies and softer asking-rent achievability than the comps imply.
- What's the recent tenant-quality profile in this submarket — average credit score on applications, eviction rate, late-payment / NSF rate, and stable-employment percentage? A property-management company in the area should have these aggregated.
- How much new apartment / multifamily construction is in the pipeline within 1–3 miles? Heavy new supply (>2% of stock underway) typically softens rents 12–24 months out; light construction supports rent growth.
Investment metrics
- 1% rule
- 0.96% ✗
- Cap rate
- 6.12%
- Cash-on-cash
- -0.63%
- DSCR
- 0.97
- GRM
- 8.7
CMA / ARV
No comps found within radius.
Projected returns pro-forma
-3.0% appreciation · 0.0% rent growth · sell at horizon
- IRR
- -21.1%
- Equity multiple
- 0.29×
- Total profit
- $-67,054
- Equity at exit
- $50,269
- IRR
- -25.1%
- Equity multiple
- -0.04×
- Total profit
- $-98,163
- Equity at exit
- $29,150
Cash invested: $94,399 (down + closing). Projections, not guarantees.
Landlord ↔ Tenant lean methodology
- Overall (CITY)
- 0 Strongly Tenant-Friendly
- State District of Columbia
- 12 Strongly Tenant-Friendly · D+43
- County
- — inherits STATE
- City Washington
- 0 Strongly Tenant-Friendly · D+43
ZIP-level market 20001
- Rents YoY
- -0.8%
- Active inventory
- 377
- Price-to-rent
- 8.7×
Monthly cashflow live
- Estimated rent
- $3,227 high interval (Pro) →
- Mortgage (P&I)
- −$1,768
- Tax from tax record
- −$168 /mo · $2,014/yr
- Insurance
- −$140
- HOA
- −$523
- Vacancy / Maint / Mgmt
- −$678
- Net cashflow
- $-50
Break-even live
Sensitivity live
| Price | -10% $141 | -5% $45 | +0% $-50 | +5% $-145 | +10% $-241 |
|---|---|---|---|---|---|
| Rent | -10% $-305 | -5% $-177 | +0% $-50 | +5% $78 | +10% $205 |
| Rate | -1.0pp $120 | -0.5pp $36 | base $-50 | +0.5pp $-137 | +1.0pp $-226 |
UW: 25.0% down · 7.5% · 30yr · 1.5% tax · 5.0% vac · 8.0% maint · 8.0% mgmt
Financing live
Cash to close
- Down payment
- $84,285
- Closing costs
- $10,114
- Reserves months
- —
- Total cash needed
- —
Loan-product check · same deal, 3 products live
Conventional
25% down · 7.5% · 30yr
- Down + closing
- —
- Monthly P&I
- —
- Monthly cashflow
- —
- DSCR
- —
- Eligible?
- —
Personal DTI + credit; lowest rate.
DSCR
20% down · 8.5% · 30yr
- Down + closing
- —
- Monthly P&I
- —
- Monthly cashflow
- —
- DSCR
- —
- Eligible?
- —
No personal income docs; deal must DSCR.
Hard money
10% down · 12.0% · 12mo
- Down + closing
- —
- Monthly P&I
- —
- Monthly cashflow
- —
- DSCR
- —
- Eligible?
- —
Short-term bridge; refi at stabilization.
Rent comps 40 comps
| Address | Beds | Baths | Sqft | Rent | $/sqft | DOM | Units | Dist |
|---|---|---|---|---|---|---|---|---|
| 1924 8th St NW Washington, DC | 2.0 | 1.0–2.0 | 811 | $3,706 | $4.57 | 0d | 19 | 0.08mi |
| 1912 9th St NW Unit 1 Washington, DC | 3.0 | 1.0 | 805 | $2,995 | $3.72 | 16d | 1 | 0.08mi |
| 2005 11th St NW Washington, DC | 1.0 | 1.0 | 613 | $2,472 | $4.03 | 5d | 4 | 0.10mi |
| 2030 8th St NW #405 Washington, DC | 2.0 | 2.0 | 966 | $3,900 | $4.04 | 20d | 1 | 0.11mi |
| 1915 11th St NW #1 Washington, DC | 2.0 | 1.0 | 970 | $3,600 | $3.71 | 26d | 1 | 0.11mi |
| 817 T St NW Unit B Washington, DC | 1.0 | 1.0 | 866 | $2,400 | $2.77 | 13d | 1 | 0.11mi |
| 2009 8th St NW #635 Washington, DC | 1.0 | 1.0 | 616 | $2,840 | $4.61 | 22d | 1 | 0.12mi |
| 2120 Vermont Ave NW #217 Washington, DC | 2.0 | 1.0 | 722 | $3,200 | $4.43 | 20d | 1 | 0.12mi |
| 919 Florida Ave NW Washington, DC | 1.0 | 1.0 | 566 | $3,000 | $5.30 | 26d | 1 | 0.12mi |
| 919 Florida Ave NW Washington, DC | 2.0 | 2.0 | 807 | $3,100 | $3.84 | 20d | 1 | 0.12mi |
| 2120 Vermont Ave NW Washington, DC | 2.0 | 1.0 | 609 | $3,200 | $5.25 | 26d | 2 | 0.12mi |
| 2120 Vermont Ave NW Washington, DC | 2.0 | 1.0 | 758 | $3,025 | $3.99 | 22d | 2 | 0.12mi |
| 2106 10th St NW #1 Washington, DC | 2.0 | 2.0 | 910 | $3,500 | $3.85 | 26d | 1 | 0.12mi |
| 929 Florida Ave NW Washington, DC | 1.0–2.0 | 1.0–1.5 | 642 | $2,500 | $3.89 | 20d | 1 | 0.13mi |
| 2101 11th St NW #103 Washington, DC | 1.0 | 1.0 | 764 | $2,800 | $3.66 | 20d | 1 | 0.13mi |
| 2112 8th St NW Washington, DC | 1.0–2.0 | 1.0–2.0 | 860 | $5,361 | $6.23 | 0d | 12 | 0.14mi |
| 2131 9th St NW Washington, DC | 2.0 | 1.0–2.0 | 773 | $3,850 | $4.98 | 0d | 4 | 0.15mi |
| 901 W St NW Washington, DC | 1.0–2.0 | 1.0–2.5 | 1136 | $5,539 | $4.87 | 0d | 3 | 0.17mi |
| 965 Florida Ave NW Washington, DC | 2.0 | 1.0–2.0 | 778 | $4,870 | $6.26 | 0d | 17 | 0.17mi |
| 2203 10th St NW Washington, DC | 2.0 | 1.5 | 936 | $2,150 | $2.30 | 26d | 1 | 0.18mi |
| 1818 7th St NW Washington, DC | 1.0–2.0 | 1.0–2.0 | 955 | $4,650 | $4.87 | 0d | 24 | 0.21mi |
| 1802 11th St NW Unit 2A Washington, DC | 1.0 | 1.5 | 875 | $2,950 | $3.37 | 26d | 1 | 0.21mi |
| 1802 11th St NW Unit 3B Washington, DC | 3.0 | 2.0 | 1050 | $4,495 | $4.28 | 20d | 1 | 0.22mi |
| 1802 11th St NW Unit 3B Washington, DC | 3.0 | 2.0 | 1050 | $4,495 | $4.28 | 26d | 1 | 0.22mi |
| 1802 11th St NW Unit 3A Washington, DC | 2.0 | 1.5 | 900 | $3,390 | $3.77 | 20d | 1 | 0.22mi |
| 2214 11th St NW #1 Washington, DC | 2.0 | 2.0 | 1037 | $3,695 | $3.56 | 16d | 1 | 0.23mi |
| 1825 7th St NW Washington, DC | 1.0 | 1.0 | 540 | $2,581 | $4.78 | 1d | 21 | 0.23mi |
| 2015 13th St NW #2 Washington, DC | 2.0 | 2.0 | 839 | $2,895 | $3.45 | 14d | 1 | 0.24mi |
| 618 T St NW #732 Washington, DC | 1.0–2.0 | 1.0–2.0 | 752 | $4,310 | $5.73 | 4d | 2 | 0.25mi |
| 1901 13th St NW Washington, DC | 2.0 | 1.0 | 725 | $5,000 | $6.90 | 26d | 6 | 0.25mi |
| 2323 Sherman Ave NW Washington, DC | 1.0 | 1.0 | 522 | $2,729 | $5.23 | 1d | 24 | 0.26mi |
| 2006 13th St NW Washington, DC | 1.0 | 1.0 | 650 | $1,799 | $2.77 | 26d | 1 | 0.27mi |
| 1829 13th St NW Unit 104 Washington, DC | 2.0 | 2.0 | 850 | $3,000 | $3.53 | 26d | 1 | 0.27mi |
| 1829 13th St NW Unit B1 Washington, DC | 2.0 | 2.0 | 750 | $2,950 | $3.93 | 7d | 1 | 0.27mi |
| 2028 13th St NW Washington, DC | 1.0 | 1.0 | 640 | $1,695 | $2.65 | 26d | 1 | 0.27mi |
| 1215 S St NW Unit B Washington, DC | 1.0 | 1.0 | 819 | $2,700 | $3.30 | 26d | 1 | 0.28mi |
| 1310 U St NW Washington, DC | 1.0–2.0 | 1.0–2.0 | 956 | $4,705 | $4.92 | 1d | 7 | 0.28mi |
| 1915 6th St NW Washington, DC | 1.0 | 1.5 | 581 | $2,500 | $4.30 | 26d | 1 | 0.28mi |
| 1301 U St NW Washington, DC | 1.0–2.0 | 1.0–2.0 | 839 | $4,652 | $5.54 | 1d | 8 | 0.30mi |
| 543 Florida Ave NW #2 Washington, DC | 2.0 | 1.0 | 1105 | $3,200 | $2.90 | 20d | 1 | 0.30mi |
HOA detail condo
- Monthly dues
- $523 · $6,276/yr
- Assessments
- None detected in remarks — confirm with the listing agent.
Listing history 15 events
-
2026-06-21days on market $337,139 Active 310 DOM
-
2026-06-18days on market $337,139 Active 307 DOM
-
2026-06-17days on market $337,139 Active 306 DOM
-
2026-06-16days on market $337,139 Active 305 DOM
-
2026-06-15days on market $337,139 Active 304 DOM
-
2026-06-13days on market $337,139 Active 302 DOM
-
2026-06-09days on market $337,139 Active 298 DOM
-
2026-06-08days on market $337,139 Active 297 DOM
-
2026-06-07days on market $337,139 Active 296 DOM
-
2026-06-04days on market $337,139 Active 293 DOM
-
2026-06-03days on market $337,139 Active 292 DOM
-
2026-06-02days on market $337,139 Active 291 DOM
-
2026-06-01days on market $337,139 Active 290 DOM
-
2026-05-31days on market $337,139 Active 289 DOM
-
2025-08-15$337,139 Active
ⓘ Source: listings_history table (triggers on properties + properties_extension) + one-shot
backfill from property_details.listing_events for pre-trigger history.
Tax reassessment forecast DC · Partial reset (capped growth)
- Current annual tax
- $2,014 · $168/mo
- Projected year-2 tax
- $2,035 · $170/mo
- Expected delta
- +$21/yr (+$2/mo · 1.1%)
ⓘ Screening estimate from a state-policy table — verify with the county assessor before closing.
Nearby sold comps map
Loading sold comps map…
Walkable amenities ~0.75 mi
Loading nearby amenities…
Taxation est. · year 1
- Rental income
- $38,725
- − Mortgage interest
- −$18,885
- − Property taxes
- −$2,014
- − Insurance
- −$1,686
- − Repairs & maintenance
- −$3,098
- − Management
- −$3,098
- − HOA
- −$6,276
- − Depreciation
- −$9,808
- Taxable loss
- −$6,140
- Est. tax savings @ 24.0%
- +$1,474
- After-tax cash flow
- $874/yr
For passive investors: Depreciation is non-cash, so a rental often shows a tax loss while cash-flowing — sheltering income. Rental losses are passive: they offset passive income freely, and up to $25,000/yr can offset ordinary (W-2) income if you actively participate and your MAGI is under $100k (phasing out to $0 by $150k); unused losses carry forward. On sale, claimed depreciation is recaptured at up to 25%, and gains may owe capital-gains tax (a 1031 exchange can defer both). Figures are a year-1 estimate at your 24.0% rate — not tax advice; consult a CPA.
Schools (NCES district)
- District
- District Of Columbia Public Schools
- NCES district ID
- 1100030
- Math proficiency
- 33% ▲ 3.00%
- Reading proficiency
- 40% ▲ 5.00%
- Median HH income
- $67,671
- Composite
- 35.84/100
- National rank
- #9606
- State rank
- #8 of 32 in DC
Livability — Washington
- Score
- 73/100
- State rank
- #1
- US rank
- #5327
Category grades
Schools grade is shown separately in the Schools card above.
Census & demographics
- Census place
- Washington, DC
- County
- District of Columbia · 671,873 people
- City population
- 671,873
- Metro
- Washington-Arlington-Alexandria, DC-VA-MD-WV
- Population (ZIP)
- 44,616
- Household income
- $138,059
- Rent vs Own
- Severe rent burden
- 3130.0
Population outlook (District of Columbia County) Hauer SSP2
- Today (2025)
- 821,926 people
- By 2030
- 899,517 · +9.4%
- By 2040
- 1,061,162 · +29.1%
- By 2050
- 1,231,493 · +49.8%
- By 2075
- 1,603,312 · +95.1%
- By 2100
- 1,847,141 · +124.7%
Race, ethnicity, and origin ACS 2023
- Neighborhood character
- Diverse neighborhood (Simpson 0.67)
- Race & ethnicity
- White 47% Black 30% Hispanic / Latino 11% Two or more races 8% Asian 7%
- Hispanic origin (detail)
- Mexican 2%
- Common ancestry
- Romanian 3% Lithuanian 3% Italian 2%
- Foreign-born
- 15% · Canada, China, South Korea
- Languages at home
- 81% English-only · Spanish 7% Chinese 3% Other Indo-European 2%
Political lean MEDSL · District of Columbia
- 2024 margin
- Solid D (+86.1) · D 91.2% · R 5.1% · Other 3.8%
- 2008→2024 swing
- +0.1pp no change · 2008: 85.9pp · 2024: 86.1pp
- All cycles
- 2024: D+86.1 2020: D+86.8 2016: D+88.7 2012: D+84.2 2008: D+85.9
Not yet ingested
- Civics
- —
Market trends
- HPI YoY
- ▼ -859.30%
- Current HPI
- 400.1329
- Rent YoY
- ▼ -0.75%
- Metro
- Washington-Arlington-Alexandria, DC-VA-MD-WV
- State GDP YoY
- ▲ 1.33%
- F500 in state
- 6
Industry mix (Fortune 500 HQ in DC)
| Industry | F500 HQs | Revenue |
|---|---|---|
| Financial Services | 1 | $153B |
|
||
| Life Sciences / Industrials | 1 | $25B |
|
||
| Industrial Machinery | 1 | $8B |
|
||
Price history
1 event — show timeline
- 2025-08-15 Listed $337,139 BRIGHT MLS
Property tax history
-17.8%/yrLatest (2025): $2,014 · +3.4% YoY. Source: county tax records.
Cash-flow waterfall
monthlySold comps — $/sqft
last 12 mo · ≤1 miLoading sold comps…