4063 Rolling Oaks Dr · Jan Phyl Village, FL
Flood risk 1/10 · Minimal
- FEMA flood zone
- X (unshaded)
- Chance of flooding over 30 yrs
- 0.0%
- Est. flood insurance / yr
- $507 – $1,088
Fire risk 5/10 · Moderate
- Est. fire insurance / yr
- $947 – $1,759
Heat risk 8/10 · Major
- Hot days now (above 107°F)
- 7 days/yr
- Hot days in 30 yrs
- 24 days/yr
Wind risk 9/10 · Severe
- Chance of severe wind over 30 yrs
- 99.0%
Air-quality risk 2/10 · Minimal
- Unhealthy air days now
- 2 days/yr
- Unhealthy air days in 30 yrs
- 2 days/yr
Risk factors via First Street. Map © Google.
Why this score? — see what drove the B- grade
The composite is a weighted blend of 9 inputs, each scored 0–100. Each bar is that input's sub-score; the figure is the points it added to the 100-point composite (weight × sub-score).
- Cash flow +30.0/30.0
- DSCR +10.0/10.0
- 1% rule +9.5/10.0
- ARV discount +7.5/15.0
- Schools +3.5/10.0
- Rent growth +3.1/5.0
- Livability +3.1/5.0
- Condition / age +2.5/5.0
- Appreciation +0.0/10.0
$114,995
🖨 Deal sheet (PDF) 📄 Offer letter ✓ Due diligence
Listing remarks
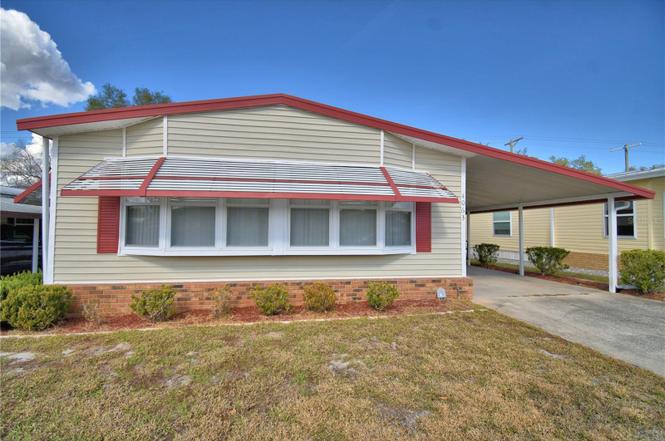
Move right into this very well maintained home. This home comes furnished with most of what you see including dishes, pots and pans, and silverware. There is laminate flooring throughout the entire home. The roof was installed in 2010 and the air conditioner in 2011. The open living space makes the home very comfortable and appealing. The front porch area is incorporated into the living area and is perfect for entertaining. The washer and dryer are just 3 years old. If that isn't enough the golf cart is included. This home is located in Oakwood Estates, a 55+ community offering many amenities and activities. You can be as busy as you want or just sit back and watch the world go by!!
Key facts
- Laminate flooring
- Front porch area
- Golf cart included
Tags
Property features AI
Finance
- Other: Furnished; Living area approximately 1,320 square feet; Lot approximately 0.08 acres (paved private maintained road)
- Financial info: Total annual fees $1,957.32 (monthly $163.11)
- HOA & community: Has HOA (monthly fee $163.11) covering water and trash; Association amenities: Clubhouse, Gated community, Laundry, Pool, Shuffleboard court, Tennis courts; Buyer approval required; Deed restrictions; Golf carts permitted; Senior community; Pets allowed
Exterior
- Parking: Carport (1 space)
- Utilities: Public water; Public sewer; Electricity connected; Water connected; Sewer connected
- Home design: Manufactured double wide home; One level; South-facing
- Construction: Metal frame with vinyl siding; Shingle roof; Crawlspace foundation; Built as a manufactured home
- Exterior features: Rain gutters; Fishing pier (water extras)
Interior
- Kitchen: Range; Refrigerator
- Bedrooms: 2 bedrooms
- Flooring: Laminate
- Bathrooms: 2 full bathrooms
- Heating & cooling: Central heating (electric); Central air conditioning
- Interior features: Ceiling fans
- Laundry & utility: Washer; Dryer; Electric water heater; Laundry: Other
Neighborhood map
What this means for you Summary
Snapshot
- This is a 2-bed/2.0-bath manufactured listed at $115k.
Deal economics
- At list price, monthly cash flow is $464 ($6k/yr) — positive.
- The deal already cash-flows at list — no discount required.
- Meets the 1% rule at list price ($2k rent vs $115k).
- Recommended offer: $101k (12.0% below list) — sets the bar for market timing.
Location & tenants
- Location reads 62/100 on livability (#769 in FL) — a middle-class / working-renter tenant base. Strengths: cost of living A+, housing A+; Watch: employment D+, amenities F, commute F.
- Polk (suburban): math 39% / reading 43% proficiency, ranked #62 of 73 in FL (top 85%) — families likely to look elsewhere, expect single-tenant / working-renter base with shorter leases.
- Zoned schools: Eagle Lake Elementary School (math 49% / reading 40%, grade F, #1,288 of 2,144 statewide, top 62%, 697 students, 59% FRL); Westwood Middle School (math 19% / reading 26%, grade F, #546 of 571 statewide, top 96%, 878 students, 70% FRL); Lake Region High School (math 14% / reading 22%, grade F, #570 of 667 statewide, top 86%, 1,545 students, 61% FRL) — zoned schools at 64% FRL track the district average.
- Zoned-school proficiency averages 28% at this address vs 41% district-wide (-13 pts) — the specific schools serving this property underperform the Polk average; the district grade overstates school quality for this exact location.
- Market conditions: Rents rising (+2.5%/yr); 345 active listings in the ZIP; 8 comparable units currently listed for rent nearby; rentals at typical pace (median 17d on market — plan ~3-4 weeks tenant-placement turnaround); 10,384 units permitted in Polk County in 2024 (1,716 in 5+ unit buildings).
- This rent runs 36% of the median local income ($56k/yr) — at the standard rent-burdened threshold; future hikes will face affordability resistance.
Forward outlook
- Local home prices are declining (-3.0%/yr); year-one equity from $795 of loan paydown is wiped out by about $3k of value loss. Plan a longer hold.
- Polk County population projected at +33% by 2050 — long-run rental-demand tailwind backs the buy-and-hold thesis.
- At projected returns (-3.0% appreciation + 2.5% rent growth), your $32k cash investment doubles in ~8 years — after that, you're playing with house money.
Negotiation context
- It's been on market 160 days — a 12% lower offer ($101k) is reasonable based on typical stale-listing flexibility.
Risks & watch-outs
- Climate carrying-cost: severe wind risk, 99% chance of damaging wind over 30y; moderate wildfire risk; extreme-heat days projected 7→24/yr by 2055 (HVAC capex compounding) — expect insurance premiums to compound above CPI over the hold.
Questions for the listing agent
- It's been on market 160 days. Have you received any prior offers? Is the seller open to a 12% concession, seller financing, or rate buy-down credit?
- What does the HOA fee cover, when was the last increase, and are there any pending special assessments or reserve-fund shortfalls?
- Why hasn't it sold? Are there any deal-killer items the seller is aware of (foundation, flood, title, zoning, code violations)?
- Is there a deadline driving the sale (1031 exchange, divorce, estate, relocation)? That informs how much negotiation room exists.
- Schools are F-rated, which usually means shorter tenancies and higher turnover. Who's the typical renter profile here, and what's been the actual vacancy rate?
- What's the average days-on-market for RENTAL listings here right now (not sales)? A rising rental-DOM trend means longer vacancies and softer asking-rent achievability than the comps imply.
- What's the recent tenant-quality profile in this submarket — average credit score on applications, eviction rate, late-payment / NSF rate, and stable-employment percentage? A property-management company in the area should have these aggregated.
- How much new for-sale + rental construction is in the pipeline within 1–3 miles? Heavy new supply typically softens prices + rents 12–24 months out; constrained supply supports both.
Investment metrics
- 1% rule
- 1.45% ✓
- Cap rate
- 11.13%
- Cash-on-cash
- 17.28%
- DSCR
- 1.77
- GRM
- 5.7
CMA / ARV
No comps found within radius.
Projected returns pro-forma
-3.0% appreciation · 2.47% rent growth · sell at horizon
- IRR
- 8.0%
- Equity multiple
- 1.31×
- Total profit
- $10,070
- Equity at exit
- $17,146
- IRR
- 16.8%
- Equity multiple
- 2.35×
- Total profit
- $43,448
- Equity at exit
- $9,943
Cash invested: $32,199 (down + closing). Projections, not guarantees.
Landlord ↔ Tenant lean methodology
- Overall (STATE)
- 87 Strongly Landlord-Friendly
- State Florida
- 87 Strongly Landlord-Friendly · R+3
- County
- — inherits STATE
- City
- — inherits STATE
ZIP-level market 33880
- Home prices YoY
- -16.2%
- Rents YoY
- 2.5%
- Active inventory
- 345
- Price-to-rent
- 5.7×
Monthly cashflow live
- Estimated rent
- $1,669 high interval (Pro) →
- Mortgage (P&I)
- −$603
- Tax from tax record
- −$41 /mo · $492/yr
- Insurance
- −$48
- HOA
- −$163
- Vacancy / Maint / Mgmt
- −$351
- Net cashflow
- $464
Break-even live
Sensitivity live
| Price | -10% $529 | -5% $496 | +0% $464 | +5% $431 | +10% $399 |
|---|---|---|---|---|---|
| Rent | -10% $332 | -5% $398 | +0% $464 | +5% $530 | +10% $595 |
| Rate | -1.0pp $522 | -0.5pp $493 | base $464 | +0.5pp $434 | +1.0pp $403 |
UW: 25.0% down · 7.5% · 30yr · 1.5% tax · 5.0% vac · 8.0% maint · 8.0% mgmt
Financing live
Cash to close
- Down payment
- $28,749
- Closing costs
- $3,450
- Reserves months
- —
- Total cash needed
- —
Loan-product check · same deal, 3 products live
Conventional
25% down · 7.5% · 30yr
- Down + closing
- —
- Monthly P&I
- —
- Monthly cashflow
- —
- DSCR
- —
- Eligible?
- —
Personal DTI + credit; lowest rate.
DSCR
20% down · 8.5% · 30yr
- Down + closing
- —
- Monthly P&I
- —
- Monthly cashflow
- —
- DSCR
- —
- Eligible?
- —
No personal income docs; deal must DSCR.
Hard money
10% down · 12.0% · 12mo
- Down + closing
- —
- Monthly P&I
- —
- Monthly cashflow
- —
- DSCR
- —
- Eligible?
- —
Short-term bridge; refi at stabilization.
Rent comps 8 comps
| Address | Beds | Baths | Sqft | Rent | $/sqft | DOM | Units | Dist |
|---|---|---|---|---|---|---|---|---|
| 3992 Warbler Dr Winter Haven, FL | 3.0 | 2.0 | 1632 | $1,750 | $1.07 | 16d | 1 | 0.40mi |
| 3211 Timberline Rd Winter Haven, FL | 3.0 | 2.0 | 1694 | $1,845 | $1.09 | 5d | 1 | 0.70mi |
| 3320 Timberline Rd W Winter Haven, FL | 3.0 | 2.0 | 1316 | $1,735 | $1.32 | 5d | 1 | 0.73mi |
| 3062 Saint Paul Dr Jan Phyl Village, FL | 2.0 | 1.0 | 1100 | $1,323 | $1.20 | 5d | 1 | 0.81mi |
| 267 Lake Thomas Dr Winter Haven, FL | 2.0 | 2.0 | 1033 | $1,800 | $1.74 | 25d | 1 | 0.91mi |
| 1059 Spirit Lake Rd Winter Haven, FL | 2.0 | 1.0 | 900 | $1,378 | $1.53 | 25d | 1 | 0.93mi |
| 449 Red Hawk Loop Winter Haven, FL | 3.0 | 2.0 | 1109 | $1,581 | $1.43 | 5d | 1 | 0.94mi |
| 108 Brad Cir Winter Haven, FL | 3.0 | 2.0 | 1325 | $1,720 | $1.30 | 25d | 1 | 1.24mi |
HOA detail
- Monthly dues
- $163 · $1,956/yr
Listing history 16 events
-
2026-06-22days on market $114,995 Active 160 DOM
-
2026-06-18days on market $114,995 Active 157 DOM
-
2026-06-17days on market $114,995 Active 156 DOM
-
2026-06-16days on market $114,995 Active 155 DOM
-
2026-06-15days on market $114,995 Active 154 DOM
-
2026-06-13days on market $114,995 Active 152 DOM
-
2026-06-10days on market $114,995 Active 149 DOM
-
2026-06-09days on market $114,995 Active 148 DOM
-
2026-06-08days on market $114,995 Active 147 DOM
-
2026-06-07days on market $114,995 Active 146 DOM
-
2026-06-05days on market $114,995 Active 143 DOM
-
2026-06-03days on market $114,995 Active 141 DOM
-
2026-06-01days on market $114,995 Active 140 DOM
-
2026-05-31days on market $114,995 Active 139 DOM
-
2026-03-02price $114,995
-
2026-01-12$119,000 Active
ⓘ Source: listings_history table (triggers on properties + properties_extension) + one-shot
backfill from property_details.listing_events for pre-trigger history.
Tax reassessment forecast FL · Resets to sale price
- Current annual tax
- $492 · $41/mo
- Projected year-2 tax
- $954 · $80/mo
- Expected delta
- +$462/yr (+$39/mo · 94.0%)
ⓘ Screening estimate from a state-policy table — verify with the county assessor before closing.
Climate risk First Street
- Flood 1/10 Low FEMA zone X (unshaded) · 0% chance over 30 yrs
- Wildfire 5/10 Major
- Heat 8/10 Severe 7 d/yr ≥107°F today · 24 d/yr by 30 yrs out
- Wind 9/10 Extreme 99% chance of damaging wind over 30 yrs
- Air quality 2/10 Low 2 unhealthy d/yr today · 2 by 30 yrs out
Nearby sold comps map
Loading sold comps map…
Walkable amenities ~0.75 mi
Loading nearby amenities…
Taxation est. · year 1
- Rental income
- $20,029
- − Mortgage interest
- −$6,442
- − Property taxes
- −$492
- − Insurance
- −$575
- − Repairs & maintenance
- −$1,602
- − Management
- −$1,602
- − HOA
- −$1,956
- − Depreciation
- −$3,345
- Taxable income
- $4,014
- Est. tax owed @ 24.0%
- −$963
- After-tax cash flow
- $4,600/yr
For passive investors: Depreciation is non-cash, so a rental often shows a tax loss while cash-flowing — sheltering income. Rental losses are passive: they offset passive income freely, and up to $25,000/yr can offset ordinary (W-2) income if you actively participate and your MAGI is under $100k (phasing out to $0 by $150k); unused losses carry forward. On sale, claimed depreciation is recaptured at up to 25%, and gains may owe capital-gains tax (a 1031 exchange can defer both). Figures are a year-1 estimate at your 24.0% rate — not tax advice; consult a CPA.
Schools (NCES district)
- District
- Polk
- NCES district ID
- 1201590
- Math proficiency
- 39% ▼ -11.00%
- Reading proficiency
- 43% ▼ -4.00%
- Median HH income
- $43,979
- Composite
- 34.74/100
- National rank
- #5132
- State rank
- #62 of 73 in FL
Livability — Jan Phyl Village
- Score
- 62/100
- State rank
- #769
- US rank
- #17294
Category grades
Schools grade is shown separately in the Schools card above.
Census & demographics
- County
- Polk County · 740,051 people
- City population
- 121,740
- Metro
- Lakeland-Winter Haven, FL
- Population (ZIP)
- 43,371
- Household income
- $56,390
- Rent vs Own
- Severe rent burden
- 1412.0
Population outlook (Polk County) Hauer SSP2
- Today (2025)
- 752,975 people
- By 2030
- 804,621 · +6.9%
- By 2040
- 906,117 · +20.3%
- By 2050
- 1,000,476 · +32.9%
- By 2075
- 1,197,520 · +59.0%
- By 2100
- 1,271,518 · +68.9%
Race, ethnicity, and origin ACS 2023
- Neighborhood character
- Diverse neighborhood (Simpson 0.65)
- Race & ethnicity
- White 49% Hispanic / Latino 27% Black 17% Two or more races 14% Asian 1%
- Hispanic origin (detail)
- Mexican 11% Puerto Rican 10% Cuban 2%
- Common ancestry
- Hispanic 2% Lithuanian 1% Italian 1%
- Foreign-born
- 9% · Canada, Jamaica
- Languages at home
- 74% English-only · Spanish 21% French/Haitian/Cajun 4%
Political lean MEDSL · Polk
- 2024 margin
- Strong R (+20.7) · D 39.2% · R 59.9%
- 2008→2024 swing
- -14.6pp toward R · 2008: -6.1pp · 2024: -20.7pp
- All cycles
- 2024: R+20.7 2020: R+14.4 2016: R+14.1 2012: R+6.8 2008: R+6.1
Not yet ingested
- Civics
- —
Market trends
- HPI YoY
- ▼ -61.41%
- Current HPI
- 317.8788
- Rent YoY
- ▲ 2.47%
- Metro
- Lakeland-Winter Haven, FL
- State GDP YoY
- ▲ 3.28%
- F500 in state
- 36
Industry mix (Fortune 500 HQ in FL)
| Industry | F500 HQs | Revenue |
|---|---|---|
| Industrial Technology | 2 | $29B |
|
||
| Insurance | 2 | $17B |
|
||
| Retail | 1 | $60B |
|
||
| Technology Distribution | 1 | $58B |
|
||
| Homebuilding | 1 | $35B |
|
||
| Technology Manufacturing | 1 | $35B |
|
||
Price history
-3.4% since first listed2 events — show timeline
- 2026-03-02 Price Changed $114,995 Stellar MLS as Distributed by MLS Grid
- 2026-01-12 Listed $119,000 Stellar MLS as Distributed by MLS Grid
Property tax history
+8.5%/yrLatest (2025): $492 · +32.9% YoY. Source: county tax records.
Cash-flow waterfall
monthlySold comps — $/sqft
last 12 mo · ≤1 miLoading sold comps…