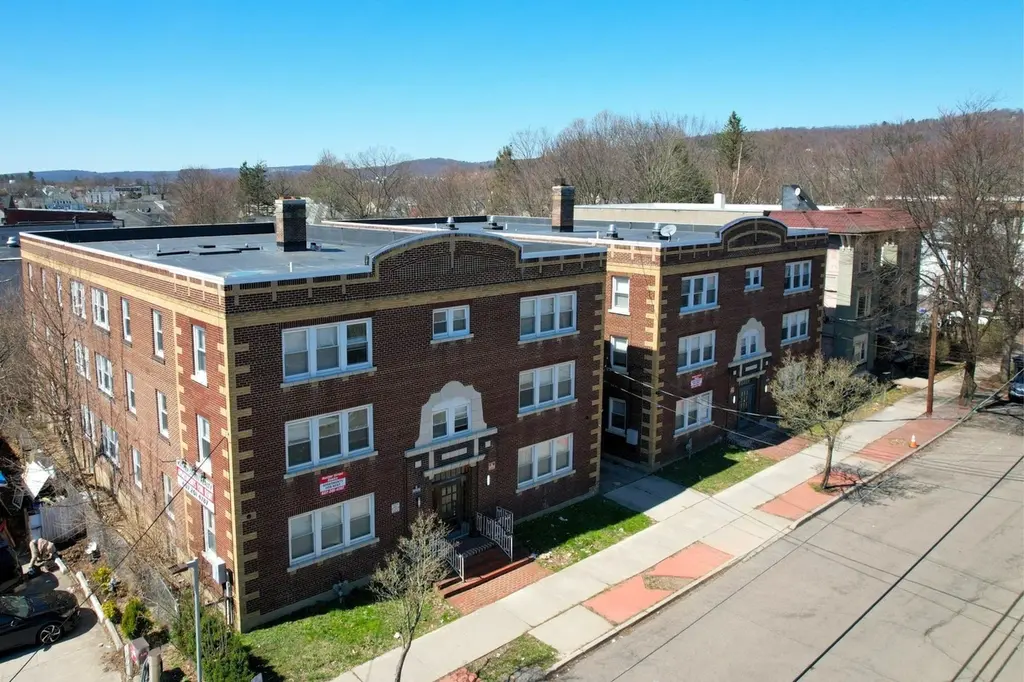
1 - 3 Mather St · Binghamton, NY
Flood risk 1/10 · Minimal
- FEMA flood zone
- X
- Chance of flooding over 30 yrs
- 0.0%
- Est. flood insurance / yr
- $473 – $860
Fire risk 3/10 · Minor
- Est. fire insurance / yr
- $691 – $1,283
Heat risk 3/10 · Minor
- Hot days now (above 92°F)
- 7 days/yr
- Hot days in 30 yrs
- 16 days/yr
Wind risk 2/10 · Minimal
- Chance of severe wind over 30 yrs
- 1.0%
Air-quality risk 2/10 · Minimal
- Unhealthy air days now
- 0 days/yr
- Unhealthy air days in 30 yrs
- 1 days/yr
Risk factors via First Street. Map © Google.
Why this score? — see what drove the F grade
The composite is a weighted blend of 9 inputs, each scored 0–100. Each bar is that input's sub-score; the figure is the points it added to the 100-point composite (weight × sub-score).
- ARV discount +7.5/15.0
- Rent growth +5.0/5.0
- Livability +3.9/5.0
- Schools +3.0/10.0
- Condition / age +2.2/5.0
- Cash flow +0.0/30.0
- 1% rule +0.0/10.0
- DSCR +0.0/10.0
- Appreciation +0.0/10.0
$3,699,000
🖨 Deal sheet (PDF) 📄 Offer letter ✓ Due diligence
Listing remarks MLS
51-unit student housing complex located on Binghamton’s West Side consisting entirely of two-bedroom units across two buildings. The property is well maintained with updated interiors, including modern cabinetry, hard surface flooring, and clean bathroom finishes. Recent improvements include new roofs totaling approximately $160,000. Utility configurations provide operational flexibility with separately metered electric and individual furnaces at 3 Mather Street. The site is zoned for 54 units, offering potential to add three additional units under existing zoning. Strong West Side location near Main Street with access to SUNY transportation routes, Downtown Binghamton, and neighborhood amenities.
Key facts
- Walk score of 83
- Individual furnaces
- Two bedroom units
Tags
Neighborhood map
What this means for you Summary
Snapshot
- This is a ?-bed/50.0-bath townhouse listed at $3.70M. Condition is rated fair.
Deal economics
- At list price, monthly cash flow is $-24k ($-294k/yr) — negative.
- To cash-flow at today's rent, offer at most $158k (95.7% below list).
- To meet the 1% rule (rent ≥ 1% of price), the offer needs to be $138k (96.3% below list).
- Recommended offer: $138k (96.3% below list) — sets the bar for 1% rule.
- Cap rate -1.6% vs local median 6.4% in Binghamton — below-typical yield; the buyer is paying a premium for something (appreciation thesis, condition, location) that the cap rate doesn't capture.
Location & tenants
- Location reads 78/100 on livability (#174 in NY, #2,710 nationally) — a middle-class / working-renter tenant base. Strengths: amenities A+, commute A+, cost of living A+; Watch: crime F, employment F.
- Binghamton City School District (urban): math 30% / reading 44% proficiency, ranked #557 of 590 in NY (top 94%) — families likely to look elsewhere, expect single-tenant / working-renter base with shorter leases; 61% free/reduced lunch — lower-income household profile, screen leases tightly.
- Zoned schools: Binghamton High School (math 71% / reading 79%, grade A-, #631 of 1,100 statewide, top 58%, 1,341 students, 69% FRL).
- Zoned-school proficiency averages 75% at this address vs 37% district-wide (+38 pts) — the actual schools serving this property are materially stronger than the Binghamton City School District average implies; a family-tenant draw the district grade alone would hide.
- Market conditions: Rents rising fast (+11.2%/yr); 136 active listings in the ZIP; 340 units permitted in Broome County in 2024 (269 in 5+ unit buildings).
- This rent runs 31% of the median local income ($53k/yr) — at the standard rent-burdened threshold; future hikes will face affordability resistance.
Forward outlook
- Local home prices are declining (-3.0%/yr); year-one equity from $26k of loan paydown is wiped out by about $111k of value loss. Plan a longer hold.
- Broome County population projected at -13% by 2050 — secular population decline; favor cash flow + early exit over multi-decade hold.
Negotiation context
- It's been on market 129 days — a 12% lower offer ($3.26M) is reasonable based on typical stale-listing flexibility.
Questions for the listing agent
- What do current leases actually rent for vs. the listed asking? Can we see a recent rent roll and the last 12 months of T-12 income?
- It's been on market 129 days. Have you received any prior offers? Is the seller open to a 96% concession, seller financing, or rate buy-down credit?
- Have any recent inspections been done? Can we get a copy of the seller's disclosures and any deferred-maintenance estimates?
- Built in 1970 — when were the roof, HVAC, electrical panel, plumbing, and water heater last replaced?
- Why hasn't it sold? Are there any deal-killer items the seller is aware of (foundation, flood, title, zoning, code violations)?
- Is there a deadline driving the sale (1031 exchange, divorce, estate, relocation)? That informs how much negotiation room exists.
- Schools are D-rated, which usually means shorter tenancies and higher turnover. Who's the typical renter profile here, and what's been the actual vacancy rate?
- Crime grade is F in this area — have there been break-ins, vandalism, or insurance claims at this property in the last 3 years? What carrier currently insures it and at what premium?
- The area grade is low — what's the realistic commute time and amenity access for the typical tenant pool here? Any planned neighborhood developments (good or bad) we should know about?
- What's the average days-on-market for RENTAL listings here right now (not sales)? A rising rental-DOM trend means longer vacancies and softer asking-rent achievability than the comps imply.
- What's the recent tenant-quality profile in this submarket — average credit score on applications, eviction rate, late-payment / NSF rate, and stable-employment percentage? A property-management company in the area should have these aggregated.
- How much new for-sale + rental construction is in the pipeline within 1–3 miles? Heavy new supply typically softens prices + rents 12–24 months out; constrained supply supports both.
Investment metrics
- 1% rule
- 0.04% ✗
- Cap rate
- -1.65%
- Cash-on-cash
- -28.36%
- DSCR
- -0.26
- GRM
- 223.6
CMA / ARV
No comps found within radius.
Projected returns pro-forma
-3.0% appreciation · 8.0% rent growth · sell at horizon
- IRR
- -82.2%
- Equity multiple
- -1.08×
- Total profit
- $-2,150,861
- Equity at exit
- $551,533
- IRR
- —
- Equity multiple
- -2.71×
- Total profit
- $-3,846,859
- Equity at exit
- $319,822
Cash invested: $1,035,720 (down + closing). Projections, not guarantees.
Landlord ↔ Tenant lean methodology
- Overall (STATE)
- 15 Strongly Tenant-Friendly
- State New York
- 15 Strongly Tenant-Friendly · D+10
- County
- — inherits STATE
- City
- — inherits STATE
ZIP-level market 13905
- Home prices YoY
- -31.1%
- Rents YoY
- 11.2%
- Active inventory
- 136
- Price-to-rent
- 223.6×
Monthly cashflow live
- Estimated rent
- $1,378 medium interval (Pro) →
- Mortgage (P&I)
- −$19,398
- Tax est. 1.5%
- −$4,624 /mo · $55,485/yr
- Insurance
- −$1,541
- HOA
- −$0
- Vacancy / Maint / Mgmt
- −$289
- Net cashflow
- $-24,474
Break-even live
Sensitivity live
| Price | -10% $-21,918 | -5% $-23,196 | +0% $-24,474 | +5% $-25,752 | +10% $-27,030 |
|---|---|---|---|---|---|
| Rent | -10% $-24,583 | -5% $-24,529 | +0% $-24,474 | +5% $-24,420 | +10% $-24,365 |
| Rate | -1.0pp $-22,611 | -0.5pp $-23,533 | base $-24,474 | +0.5pp $-25,433 | +1.0pp $-26,408 |
UW: 25.0% down · 7.5% · 30yr · 1.5% tax · 5.0% vac · 8.0% maint · 8.0% mgmt
Financing live
Cash to close
- Down payment
- $924,750
- Closing costs
- $110,970
- Reserves months
- —
- Total cash needed
- —
Loan-product check · same deal, 3 products live
Conventional
25% down · 7.5% · 30yr
- Down + closing
- —
- Monthly P&I
- —
- Monthly cashflow
- —
- DSCR
- —
- Eligible?
- —
Personal DTI + credit; lowest rate.
DSCR
20% down · 8.5% · 30yr
- Down + closing
- —
- Monthly P&I
- —
- Monthly cashflow
- —
- DSCR
- —
- Eligible?
- —
No personal income docs; deal must DSCR.
Hard money
10% down · 12.0% · 12mo
- Down + closing
- —
- Monthly P&I
- —
- Monthly cashflow
- —
- DSCR
- —
- Eligible?
- —
Short-term bridge; refi at stabilization.
Listing history 19 events
-
2026-06-21days on market $3,699,000 Active 129 DOM
-
2026-06-19days on market $3,699,000 Active 127 DOM
-
2026-06-18days on market $3,699,000 Active 126 DOM
-
2026-06-17days on market $3,699,000 Active 125 DOM
-
2026-06-16days on market $3,699,000 Active 124 DOM
-
2026-06-15days on market $3,699,000 Active 123 DOM
-
2026-06-14days on market $3,699,000 Active 121 DOM
-
2026-06-13days on market $3,699,000 Active 120 DOM
-
2026-06-10days on market $3,699,000 Active 118 DOM
-
2026-06-09days on market $3,699,000 Active 117 DOM
-
2026-06-08days on market $3,699,000 Active 116 DOM
-
2026-06-07days on market $3,699,000 Active 115 DOM
-
2026-06-03days on market $3,699,000 Active 111 DOM
-
2026-06-02days on market $3,699,000 Active 110 DOM
-
2026-06-01days on market $3,699,000 Active 109 DOM
-
2026-05-31days on market $3,699,000 Active 108 DOM
-
2026-05-30days on market $3,699,000 Active 107 DOM
-
2026-02-12$3,699,000 Active 712-char remark
Show marketing remark (712 chars)
51-unit student housing complex located on Binghamton’s West Side consisting entirely of two-bedroom units across two buildings. The property is well maintained with updated interiors, including modern cabinetry, hard surface flooring, and clean bathroom finishes. Recent improvements include new roofs totaling approximately $160,000. Utility configurations provide operational flexibility with separately metered electric and individual furnaces at 3 Mather Street. The site is zoned for 54 units, offering potential to add three additional units under existing zoning. Strong West Side location near Main Street with access to SUNY transportation routes, Downtown Binghamton, and neighborhood amenities.
-
2022-02-13price $900
ⓘ Source: listings_history table (triggers on properties + properties_extension) + one-shot
backfill from property_details.listing_events for pre-trigger history.
Climate risk First Street
- Flood 1/10 Low FEMA zone X · 0% chance over 30 yrs
- Wildfire 3/10 Moderate
- Heat 3/10 Moderate 7 d/yr ≥92°F today · 16 d/yr by 30 yrs out
- Wind 2/10 Low 100% chance of damaging wind over 30 yrs
- Air quality 2/10 Low 0 unhealthy d/yr today · 1 by 30 yrs out
Nearby sold comps map
Loading sold comps map…
Walkable amenities ~0.75 mi
Loading nearby amenities…
Taxation est. · year 1
- Rental income
- $16,539
- − Mortgage interest
- −$207,202
- − Property taxes
- −$55,485
- − Insurance
- −$18,495
- − Repairs & maintenance
- −$1,323
- − Management
- −$1,323
- − Depreciation
- −$107,607
- Taxable loss
- −$374,896
- Est. tax savings @ 24.0%
- +$89,975
- After-tax cash flow
- $-203,714/yr
For passive investors: Depreciation is non-cash, so a rental often shows a tax loss while cash-flowing — sheltering income. Rental losses are passive: they offset passive income freely, and up to $25,000/yr can offset ordinary (W-2) income if you actively participate and your MAGI is under $100k (phasing out to $0 by $150k); unused losses carry forward. On sale, claimed depreciation is recaptured at up to 25%, and gains may owe capital-gains tax (a 1031 exchange can defer both). Figures are a year-1 estimate at your 24.0% rate — not tax advice; consult a CPA.
Condition & rehab AI · 12 photos
A moderate rehab project is needed to improve the appearance and functionality of this 51-unit student housing complex. Repainting, updating fixtures, and landscaping would significantly enhance its resale and rental value.
Repairs flagged
- Moderate Kitchen cabinets — Dated appearance
- Moderate Bathroom fixtures — Dated appearance
- Moderate Exterior siding — Weathered appearance
Value-add opportunities
- Both Painting and updating kitchen cabinets — Improves aesthetics and functionality
- Both Updating bathroom fixtures — Enhances functionality and aesthetics
- Both Landscaping and curb appeal improvements — Enhances curb appeal and property value
Renovation cost estimate screening
| Repair item | Severity | Est. cost |
|---|---|---|
| Kitchen cabinets · Dated appearance | Moderate | $3,000–15,000 |
| Bathroom fixtures · Dated appearance | Moderate | $3,000–15,000 |
| Exterior siding · Weathered appearance | Moderate | $3,000–15,000 |
| Total estimated repair cost · 3 items | $9,000–45,000 |
Value-add ROI direction
- Both Painting and updating kitchen cabinets — Improves aesthetics and functionality ↑
- Both Updating bathroom fixtures — Enhances functionality and aesthetics ↑
- Both Landscaping and curb appeal improvements — Enhances curb appeal and property value ↑
ⓘ Cost ranges are severity-bucket heuristics (US national rule-of-thumb). Get contractor quotes + a written scope before underwriting a rehab budget.
Schools (NCES district)
- District
- Binghamton City School District
- NCES district ID
- 3604870
- Math proficiency
- 30% ▬ 0.00%
- Reading proficiency
- 44% ▲ 15.00%
- Median HH income
- $30,475
- Composite
- 30.09/100
- National rank
- #6342
- State rank
- #557 of 590 in NY
Livability — Binghamton
- Score
- 78/100
- State rank
- #174
- US rank
- #2710
Category grades
Schools grade is shown separately in the Schools card above.
Census & demographics
- Census place
- Binghamton, NY
- County
- Broome County · 126,805 people
- City population
- 65,170
- Metro
- Binghamton, NY
- Population (ZIP)
- 27,988
- Household income
- $53,362
- Rent vs Own
- Severe rent burden
- 1875.0
Population outlook (Broome County) Hauer SSP2
- Today (2025)
- 187,989 people
- By 2030
- 183,066 · -2.6%
- By 2040
- 172,228 · -8.4%
- By 2050
- 163,161 · -13.2%
- By 2075
- 153,641 · -18.3%
- By 2100
- 140,851 · -25.1%
Race, ethnicity, and origin ACS 2023
- Neighborhood character
- Predominantly White (68%)
- Race & ethnicity
- White 68% Asian 10% Black 10% Hispanic / Latino 7% Two or more races 7%
- Hispanic origin (detail)
- Mexican 2% Puerto Rican 3%
- Common ancestry
- Romanian 5% Lithuanian 3% Iranian 1%
- Foreign-born
- 11% · Canada, China, Vietnam
- Languages at home
- 87% English-only · Other Indo-European 5% Spanish 2% Other Asian/Pacific 1%
Political lean MEDSL · Broome
- 2024 margin
- Toss-up / Even · D 50.2% · R 49.8%
- 2008→2024 swing
- -7.6pp toward R · 2008: 8.0pp · 2024: 0.4pp
- All cycles
- 2024: D+0.4 2020: D+3.5 2016: R+3.7 2012: D+4.6 2008: D+8.0
Not yet ingested
- Civics
- —
Market trends
- HPI YoY
- ▼ -134.70%
- Current HPI
- 298.9847
- Rent YoY
- ▲ 11.19%
- Metro
- Binghamton, NY
- State GDP YoY
- ▲ 2.60%
- F500 in state
- 92
Industry mix (Fortune 500 HQ in NY)
| Industry | F500 HQs | Revenue |
|---|---|---|
| Financial Services | 10 | $950B |
|
||
| Consumer Goods | 9 | $162B |
|
||
| Insurance | 4 | $225B |
|
||
| Telecommunications | 2 | $144B |
|
||
| Pharmaceuticals | 2 | $112B |
|
||
| Media / Entertainment | 2 | $69B |
|
||
Price history
2 events — show timeline
- 2026-02-12 Listed $3,699,000 GBAOR
- 2022-02-13 Price Changed $900 RENT.
Cash-flow waterfall
monthlySold comps — $/sqft
last 12 mo · ≤1 miLoading sold comps…