783 Woodstock Rd Lot 35 · Altamont, NY
Flood risk 1/10 · Minimal
- FEMA flood zone
- X (unshaded)
- Chance of flooding over 30 yrs
- 0.0%
- Est. flood insurance / yr
- $507 – $1,088
Fire risk 1/10 · Minimal
- Est. fire insurance / yr
- $691 – $1,283
Heat risk 1/10 · Minimal
- Hot days now (above 90°F)
- 7 days/yr
- Hot days in 30 yrs
- 16 days/yr
Wind risk 3/10 · Minor
- Chance of severe wind over 30 yrs
- 5.0%
Air-quality risk 1/10 · Minimal
- Unhealthy air days now
- 0 days/yr
- Unhealthy air days in 30 yrs
- 0 days/yr
Risk factors via First Street. Map © Google.
Why this score? — see what drove the B+ grade
The composite is a weighted blend of 9 inputs, each scored 0–100. Each bar is that input's sub-score; the figure is the points it added to the 100-point composite (weight × sub-score).
- Cash flow +30.0/30.0
- 1% rule +10.0/10.0
- DSCR +10.0/10.0
- ARV discount +7.5/15.0
- Appreciation +7.0/10.0
- Schools +4.9/10.0
- Livability +3.6/5.0
- Rent growth +2.5/5.0
- Condition / age +2.5/5.0
$39,500
🖨 Deal sheet (PDF) 📄 Offer letter ✓ Due diligence
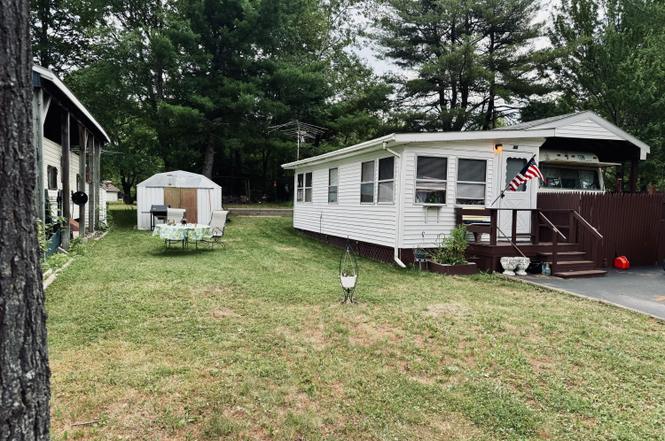
Listing remarks
Seasonal Camp on a deeded 45x75 lot. This lot is nice and level with a shed and blacktop driveway. The camp is on 190 acres with a lake, heated pool and clubhouse, playground and pickle ball court and fitness center and library. The HOA Includes electric, water sewer, WIFI and garbage disposal. Coin Laundry, This gated community is a true find for an affordable summer getaway.
Key facts
- Deeded lot
- Fitness center
- Clubhouse
Tags
Property features AI
Finance
- Other: Directions: Route 443 to Filkins Hill to Woodstock Rd
- Financial info: Annual tax amount listed as $710
- HOA & community: Homeowners association with an annual fee of $1,750 (about $145.83/month)
Exterior
- Security: Gated community
- Utilities: Underground electric
- Home design: Single-family residential property
- Exterior features: Frontage approximately 45 feet; Lot dimensions about 45 x 76 feet; Lot of about 0.07 acres; Zoned for camp park; Community clubhouse, fishing, gated entry, lake access, and pool
Interior
- Bathrooms: 1 full bathroom
- Interior features: One full bathroom
Neighborhood map
What this means for you Summary
Snapshot
- This is a 1-bed/1.0-bath single-family listed at $40k.
Deal economics
- At list price, monthly cash flow is $307 ($4k/yr) — positive.
- The deal already cash-flows at list — no discount required.
- Meets the 1% rule at list price ($919 rent vs $40k).
- Cap rate 15.6% vs local median 2.9% in Altamont — top-decile yield for the area; either an underpriced asset or a hidden risk that comps aren't pricing in. Stress-test before assuming the spread holds.
Location & tenants
- Location reads 71/100 on livability (#387 in NY) — a middle-class / working-renter tenant base. Strengths: crime A+, employment A+, housing A+; Watch: cost of living D+, amenities F, commute F.
- Berne-Knox-Westerlo Central School District (rural): math 54% / reading 57% proficiency, ranked #275 of 590 in NY (top 47%) — acceptable for families but not a draw, mixed tenant base, ~2y average lease.
- Zoned schools: Berne-Knox-Westerlo Elementary School (math 57% / reading 62%, grade B-, #745 of 2,108 statewide, top 39%, 371 students, 34% FRL); Berne-Knox-Westerlo Junior-Senior High School (math 52% / reading 52%, grade D+, #946 of 1,100 statewide, top 88%, 320 students, 32% FRL) — zoned schools at 33% FRL track the district average.
- Market conditions: 23 active listings in the ZIP; 675 units permitted in Albany County in 2024 (451 in 5+ unit buildings).
Forward outlook
- In year one you build about $2k of equity ($273 loan paydown + $2k appreciation (3.9% local appreciation)).
- Albany County population projected at +9% by 2050 — modest demand growth; plan on rents tracking national, not racing it.
- At projected returns (3.9% appreciation + 3.0% rent growth), your $11k cash investment doubles in ~2 years — after that, you're playing with house money.
Negotiation context
- Only 7 days on market — expect competitive offers; lowballing is unlikely to land.
- 2 sale attempts with the ask held roughly flat each time — persistent listings suggest the price (not the market) is what's stuck; bring a comps-based counter.
Questions for the listing agent
- Built in 1979 — when were the roof, HVAC, electrical panel, plumbing, and water heater last replaced?
- What does the HOA fee cover, when was the last increase, and are there any pending special assessments or reserve-fund shortfalls?
- Is there a deadline driving the sale (1031 exchange, divorce, estate, relocation)? That informs how much negotiation room exists.
- Schools are B-rated — typically a magnet for longer-tenancy family renters. What's the average tenant stay here, and is there a school-zone premium baked into asking?
- What's the average days-on-market for RENTAL listings here right now (not sales)? A rising rental-DOM trend means longer vacancies and softer asking-rent achievability than the comps imply.
- What's the recent tenant-quality profile in this submarket — average credit score on applications, eviction rate, late-payment / NSF rate, and stable-employment percentage? A property-management company in the area should have these aggregated.
- How much new for-sale + rental construction is in the pipeline within 1–3 miles? Heavy new supply typically softens prices + rents 12–24 months out; constrained supply supports both.
Investment metrics
- 1% rule
- 2.33% ✓
- Cap rate
- 15.61%
- Cash-on-cash
- 33.27%
- DSCR
- 2.48
- GRM
- 3.6
CMA / ARV
No comps found within radius.
Projected returns pro-forma
3.94% appreciation · 3.0% rent growth · sell at horizon
- IRR
- 40.6%
- Equity multiple
- 3.39×
- Total profit
- $26,390
- Equity at exit
- $19,884
- IRR
- 39.7%
- Equity multiple
- 6.82×
- Total profit
- $64,350
- Equity at exit
- $32,407
Cash invested: $11,060 (down + closing). Projections, not guarantees.
Landlord ↔ Tenant lean methodology
- Overall (STATE)
- 15 Strongly Tenant-Friendly
- State New York
- 15 Strongly Tenant-Friendly · D+10
- County
- — inherits STATE
- City
- — inherits STATE
ZIP-level market 12059
- Home prices YoY
- 1.2%
- Active inventory
- 23
- Price-to-rent
- 3.6×
Monthly cashflow live
- Estimated rent
- $919 medium interval (Pro) →
- Mortgage (P&I)
- −$207
- Tax est. 1.5%
- −$49 /mo · $592/yr
- Insurance
- −$16
- HOA
- −$146
- Lot rent
- −$0
- Vacancy / Maint / Mgmt
- −$193
- Net cashflow
- $307
Break-even live
Sensitivity live
| Price | -10% $334 | -5% $320 | +0% $307 | +5% $293 | +10% $279 |
|---|---|---|---|---|---|
| Rent | -10% $234 | -5% $270 | +0% $307 | +5% $343 | +10% $379 |
| Rate | -1.0pp $327 | -0.5pp $317 | base $307 | +0.5pp $296 | +1.0pp $286 |
UW: 25.0% down · 7.5% · 30yr · 1.5% tax · 5.0% vac · 8.0% maint · 8.0% mgmt
Financing live
Cash to close
- Down payment
- $9,875
- Closing costs
- $1,185
- Reserves months
- —
- Total cash needed
- —
Loan-product check · same deal, 3 products live
Conventional
25% down · 7.5% · 30yr
- Down + closing
- —
- Monthly P&I
- —
- Monthly cashflow
- —
- DSCR
- —
- Eligible?
- —
Personal DTI + credit; lowest rate.
DSCR
20% down · 8.5% · 30yr
- Down + closing
- —
- Monthly P&I
- —
- Monthly cashflow
- —
- DSCR
- —
- Eligible?
- —
No personal income docs; deal must DSCR.
Hard money
10% down · 12.0% · 12mo
- Down + closing
- —
- Monthly P&I
- —
- Monthly cashflow
- —
- DSCR
- —
- Eligible?
- —
Short-term bridge; refi at stabilization.
HOA detail
- Monthly dues
- $146 · $1,752/yr
- Likely covers
- watersewertrashelectricinternetpoolgymsecurity
Listing history 8 events
-
2026-06-22days on market $39,500 Active 7 DOM
-
2026-06-21days on market $39,500 Active 6 DOM
-
2026-06-21days on market $39,500 Active 5 DOM
-
2026-06-18days on market $39,500 Active 3 DOM
-
2026-06-17price $39,500 Active 2 DOM
-
2026-06-17days on market $40,000 Active 2 DOM
-
2026-06-16remarks 379-char remark
-
2026-06-16$40,000 Active 1 DOM
ⓘ Source: listings_history table (triggers on properties + properties_extension) + one-shot
backfill from property_details.listing_events for pre-trigger history.
Climate risk First Street
- Flood 1/10 Low FEMA zone X (unshaded) · 0% chance over 30 yrs
- Wildfire 1/10 Low
- Heat 1/10 Low 7 d/yr ≥90°F today · 16 d/yr by 30 yrs out
- Wind 3/10 Moderate 5% chance of damaging wind over 30 yrs
- Air quality 1/10 Low 0 unhealthy d/yr today · 0 by 30 yrs out
Nearby sold comps map
Loading sold comps map…
Walkable amenities ~0.75 mi
Loading nearby amenities…
Taxation est. · year 1
- Rental income
- $11,023
- − Mortgage interest
- −$2,213
- − Property taxes
- −$592
- − Insurance
- −$198
- − Repairs & maintenance
- −$882
- − Management
- −$882
- − HOA
- −$1,752
- − Depreciation
- −$1,149
- Taxable income
- $3,355
- Est. tax owed @ 24.0%
- −$805
- After-tax cash flow
- $2,875/yr
For passive investors: Depreciation is non-cash, so a rental often shows a tax loss while cash-flowing — sheltering income. Rental losses are passive: they offset passive income freely, and up to $25,000/yr can offset ordinary (W-2) income if you actively participate and your MAGI is under $100k (phasing out to $0 by $150k); unused losses carry forward. On sale, claimed depreciation is recaptured at up to 25%, and gains may owe capital-gains tax (a 1031 exchange can defer both). Figures are a year-1 estimate at your 24.0% rate — not tax advice; consult a CPA.
Schools (NCES district)
- District
- Berne-Knox-Westerlo Central School District
- NCES district ID
- 3604650
- Math proficiency
- 54% ▲ 1.00%
- Reading proficiency
- 57% ▲ 3.00%
- Median HH income
- $68,684
- Composite
- 49.13/100
- National rank
- #2046
- State rank
- #275 of 590 in NY
Livability — Altamont
- Score
- 71/100
- State rank
- #387
- US rank
- #6655
Category grades
Schools grade is shown separately in the Schools card above.
Census & demographics
- City population
- 8,068
- Population (ZIP)
- 1,531
Population outlook (Albany County) Hauer SSP2
- Today (2025)
- 320,794 people
- By 2030
- 327,401 · +2.1%
- By 2040
- 338,218 · +5.4%
- By 2050
- 348,467 · +8.6%
- By 2075
- 381,693 · +19.0%
- By 2100
- 393,809 · +22.8%
Race, ethnicity, and origin ACS 2023
- Neighborhood character
- Predominantly White (97%)
- Race & ethnicity
- White 97% Pacific Islander 1%
- Common ancestry
- Romanian 12% Lithuanian 4% Iranian 3%
- Foreign-born
- 2% · China, Canada
- Languages at home
- 99% English-only · Chinese 1%
Political lean MEDSL · Albany
- 2024 margin
- Strong D (+25.8) · D 62.9% · R 37.1%
- 2008→2024 swing
- -3.6pp toward R · 2008: 29.4pp · 2024: 25.8pp
- All cycles
- 2024: D+25.8 2020: D+31.4 2016: D+24.3 2012: D+31.0 2008: D+29.4
Not yet ingested
- Civics
- —
Market trends
- HPI YoY
- ▲ 3.94%
- Current HPI
- 337.9072
- Rent YoY
- —
- Metro
- —
- State GDP YoY
- ▲ 2.60%
- F500 in state
- 92
Industry mix (Fortune 500 HQ in NY)
| Industry | F500 HQs | Revenue |
|---|---|---|
| Financial Services | 10 | $950B |
|
||
| Consumer Goods | 9 | $162B |
|
||
| Insurance | 4 | $225B |
|
||
| Telecommunications | 2 | $144B |
|
||
| Pharmaceuticals | 2 | $112B |
|
||
| Media / Entertainment | 2 | $69B |
|
||
Price history
+0.0% since first listed3 events — show timeline
- 2026-06-14 Listed $40,000 HVCRMLS
- 2025-10-15 Listing Removed — Global MLS
- 2025-07-08 Listed $40,000 Global MLS
Cash-flow waterfall
monthlySold comps — $/sqft
last 12 mo · ≤1 miLoading sold comps…