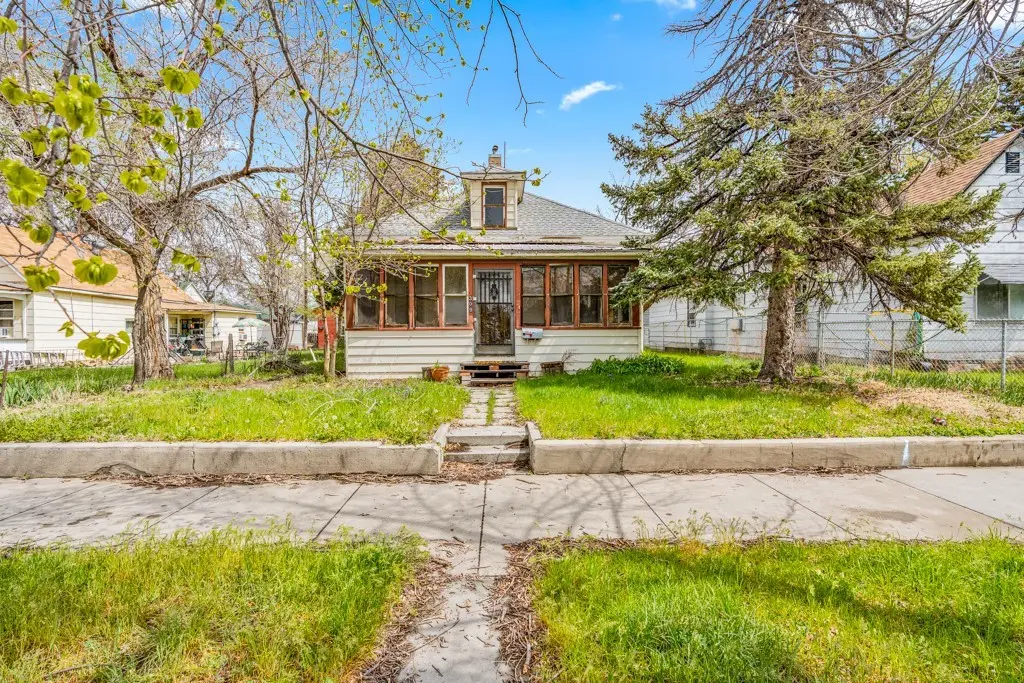
309 S 30th Street St · Billings, MT
Flood risk 1/10 · Minimal
- FEMA flood zone
- X (unshaded)
- Chance of flooding over 30 yrs
- 0.0%
- Est. flood insurance / yr
- $507 – $1,088
Fire risk 2/10 · Minimal
- Est. fire insurance / yr
- $918 – $1,706
Heat risk 3/10 · Minor
- Hot days now (above 95°F)
- 7 days/yr
- Hot days in 30 yrs
- 15 days/yr
Wind risk 1/10 · Minimal
- Chance of severe wind over 30 yrs
- —
Air-quality risk 4/10 · Minor
- Unhealthy air days now
- 3 days/yr
- Unhealthy air days in 30 yrs
- 5 days/yr
Risk factors via First Street. Map © Google.
Why this score? — see what drove the B grade
The composite is a weighted blend of 9 inputs, each scored 0–100. Each bar is that input's sub-score; the figure is the points it added to the 100-point composite (weight × sub-score).
- Cash flow +30.0/30.0
- DSCR +10.0/10.0
- 1% rule +9.7/10.0
- ARV discount +7.5/15.0
- Livability +4.0/5.0
- Rent growth +3.5/5.0
- Schools +3.2/10.0
- Condition / age +2.5/5.0
- Appreciation +0.0/10.0
$100,000
🖨 Deal sheet 📄 Offer letter ✓ Due diligence
Key facts
- 7,000 sq ft lot
- Garage
- Built 1920
Property features AI
Exterior
- Parking: Detached off-street garage; 1 covered parking space; 1 garage space
- Utilities: Public water; Public sewer
- Home design: Single-family residence; One story; Residential property
- Construction: Vinyl siding; Built with one above-grade finished level
- Exterior features: Front porch; Interior, level lot; No fencing
Interior
- Kitchen: Refrigerator
- Bedrooms: 2 bedrooms on the main level
- Bathrooms: 1 full bathroom on the main level
- Heating & cooling: Natural gas forced-air heating; Window air conditioning units
- Interior features: Refrigerator included; Partial basement
- Laundry & utility: Has basement (partial) for utility or storage space
Neighborhood map
What this means for you Summary
Snapshot
- This is a 2-bed/1.0-bath single-family listed at $100k.
Deal economics
- At list price, monthly cash flow is $466 ($6k/yr) — positive.
- The deal already cash-flows at list — no discount required.
- Meets the 1% rule at list price ($1k rent vs $100k).
- Recommended offer: $97k (3.0% below list) — sets the bar for market timing.
- Cap rate 11.9% vs local median 3.0% in Billings — top-decile yield for the area; either an underpriced asset or a hidden risk that comps aren't pricing in. Stress-test before assuming the spread holds.
Location & tenants
- Location reads 80/100 on livability (#10 in MT, #1,830 nationally) — a professional / high-income tenant draw. Strengths: amenities A+, commute A+, housing A+; Watch: schools D+, crime F.
- Billings H S (urban): math 29% / reading 45% proficiency, ranked #69 of 116 in MT (top 60%) — families likely to look elsewhere, expect single-tenant / working-renter base with shorter leases.
- Market conditions: Rents rising (+4.0%/yr); 279 active listings in the ZIP; 14 comparable units currently listed for rent nearby; rentals leasing fast (median 14d on market — plan ~1-2 weeks tenant-placement turnaround); 1,401 units permitted in Yellowstone County in 2024 (281 in 5+ unit buildings).
- This rent runs 30% of the median local income ($59k/yr) — at the standard rent-burdened threshold; future hikes will face affordability resistance.
Forward outlook
- Local home prices are declining (-3.0%/yr); year-one equity from $691 of loan paydown is wiped out by about $3k of value loss. Plan a longer hold.
- Yellowstone County population projected at +26% by 2050 — long-run rental-demand tailwind backs the buy-and-hold thesis.
- At projected returns (-3.0% appreciation + 4.0% rent growth), your $28k cash investment doubles in ~6 years — after that, you're playing with house money.
Negotiation context
- It's been on market 52 days — a 3% lower offer ($97k) is reasonable based on typical stale-listing flexibility.
- 3 sale attempts since 2y ago with the ask held roughly flat each time — persistent listings suggest the price (not the market) is what's stuck; bring a comps-based counter.
Risks & watch-outs
- Watch-outs: built in 1920 — expect roof / HVAC / electrical / plumbing capex.
Questions for the listing agent
- It's been on market 52 days. Have you received any prior offers? Is the seller open to a 3% concession, seller financing, or rate buy-down credit?
- Built in 1920 — when were the roof, HVAC, electrical panel, plumbing, and water heater last replaced?
- Is there a deadline driving the sale (1031 exchange, divorce, estate, relocation)? That informs how much negotiation room exists.
- Schools are D-rated, which usually means shorter tenancies and higher turnover. Who's the typical renter profile here, and what's been the actual vacancy rate?
- Crime grade is F in this area — have there been break-ins, vandalism, or insurance claims at this property in the last 3 years? What carrier currently insures it and at what premium?
- What's the average days-on-market for RENTAL listings here right now (not sales)? A rising rental-DOM trend means longer vacancies and softer asking-rent achievability than the comps imply.
- What's the recent tenant-quality profile in this submarket — average credit score on applications, eviction rate, late-payment / NSF rate, and stable-employment percentage? A property-management company in the area should have these aggregated.
- How much new for-sale + rental construction is in the pipeline within 1–3 miles? Heavy new supply typically softens prices + rents 12–24 months out; constrained supply supports both.
Investment metrics
- 1% rule
- 1.47% ✓
- Cap rate
- 11.88%
- Cash-on-cash
- 19.97%
- DSCR
- 1.89
- GRM
- 5.7
CMA / ARV
- ARV (on-the-fly)
- $242,250
- Comps found
- 12
Show comp detail 12 sales within ~0.75 mi
| Address | Dist | Beds/Ba | Sqft | Sold | Price | $/sf | Match |
|---|---|---|---|---|---|---|---|
| 2815 4th Ave S | 0.09mi | 2/1.5 | 1,418 (+11%) | 10mo | $250,000 | $176 | 67 |
| 518 S 31st St | 0.19mi | 2/1.5 | 1,178 (-8%) | 13mo | $259,900 | $221 | 66 |
| 213 S 31st St | 0.10mi | 2/1.0 | 1,100 (-14%) | 14mo | $215,000 | $195 | 61 |
| 323 S 37th St | 0.50mi | 2/1.0 | 1,368 (+7%) | 5mo | $260,000 | $190 | 60 |
| 205 S 39th St | 0.65mi | 3/1.0 (+1) | 1,296 (+2%) | 4mo | $99,900 | $77 | 58 |
| 3510 5th Ave S | 0.43mi | 3/2.0 (+1) | 1,354 (+6%) | 4mo | $151,900 | $112 | 58 |
| 10 Monroe St | 0.71mi | 2/1.0 | 1,229 (-4%) | 13mo | $239,500 | $195 | 50 |
| 522 S 35th St | 0.43mi | 2/1.0 | 1,461 (+15%) | 8mo | $219,900 | $151 | 49 |
| 108 Adams St | 0.72mi | 3/2.0 (+1) | 1,272 (-0%) | 10mo | $310,000 | $244 | 48 |
| 314 S 38th St St | 0.61mi | 2/1.0 | 1,344 (+5%) | 17mo | $240,000 | $179 | 48 |
| 214 Riverside Rd | 0.74mi | 3/1.0 (+1) | 1,200 (-6%) | 6mo | $264,000 | $220 | 45 |
| 2 Adams St | 0.61mi | 2/1.0 | 1,400 (+10%) | 13mo | $228,000 | $163 | 44 |
Match score weights: distance 35% · size 25% · config 20% · recency 20%. Top-matched comps best support the ARV.
Projected returns pro-forma
-3.0% appreciation · 3.96% rent growth · sell at horizon
- IRR
- 13.2%
- Equity multiple
- 1.53×
- Total profit
- $14,933
- Equity at exit
- $14,910
- IRR
- 22.8%
- Equity multiple
- 3.05×
- Total profit
- $57,327
- Equity at exit
- $8,646
Cash invested: $28,000 (down + closing). Projections, not guarantees.
Landlord ↔ Tenant lean methodology
- Overall (STATE)
- 82 Strongly Landlord-Friendly
- State Montana
- 82 Strongly Landlord-Friendly · R+11
- County
- — inherits STATE
- City
- — inherits STATE
ZIP-level market 59101
- Rents YoY
- 4.0%
- Active inventory
- 279
- Price-to-rent
- 5.7×
Monthly cashflow live
- Estimated rent
- $1,472 high interval (Pro) →
- Mortgage (P&I)
- −$524
- Tax from tax record
- −$131 /mo · $1,570/yr
- Insurance
- −$42
- HOA
- −$0
- Vacancy / Maint / Mgmt
- −$309
- Net cashflow
- $466
Break-even live
UW: 25.0% down · 7.5% · 30yr · 1.5% tax · 5.0% vac · 8.0% maint · 8.0% mgmt
Financing live
Cash to close
- Down payment
- $25,000
- Closing costs
- $3,000
- Reserves months
- —
- Total cash needed
- —
Loan-product check · same deal, 3 products live
Conventional
25% down · 7.5% · 30yr
- Down + closing
- —
- Monthly P&I
- —
- Monthly cashflow
- —
- DSCR
- —
- Eligible?
- —
Personal DTI + credit; lowest rate.
DSCR
20% down · 8.5% · 30yr
- Down + closing
- —
- Monthly P&I
- —
- Monthly cashflow
- —
- DSCR
- —
- Eligible?
- —
No personal income docs; deal must DSCR.
Hard money
10% down · 12.0% · 12mo
- Down + closing
- —
- Monthly P&I
- —
- Monthly cashflow
- —
- DSCR
- —
- Eligible?
- —
Short-term bridge; refi at stabilization.
Rent comps 14 comps
| Address | Beds | Baths | Sqft | Rent | $/sqft | DOM | Units | Dist |
|---|---|---|---|---|---|---|---|---|
| 113 N 35th St Billings, MT | 2.0 | 1.0 | 1200 | $1,800 | $1.50 | 13d | 1 | 0.58mi |
| 115 N 35th St Billings, MT | 1.0 | 1.0 | 1000 | $1,500 | $1.50 | 13d | 1 | 0.59mi |
| 2310 1st Ave N Billings, MT | 2.0 | 1.0–2.0 | 915 | $2,025 | $2.21 | 13d | 1 | 0.62mi |
| 300 N 25th St Apt 505 Billings, MT | 2.0 | 1.0 | 1000 | $1,250 | $1.25 | 13d | 1 | 0.67mi |
| 24 Grand Ave Billings, MT | 2.0 | 1.5 | 1176 | $2,200 | $1.87 | 13d | 1 | 0.85mi |
| 103 Alderson Ave Unit 1 Billings, MT | 2.0 | 1.0 | 1152 | $1,100 | $0.95 | 21d | 1 | 0.89mi |
| 103 Alderson Ave Billings, MT | 2.0 | 1.0 | 1152 | $1,100 | $0.95 | 13d | 1 | 0.89mi |
| 318 Yellowstone Ave Billings, MT | 2.0 | 1.0 | 1000 | $950 | $0.95 | 13d | 1 | 1.03mi |
| 2119 8th Ave N Apt 1 Billings, MT | 2.0 | 1.0 | 1000 | $1,300 | $1.30 | 13d | 1 | 1.12mi |
| 1019 N 24th St Billings, MT | 2.0 | 2.0 | 1538 | $2,200 | $1.43 | 13d | 1 | 1.26mi |
| 520 Avenue B Unit B Billings, MT | 2.0 | 1.0 | 936 | $1,195 | $1.28 | 13d | 1 | 1.40mi |
| 635 Cook Ave Billings, MT | 2.0 | 1.0 | 894 | $975 | $1.09 | 13d | 1 | 1.44mi |
| 1718 Virginia Ln Unit Near Hospitals: 2 Bedroom 2 Bath Billings, MT | 2.0 | 2.0 | 1502 | $1,699 | $1.13 | 21d | 1 | 1.46mi |
| 1718 Virginia Ln Unit 3 Billings, MT | 3.0 | 1.0 | 1502 | $1,650 | $1.10 | 13d | 1 | 1.46mi |
Listing history 23 events
-
2026-06-19days on market $100,000 Active 52 DOM
-
2026-06-18days on market $100,000 Active 51 DOM
-
2026-06-17days on market $100,000 Active 50 DOM
-
2026-06-16days on market $100,000 Active 49 DOM
-
2026-06-15days on market $100,000 Active 48 DOM
-
2026-06-14days on market $100,000 Active 46 DOM
-
2026-06-13days on market $100,000 Active 45 DOM
-
2026-06-10days on market $100,000 Active 43 DOM
-
2026-06-09days on market $100,000 Active 42 DOM
-
2026-06-08days on market $100,000 Active 41 DOM
-
2026-06-07days on market $100,000 Active 40 DOM
-
2026-06-05days on market $100,000 Active 37 DOM
-
2026-06-02days on market $100,000 Active 35 DOM
-
2026-06-01days on market $100,000 Active 34 DOM
-
2026-05-31days on market $100,000 Active 33 DOM
-
2026-05-30days on market $100,000 Active 32 DOM
-
2026-04-28$100,000 Active
-
2024-12-04soldstatus
-
2024-09-12status Active
-
2024-09-09historical Active Under Contract
-
2024-09-06price $100,000
-
2024-07-18price $150,000
-
2024-06-28$200,000 Active
ⓘ Source: listings_history table (triggers on properties + properties_extension) + one-shot
backfill from property_details.listing_events for pre-trigger history.
Tax reassessment forecast MT · Resets to sale price
- Current annual tax
- $1,570 · $131/mo
- Projected year-2 tax
- $1,570 · $131/mo
- Expected delta
- $0/yr ($0/mo · 0.0%)
ⓘ Screening estimate from a state-policy table — verify with the county assessor before closing.
Climate risk First Street
- Flood 1/10 Low FEMA zone X (unshaded) · 0% chance over 30 yrs
- Wildfire 2/10 Low
- Heat 3/10 Moderate 7 d/yr ≥95°F today · 15 d/yr by 30 yrs out
- Wind 1/10 Low
- Air quality 4/10 Moderate 3 unhealthy d/yr today · 5 by 30 yrs out
Nearby sold comps map
Loading sold comps map…
Walkable amenities ~0.75 mi
Loading nearby amenities…
Taxation est. · year 1
- Rental income
- $17,664
- − Mortgage interest
- −$5,602
- − Property taxes
- −$1,570
- − Insurance
- −$500
- − Repairs & maintenance
- −$1,413
- − Management
- −$1,413
- − Depreciation
- −$2,909
- Taxable income
- $4,257
- Est. tax owed @ 24.0%
- −$1,022
- After-tax cash flow
- $4,570/yr
For passive investors: Depreciation is non-cash, so a rental often shows a tax loss while cash-flowing — sheltering income. Rental losses are passive: they offset passive income freely, and up to $25,000/yr can offset ordinary (W-2) income if you actively participate and your MAGI is under $100k (phasing out to $0 by $150k); unused losses carry forward. On sale, claimed depreciation is recaptured at up to 25%, and gains may owe capital-gains tax (a 1031 exchange can defer both). Figures are a year-1 estimate at your 24.0% rate — not tax advice; consult a CPA.
Schools (NCES district)
- District
- Billings H S
- NCES district ID
- 3003900
- Math proficiency
- 29% ▼ -4.00%
- Reading proficiency
- 45% ▲ 2.00%
- Median HH income
- $49,863
- Composite
- 31.93/100
- National rank
- #5848
- State rank
- #69 of 116 in MT
Livability — Billings
- Score
- 80/100
- State rank
- #10
- US rank
- #1830
Category grades
Schools grade is shown separately in the Schools card above.
Census & demographics
- Census place
- Billings, MT
- County
- Yellowstone County · 159,426 people
- City population
- 147,124
- Metro
- Billings, MT
- Population (ZIP)
- 42,250
- Household income
- $58,598
- Rent vs Own
- Severe rent burden
- 1534.0
Population outlook (Yellowstone County) Hauer SSP2
- Today (2025)
- 176,227 people
- By 2030
- 185,619 · +5.3%
- By 2040
- 203,543 · +15.5%
- By 2050
- 221,100 · +25.5%
- By 2075
- 266,931 · +51.5%
- By 2100
- 301,141 · +70.9%
Race, ethnicity, and origin ACS 2023
- Neighborhood character
- Predominantly White (75%)
- Race & ethnicity
- White 75% Hispanic / Latino 9% Native American 9% Two or more races 8% Black 1%
- Hispanic origin (detail)
- Mexican 6%
- Common ancestry
- Portuguese 6% Italian 2% Lithuanian 2%
- Foreign-born
- 2% · Canada
- Languages at home
- 96% English-only · Spanish 1%
Political lean MEDSL · Yellowstone
- 2024 margin
- Strong R (+27.1) · D 34.9% · R 62.0% · Other 3.1%
- 2008→2024 swing
- -20.8pp toward R · 2008: -6.3pp · 2024: -27.1pp
- All cycles
- 2024: R+27.1 2020: R+24.0 2016: R+27.1 2012: R+20.6 2008: R+6.3
Not yet ingested
- Civics
- —
Market trends
- HPI YoY
- ▼ -191.74%
- Current HPI
- 201.7039
- Rent YoY
- ▲ 3.96%
- Metro
- Billings, MT
- State GDP YoY
- ▲ 3.41%
- F500 in state
- 2
Industry mix (Fortune 500 HQ in MT)
| Industry | F500 HQs | Revenue |
|---|---|---|
| Technology / Analytics | 1 | $2B |
|
||
Price history
-50.0% since first listed7 events — show timeline
- 2026-04-28 Listed $100,000 BMTMLS
- 2024-12-04 Sold (Public Records) — Public Records
- 2024-09-12 Relisted — BMTMLS
- 2024-09-09 Contingent — BMTMLS
- 2024-09-06 Price Changed $100,000 BMTMLS
- 2024-07-18 Price Changed $150,000 BMTMLS
- 2024-06-28 Listed $200,000 BMTMLS
Property tax history
+5.1%/yrLatest (2025): $1,570 · -22.8% YoY. Source: county tax records.
Cash-flow waterfall
monthlySold comps — $/sqft
last 12 mo · ≤1 miLoading sold comps…