2650 James Smith Ln · Tallahassee, FL
Flood risk 1/10 · Minimal
- FEMA flood zone
- X (unshaded)
- Chance of flooding over 30 yrs
- 0.0%
- Est. flood insurance / yr
- $507 – $1,088
Fire risk 3/10 · Minor
- Est. fire insurance / yr
- $947 – $1,759
Heat risk 8/10 · Major
- Hot days now (above 108°F)
- 7 days/yr
- Hot days in 30 yrs
- 20 days/yr
Wind risk 9/10 · Severe
- Chance of severe wind over 30 yrs
- 99.0%
Air-quality risk 5/10 · Moderate
- Unhealthy air days now
- 7 days/yr
- Unhealthy air days in 30 yrs
- 8 days/yr
Risk factors via First Street. Map © Google.
Why this score? — see what drove the C- grade
The composite is a weighted blend of 9 inputs, each scored 0–100. Each bar is that input's sub-score; the figure is the points it added to the 100-point composite (weight × sub-score).
- ARV discount +15.0/15.0
- Cash flow +11.8/30.0
- Rent growth +4.8/5.0
- Schools +4.3/10.0
- Livability +4.3/5.0
- 1% rule +4.0/10.0
- DSCR +3.5/10.0
- Condition / age +2.5/5.0
- Appreciation +0.0/10.0
$222,000
🖨 Deal sheet 📄 Offer letter ✓ Due diligence
Listing remarks
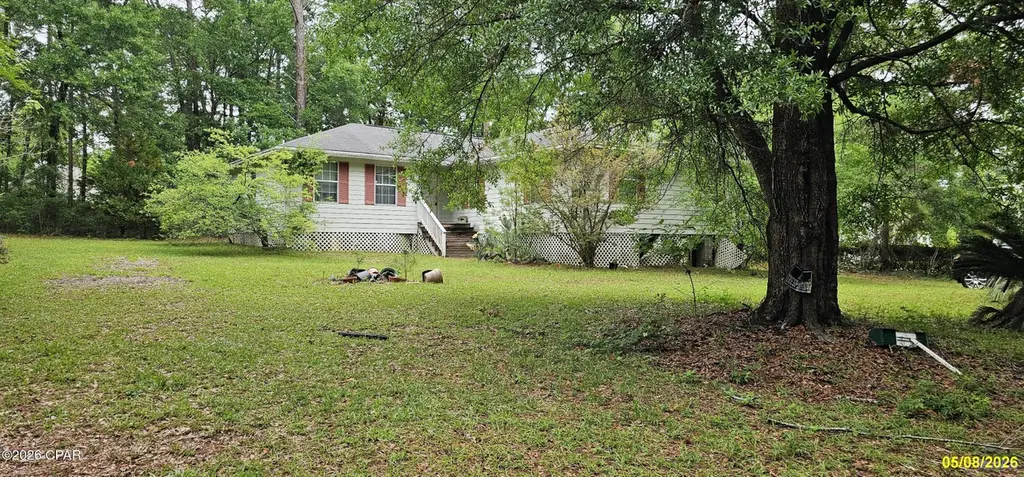
Location is everything, and this home has it all! Tucked away at the end of a quiet dead end street, this charming 4-bedroom, 2-bath Jim Waters home offers the perfect blend of comfort, convenience, and space. Built in 2004 with approximately 1,922 square feet, this home is ideal for a growing family and even includes a dedicated office space for those who work from home. Situated on a spacious 0.76-acre lot, you can enjoy peaceful country-style living while still being close to all the conveniences of city life. Located just minutes from Alfred B. Maclay Gardens State Park, the vibrant Market District, shopping, dining, and entertainment, this location is hard to beat. Enjoy having many of
Key facts
- 0.76 acre lot
- Built 2004
- Listed 20 days
Tags
Property features AI
Exterior
- Parking: Unpaved parking
- Utilities: Electricity available; Public sewer
- Home design: Single-story residence; Zoned for single-family residential
- Construction: Vinyl siding; Composition/shingle roof
- Exterior features: Lot approximately 0.76 acres; Lot dimensions about 248 x 133; Dirt road access; Short-term rentals allowed
Interior
- Kitchen: Kitchen included
- Bedrooms: Multiple bedrooms (four indicated)
- Bathrooms: 2 full bathrooms
- Heating & cooling: Central heating (electric); Central air; Ceiling fans
- Interior features: 9 total rooms; Office
- Laundry & utility: Laundry room; Electric water heater
Neighborhood map
What this means for you Summary
Snapshot
- This is a 3-bed/2.0-bath single-family listed at $222k.
Deal economics
- At list price, monthly cash flow is $-61 ($-734/yr) — negative.
- To cash-flow at today's rent, offer at most $211k (4.9% below list).
- To meet the 1% rule (rent ≥ 1% of price), the offer needs to be $200k (10.1% below list).
- Recommended offer: $200k (10.1% below list) — sets the bar for 1% rule.
- Cap rate 6.0% vs local median 4.2% in Tallahassee — top-decile yield for the area; either an underpriced asset or a hidden risk that comps aren't pricing in. Stress-test before assuming the spread holds.
Location & tenants
- Location reads 86/100 on livability (#19 in FL, #429 nationally) — a professional / high-income tenant draw. Strengths: amenities A+, commute A+, health & safety A+; Watch: employment D.
- Leon (urban): math 48% / reading 53% proficiency, ranked #33 of 73 in FL (top 45%) — acceptable for families but not a draw, mixed tenant base, ~2y average lease.
- Market conditions: Rents rising fast (+9.1%/yr); 107 active listings in the ZIP; 5 comparable units currently listed for rent nearby; rentals at typical pace (median 22d on market — plan ~3-4 weeks tenant-placement turnaround); high-income renter base; 1,765 units permitted in Leon County in 2024 (975 in 5+ unit buildings).
Forward outlook
- Local home prices are declining (-3.0%/yr); year-one equity from $2k of loan paydown is wiped out by about $7k of value loss. Plan a longer hold.
- Leon County population projected at +23% by 2050 — long-run rental-demand tailwind backs the buy-and-hold thesis.
Negotiation context
- It's been on market 20 days — a 2% lower offer ($219k) is reasonable based on typical stale-listing flexibility.
Risks & watch-outs
- Climate carrying-cost: severe wind risk, 99% chance of damaging wind over 30y; extreme-heat days projected 7→20/yr by 2055 (HVAC capex compounding) — expect insurance premiums to compound above CPI over the hold.
Questions for the listing agent
- What do current leases actually rent for vs. the listed asking? Can we see a recent rent roll and the last 12 months of T-12 income?
- Is there a deadline driving the sale (1031 exchange, divorce, estate, relocation)? That informs how much negotiation room exists.
- Schools are B-rated — typically a magnet for longer-tenancy family renters. What's the average tenant stay here, and is there a school-zone premium baked into asking?
- What's the average days-on-market for RENTAL listings here right now (not sales)? A rising rental-DOM trend means longer vacancies and softer asking-rent achievability than the comps imply.
- What's the recent tenant-quality profile in this submarket — average credit score on applications, eviction rate, late-payment / NSF rate, and stable-employment percentage? A property-management company in the area should have these aggregated.
- How much new for-sale + rental construction is in the pipeline within 1–3 miles? Heavy new supply typically softens prices + rents 12–24 months out; constrained supply supports both.
Investment metrics
- 1% rule
- 0.90% ✗
- Cap rate
- 5.96%
- Cash-on-cash
- -1.18%
- DSCR
- 0.95
- GRM
- 9.3
CMA / ARV
- ARV (on-the-fly)
- $401,952
- Comps found
- 12
Show comp detail 12 sales within ~0.75 mi
| Address | Dist | Beds/Ba | Sqft | Sold | Price | $/sf | Match |
|---|---|---|---|---|---|---|---|
| 4145 Yardley Cir | 0.27mi | 3/2.0 | 1,900 (+0%) | 2mo | $411,400 | $217 | 86 |
| 3799 Forsythe Way | 0.32mi | 3/2.0 | 1,800 (-5%) | 3mo | $400,000 | $222 | 74 |
| 3046 Banks Rd | 0.67mi | 3/2.0 | 1,905 (+0%) | 3mo | $336,000 | $176 | 66 |
| 3020 Barclay Ct | 0.36mi | 3/2.0 | 2,112 (+11%) | 1mo | $385,000 | $182 | 64 |
| 3716 Suffolk Dr | 0.60mi | 3/2.0 | 1,783 (-6%) | 1mo | $422,300 | $237 | 62 |
| 2492 Elfinwing Ln | 0.34mi | 2/2.0 (-1) | 2,146 (+13%) | 2mo | $526,500 | $245 | 56 |
| 3640 Barbary Dr | 0.62mi | 3/2.0 | 1,744 (-8%) | 3mo | $330,000 | $189 | 56 |
| 3915 Royal Oaks Dr | 0.41mi | 4/2.0 (+1) | 2,100 (+11%) | 3mo | $425,000 | $202 | 55 |
| 2319 Lake Hall Rd | 0.34mi | 3/3.0 | 2,170 (+14%) | 4mo | $495,000 | $228 | 53 |
| 3806 Leane Dr | 0.54mi | 4/2.5 (+1) | 2,030 (+7%) | 4mo | $430,000 | $212 | 53 |
| 3710 Anthony Dr | 0.60mi | 4/2.0 (+1) | 2,075 (+9%) | 2mo | $385,000 | $186 | 50 |
| 3661 Barbary Dr | 0.56mi | 4/2.5 (+1) | 2,080 (+10%) | 1mo | $415,500 | $200 | 50 |
Match score weights: distance 35% · size 25% · config 20% · recency 20%. Top-matched comps best support the ARV.
Projected returns pro-forma
-3.0% appreciation · 8.0% rent growth · sell at horizon
- IRR
- -12.4%
- Equity multiple
- 0.53×
- Total profit
- $-29,227
- Equity at exit
- $33,101
- IRR
- 3.2%
- Equity multiple
- 1.29×
- Total profit
- $17,918
- Equity at exit
- $19,195
Cash invested: $62,160 (down + closing). Projections, not guarantees.
Landlord ↔ Tenant lean methodology
- Overall (STATE)
- 87 Strongly Landlord-Friendly
- State Florida
- 87 Strongly Landlord-Friendly · R+3
- County
- — inherits STATE
- City
- — inherits STATE
ZIP-level market 32309
- Rents YoY
- 9.1%
- Active inventory
- 107
- Price-to-rent
- 9.3×
Monthly cashflow live
- Estimated rent
- $1,996 high interval (Pro) →
- Mortgage (P&I)
- −$1,164
- Tax from tax record
- −$381 /mo · $4,572/yr
- Insurance
- −$92
- HOA
- −$0
- Vacancy / Maint / Mgmt
- −$419
- Net cashflow
- $-61
Break-even live
UW: 25.0% down · 7.5% · 30yr · 1.5% tax · 5.0% vac · 8.0% maint · 8.0% mgmt
Financing live
Cash to close
- Down payment
- $55,500
- Closing costs
- $6,660
- Reserves months
- —
- Total cash needed
- —
Loan-product check · same deal, 3 products live
Conventional
25% down · 7.5% · 30yr
- Down + closing
- —
- Monthly P&I
- —
- Monthly cashflow
- —
- DSCR
- —
- Eligible?
- —
Personal DTI + credit; lowest rate.
DSCR
20% down · 8.5% · 30yr
- Down + closing
- —
- Monthly P&I
- —
- Monthly cashflow
- —
- DSCR
- —
- Eligible?
- —
No personal income docs; deal must DSCR.
Hard money
10% down · 12.0% · 12mo
- Down + closing
- —
- Monthly P&I
- —
- Monthly cashflow
- —
- DSCR
- —
- Eligible?
- —
Short-term bridge; refi at stabilization.
Rent comps 5 comps
| Address | Beds | Baths | Sqft | Rent | $/sqft | DOM | Units | Dist |
|---|---|---|---|---|---|---|---|---|
| 3740 Donovan Dr Unit B Tallahassee, FL | 2.0 | 2.5 | 1252 | $1,550 | $1.24 | 14d | 1 | 0.77mi |
| 5326 Saint Ives Ln Tallahassee, FL | 4.0 | 2.0 | 1750 | $2,495 | $1.43 | 14d | 1 | 0.96mi |
| 4475 Bayshore Cir Tallahassee, FL | 3.0 | 2.0 | 1394 | $1,800 | $1.29 | 21d | 1 | 0.98mi |
| 4102 Tam O Shanter Tallahassee, FL | 3.0 | 2.0 | 1781 | $2,300 | $1.29 | 21d | 1 | 1.06mi |
| 2522 Manassas Way Tallahassee, FL | 4.0 | 2.0 | 1900 | $2,500 | $1.32 | 21d | 1 | 1.33mi |
Listing history 16 events
-
2026-06-18days on market $222,000 Active 20 DOM
-
2026-06-17days on market $222,000 Active 19 DOM
-
2026-06-16days on market $222,000 Active 18 DOM
-
2026-06-15days on market $222,000 Active 17 DOM
-
2026-06-14days on market $222,000 Active 15 DOM
-
2026-06-10days on market $222,000 Active 12 DOM
-
2026-06-09days on market $222,000 Active 11 DOM
-
2026-06-08days on market $222,000 Active 10 DOM
-
2026-06-07days on market $222,000 Active 9 DOM
-
2026-06-05days on market $222,000 Active 6 DOM
-
2026-06-03days on market $222,000 Active 5 DOM
-
2026-06-02days on market $222,000 Active 4 DOM
-
2026-06-01days on market $222,000 Active 3 DOM
-
2026-05-31days on market $222,000 Active 2 DOM
-
2026-05-30remarks 699-char remark
-
2026-05-30$222,000 Active 1 DOM
ⓘ Source: listings_history table (triggers on properties + properties_extension) + one-shot
backfill from property_details.listing_events for pre-trigger history.
Tax reassessment forecast FL · Resets to sale price
- Current annual tax
- $4,572 · $381/mo
- Projected year-2 tax
- $4,572 · $381/mo
- Expected delta
- $0/yr ($0/mo · 0.0%)
ⓘ Screening estimate from a state-policy table — verify with the county assessor before closing.
Climate risk First Street
- Flood 1/10 Low FEMA zone X (unshaded) · 0% chance over 30 yrs
- Wildfire 3/10 Moderate
- Heat 8/10 Severe 7 d/yr ≥108°F today · 20 d/yr by 30 yrs out
- Wind 9/10 Extreme 99% chance of damaging wind over 30 yrs
- Air quality 5/10 Major 7 unhealthy d/yr today · 8 by 30 yrs out
Nearby sold comps map
Loading sold comps map…
Walkable amenities ~0.75 mi
Loading nearby amenities…
Taxation est. · year 1
- Rental income
- $23,948
- − Mortgage interest
- −$12,435
- − Property taxes
- −$4,572
- − Insurance
- −$1,110
- − Repairs & maintenance
- −$1,916
- − Management
- −$1,916
- − Depreciation
- −$6,458
- Taxable loss
- −$4,460
- Est. tax savings @ 24.0%
- +$1,070
- After-tax cash flow
- $337/yr
For passive investors: Depreciation is non-cash, so a rental often shows a tax loss while cash-flowing — sheltering income. Rental losses are passive: they offset passive income freely, and up to $25,000/yr can offset ordinary (W-2) income if you actively participate and your MAGI is under $100k (phasing out to $0 by $150k); unused losses carry forward. On sale, claimed depreciation is recaptured at up to 25%, and gains may owe capital-gains tax (a 1031 exchange can defer both). Figures are a year-1 estimate at your 24.0% rate — not tax advice; consult a CPA.
Schools (NCES district)
- District
- Leon
- NCES district ID
- 1201110
- Math proficiency
- 48% ▼ -13.00%
- Reading proficiency
- 53% ▼ -5.00%
- Median HH income
- $46,339
- Composite
- 42.84/100
- National rank
- #3131
- State rank
- #33 of 73 in FL
Livability — Tallahassee
- Score
- 86/100
- State rank
- #19
- US rank
- #429
Category grades
Schools grade is shown separately in the Schools card above.
Census & demographics
- Census place
- Tallahassee, FL
- County
- Leon County · 294,472 people
- City population
- 294,472
- Metro
- Tallahassee, FL
- Population (ZIP)
- 33,544
- Household income
- $113,412
- Rent vs Own
- Severe rent burden
- 789.0
Population outlook (Leon County) Hauer SSP2
- Today (2025)
- 315,507 people
- By 2030
- 330,677 · +4.8%
- By 2040
- 358,465 · +13.6%
- By 2050
- 386,804 · +22.6%
- By 2075
- 465,480 · +47.5%
- By 2100
- 519,959 · +64.8%
Race, ethnicity, and origin ACS 2023
- Neighborhood character
- Predominantly White (75%)
- Race & ethnicity
- White 75% Black 9% Two or more races 9% Hispanic / Latino 8% Asian 3%
- Hispanic origin (detail)
- Mexican 2% Cuban 3%
- Common ancestry
- Slovak 4% Lithuanian 3% Italian 3%
- Foreign-born
- 7% · Canada, South Korea
- Languages at home
- 92% English-only · Spanish 3% Russian/Polish/Slavic 1% Other Asian/Pacific 1%
Political lean MEDSL · Leon
- 2024 margin
- Strong D (+21.8) · D 60.3% · R 38.5% · Other 1.2%
- 2008→2024 swing
- -2.5pp toward R · 2008: 24.3pp · 2024: 21.8pp
- All cycles
- 2024: D+21.8 2020: D+28.3 2016: D+25.1 2012: D+23.6 2008: D+24.3
Not yet ingested
- Civics
- —
Market trends
- HPI YoY
- ▼ -212.85%
- Current HPI
- 247.4336
- Rent YoY
- ▲ 9.06%
- Metro
- Tallahassee, FL
- State GDP YoY
- ▲ 3.28%
- F500 in state
- 36
Industry mix (Fortune 500 HQ in FL)
| Industry | F500 HQs | Revenue |
|---|---|---|
| Industrial Technology | 2 | $29B |
|
||
| Insurance | 2 | $17B |
|
||
| Retail | 1 | $60B |
|
||
| Technology Distribution | 1 | $58B |
|
||
| Homebuilding | 1 | $35B |
|
||
| Technology Manufacturing | 1 | $35B |
|
||
Price history
1 event — show timeline
- 2026-05-27 Listed $222,000 CPARMLS
Property tax history
+7.7%/yrLatest (2025): $4,572 · +2.9% YoY. Source: county tax records.
Cash-flow waterfall
monthlySold comps — $/sqft
last 12 mo · ≤1 miLoading sold comps…