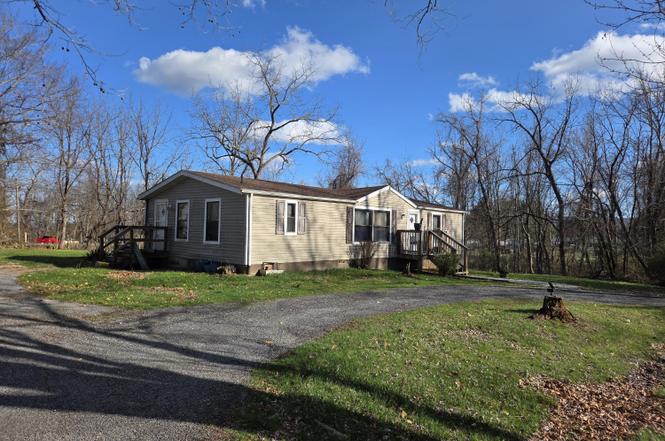
3724 Robinson Tract Rd · Pulaski, VA
Flood risk No data
- FEMA flood zone
- —
- Chance of flooding over 30 yrs
- %
- Est. flood insurance / yr
- —
Fire risk No data
- Est. fire insurance / yr
- —
Heat risk No data
- Hot days now (above °F)
- days/yr
- Hot days in 30 yrs
- days/yr
Wind risk No data
- Chance of severe wind over 30 yrs
- %
Air-quality risk No data
- Unhealthy air days now
- days/yr
- Unhealthy air days in 30 yrs
- days/yr
Risk factors via First Street. Map © Google.
Why this score? — see what drove the B grade
The composite is a weighted blend of 9 inputs, each scored 0–100. Each bar is that input's sub-score; the figure is the points it added to the 100-point composite (weight × sub-score).
- Cash flow +30.0/30.0
- 1% rule +10.0/10.0
- DSCR +10.0/10.0
- ARV discount +7.5/15.0
- Schools +4.6/10.0
- Livability +3.4/5.0
- Rent growth +2.5/5.0
- Condition / age +2.5/5.0
- Appreciation +0.0/10.0
$62,000
🖨 Deal sheet (PDF) 📄 Offer letter ✓ Due diligence
Listing remarks
Appointment ONLY, NO DRIVE BY TO WALK PROPERTY!! 3BR/2BA manufactured home offering great potential for investors or buyers looking to make it their own. This property could remain a rental or become a comfortable residence. Needs some TLC. Nice large yard, semi-circle driveway. Don't miss this opportunity to invest or create your ideal space. Property is being sold ''AS IS, WHERE IS. ''
Key facts
- Listed 10 days
Neighborhood map
What this means for you Summary
Snapshot
- This is a 3-bed/2.0-bath mobile listed at $62k.
Deal economics
- At list price, monthly cash flow is $501 ($6k/yr) — positive.
- The deal already cash-flows at list — no discount required.
- Meets the 1% rule at list price ($1k rent vs $62k).
- Cap rate 16.0% vs local median 5.5% in Pulaski — top-decile yield for the area; either an underpriced asset or a hidden risk that comps aren't pricing in. Stress-test before assuming the spread holds.
Location & tenants
- Location reads 67/100 on livability (#297 in VA) — a middle-class / working-renter tenant base. Strengths: cost of living A+, housing A+, health & safety A+; Watch: employment D+, crime F, amenities F.
- Pulaski County Public School District (rural): math 48% / reading 61% proficiency, ranked #86 of 131 in VA (top 66%) — acceptable for families but not a draw, mixed tenant base, ~2y average lease.
- Market conditions: 114 active listings in the ZIP; 39 units permitted in Pulaski County in 2024 (0 in 5+ unit buildings).
Forward outlook
- Local home prices are declining (-3.0%/yr); year-one equity from $429 of loan paydown is wiped out by about $2k of value loss. Plan a longer hold.
- Pulaski County population projected at -19% by 2050 — secular population decline; favor cash flow + early exit over multi-decade hold.
- At projected returns (-3.0% appreciation + 3.0% rent growth), your $17k cash investment doubles in ~4 years — after that, you're playing with house money.
Negotiation context
- Only 11 days on market — expect competitive offers; lowballing is unlikely to land.
Questions for the listing agent
- Is there a deadline driving the sale (1031 exchange, divorce, estate, relocation)? That informs how much negotiation room exists.
- Schools are B-rated — typically a magnet for longer-tenancy family renters. What's the average tenant stay here, and is there a school-zone premium baked into asking?
- Crime grade is F in this area — have there been break-ins, vandalism, or insurance claims at this property in the last 3 years? What carrier currently insures it and at what premium?
- What's the average days-on-market for RENTAL listings here right now (not sales)? A rising rental-DOM trend means longer vacancies and softer asking-rent achievability than the comps imply.
- What's the recent tenant-quality profile in this submarket — average credit score on applications, eviction rate, late-payment / NSF rate, and stable-employment percentage? A property-management company in the area should have these aggregated.
- How much new for-sale + rental construction is in the pipeline within 1–3 miles? Heavy new supply typically softens prices + rents 12–24 months out; constrained supply supports both.
Investment metrics
- 1% rule
- 1.90% ✓
- Cap rate
- 15.99%
- Cash-on-cash
- 34.65%
- DSCR
- 2.54
- GRM
- 4.4
CMA / ARV
No comps found within radius.
Projected returns pro-forma
-3.0% appreciation · 3.0% rent growth · sell at horizon
- IRR
- 30.1%
- Equity multiple
- 2.26×
- Total profit
- $21,893
- Equity at exit
- $9,244
- IRR
- 37.4%
- Equity multiple
- 4.47×
- Total profit
- $60,241
- Equity at exit
- $5,361
Cash invested: $17,360 (down + closing). Projections, not guarantees.
Landlord ↔ Tenant lean methodology
- Overall (STATE)
- 55 Moderately Landlord-Leaning
- State Virginia
- 55 Moderately Landlord-Leaning · D+2
- County
- — inherits STATE
- City
- — inherits STATE
ZIP-level market 24301
- Active inventory
- 114
- Price-to-rent
- 4.4×
Monthly cashflow live
- Estimated rent
- $1,177 medium interval (Pro) →
- Mortgage (P&I)
- −$325
- Tax est. 1.5%
- −$78 /mo · $930/yr
- Insurance
- −$26
- HOA
- −$0
- Vacancy / Maint / Mgmt
- −$247
- Net cashflow
- $501
Break-even live
Sensitivity live
| Price | -10% $544 | -5% $523 | +0% $501 | +5% $480 | +10% $458 |
|---|---|---|---|---|---|
| Rent | -10% $408 | -5% $455 | +0% $501 | +5% $548 | +10% $594 |
| Rate | -1.0pp $532 | -0.5pp $517 | base $501 | +0.5pp $485 | +1.0pp $469 |
UW: 25.0% down · 7.5% · 30yr · 1.5% tax · 5.0% vac · 8.0% maint · 8.0% mgmt
Financing live
Cash to close
- Down payment
- $15,500
- Closing costs
- $1,860
- Reserves months
- —
- Total cash needed
- —
Loan-product check · same deal, 3 products live
Conventional
25% down · 7.5% · 30yr
- Down + closing
- —
- Monthly P&I
- —
- Monthly cashflow
- —
- DSCR
- —
- Eligible?
- —
Personal DTI + credit; lowest rate.
DSCR
20% down · 8.5% · 30yr
- Down + closing
- —
- Monthly P&I
- —
- Monthly cashflow
- —
- DSCR
- —
- Eligible?
- —
No personal income docs; deal must DSCR.
Hard money
10% down · 12.0% · 12mo
- Down + closing
- —
- Monthly P&I
- —
- Monthly cashflow
- —
- DSCR
- —
- Eligible?
- —
Short-term bridge; refi at stabilization.
Listing history 3 events
-
2026-06-19days on market $62,000 Active 11 DOM
-
2026-06-18remarks 391-char remark
-
2026-06-18$62,000 Active 10 DOM
ⓘ Source: listings_history table (triggers on properties + properties_extension) + one-shot
backfill from property_details.listing_events for pre-trigger history.
Nearby sold comps map
Loading sold comps map…
Walkable amenities ~0.75 mi
Loading nearby amenities…
Taxation est. · year 1
- Rental income
- $14,122
- − Mortgage interest
- −$3,473
- − Property taxes
- −$930
- − Insurance
- −$310
- − Repairs & maintenance
- −$1,130
- − Management
- −$1,130
- − Depreciation
- −$1,804
- Taxable income
- $5,346
- Est. tax owed @ 24.0%
- −$1,283
- After-tax cash flow
- $4,732/yr
For passive investors: Depreciation is non-cash, so a rental often shows a tax loss while cash-flowing — sheltering income. Rental losses are passive: they offset passive income freely, and up to $25,000/yr can offset ordinary (W-2) income if you actively participate and your MAGI is under $100k (phasing out to $0 by $150k); unused losses carry forward. On sale, claimed depreciation is recaptured at up to 25%, and gains may owe capital-gains tax (a 1031 exchange can defer both). Figures are a year-1 estimate at your 24.0% rate — not tax advice; consult a CPA.
Schools (NCES district)
- District
- Pulaski County Public School District
- NCES district ID
- 5103150
- Math proficiency
- 48% ▼ -31.00%
- Reading proficiency
- 61% ▼ -13.00%
- Median HH income
- $44,912
- Composite
- 45.98/100
- National rank
- #2537
- State rank
- #86 of 131 in VA
Livability — Pulaski
- Score
- 67/100
- State rank
- #297
- US rank
- #10639
Category grades
Schools grade is shown separately in the Schools card above.
Census & demographics
- Population (ZIP)
- 13,370
Population outlook (Pulaski County) Hauer SSP2
- Today (2025)
- 32,949 people
- By 2030
- 31,812 · -3.5%
- By 2040
- 29,224 · -11.3%
- By 2050
- 26,691 · -19.0%
- By 2075
- 21,312 · -35.3%
- By 2100
- 15,697 · -52.4%
Race, ethnicity, and origin ACS 2023
- Neighborhood character
- Predominantly White (89%)
- Race & ethnicity
- White 89% Two or more races 5% Black 4% Hispanic / Latino 3%
- Common ancestry
- Serbian 2% Italian 2% Iranian 1%
- Foreign-born
- 2% · Vietnam, Canada
- Languages at home
- 97% English-only · Spanish 1%
Political lean MEDSL · Pulaski
- 2024 margin
- Solid R (+44.7) · D 27.3% · R 72.0%
- 2008→2024 swing
- -25.1pp toward R · 2008: -19.5pp · 2024: -44.7pp
- All cycles
- 2024: R+44.7 2020: R+41.5 2016: R+40.7 2012: R+24.8 2008: R+19.5
Not yet ingested
- Civics
- —
Market trends
- HPI YoY
- ▼ -88.98%
- Current HPI
- 144.6556
- Rent YoY
- —
- Metro
- —
- State GDP YoY
- ▲ 2.40%
- F500 in state
- 50
Industry mix (Fortune 500 HQ in VA)
| Industry | F500 HQs | Revenue |
|---|---|---|
| Aerospace / Defense | 4 | $236B |
|
||
| Technology / Defense | 3 | $32B |
|
||
| Financial Services | 2 | $176B |
|
||
| Utilities | 2 | $27B |
|
||
| Insurance | 2 | $25B |
|
||
| Technology | 2 | $15B |
|
||
Cash-flow waterfall
monthlySold comps — $/sqft
last 12 mo · ≤1 miLoading sold comps…