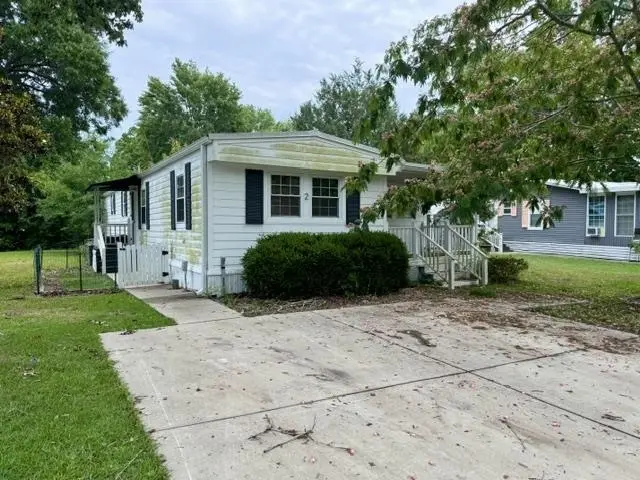
2 Dover St · Murrells Inlet, SC
Flood risk 1/10 · Minimal
- FEMA flood zone
- X (unshaded)
- Chance of flooding over 30 yrs
- 0.0%
- Est. flood insurance / yr
- $507 – $1,088
Fire risk 4/10 · Minor
- Est. fire insurance / yr
- $783 – $1,453
Heat risk 9/10 · Severe
- Hot days now (above 106°F)
- 7 days/yr
- Hot days in 30 yrs
- 18 days/yr
Wind risk 9/10 · Severe
- Chance of severe wind over 30 yrs
- 99.0%
Air-quality risk 2/10 · Minimal
- Unhealthy air days now
- 0 days/yr
- Unhealthy air days in 30 yrs
- 1 days/yr
Risk factors via First Street. Map © Google.
Why this score? — see what drove the D+ grade
The composite is a weighted blend of 9 inputs, each scored 0–100. Each bar is that input's sub-score; the figure is the points it added to the 100-point composite (weight × sub-score).
- Cash flow +15.0/30.0
- ARV discount +7.5/15.0
- 1% rule +5.0/10.0
- DSCR +5.0/10.0
- Livability +3.8/5.0
- Rent growth +3.7/5.0
- Schools +2.7/10.0
- Condition / age +2.5/5.0
- Appreciation +0.0/10.0
$29,900
🖨 Deal sheet 📄 Offer letter ✓ Due diligence
Listing remarks MLS
2 BR 2 BA manufactured home in Captain's Cove MHP, a quiet community for folks 55 & older, located in Murrells Inlet, SC, approx. 15 miles south of Myrtle Beach. Community has a clubhouse & pool, and lots of activities for residents who wish to participate. Near Murrells Inlet's famous water front restaurants & close to Huntington Beach (Oceanfront) State Park & to beautiful Brookgreen Gardens. Also near lots of golf courses & many other types of entertainment. Only minutes from a modern hospital & doctors' offices. This is an attractive, well cared for home. It has a bed rm and bath at each end allowing for privacy when you have guests. Home has been upgraded with lifetime, (concrete composite) Hardee Plank siding all around, won't rot and is impervious to termites. A new metal roof has been installed, and an added on 10 x 19 sun porch w/ windows all around and a rubber roof. Kitchen has been remodeled and thermo-pane windows installed thru-out home. Electrical service updated with a 200 amp box and new breakers. Has had many other improvements, too much to name. You may call for a complete list. Home has a covered front and rear entry, a beautiful 2 tier deck in back with a water fountain, an outside shower, and a large o/s storage bldg. This is a sound, clean home. You'll love the home and the location, call today for an appointment to see.
Key facts
- Outdoor pool
- Screened in porch
- Clubhouse
Tags
Property features AI
Finance
- Other: Property is for sale
- Financial info: Has monthly land lease ($870/month)
- HOA & community: Monthly association fee; Clubhouse; Community pool; Recreation area; Senior community
Exterior
- Parking: Driveway; 2 parking spaces
- Utilities: Public water; Sewer available; Electricity available; Cable available; Phone available
- Home design: Single wide mobile home; Resale condition
- Construction: Crawlspace foundation
- Exterior features: Porch (screened); Second garage; Crawlspace foundation; Rectangular lot
Interior
- Kitchen: Dishwasher; Garbage disposal; Microwave; Range; Refrigerator; Stainless steel appliances; Solid surface counters
- Bedrooms: Main-level primary bedroom
- Flooring: Carpet; Laminate
- Bathrooms: 2 full bathrooms; Tub with shower
- Heating & cooling: Electric forced-air heating
- Interior features: Ceiling fans; Linen closet; Split bedroom layout; Solid surface counters; Stainless steel appliances; Window treatments; Unfurnished
- Laundry & utility: Washer hookup; Washer; Dryer; Utility room
Neighborhood map
What this means for you Summary
Snapshot
- This is a 2-bed/2.0-bath manufactured listed at $30k.
Deal economics
- At list price, monthly cash flow is $1k ($14k/yr) — positive.
- The deal already cash-flows at list — no discount required.
- Meets the 1% rule at list price ($2k rent vs $30k).
- Recommended offer: $29k (1.5% below list) — sets the bar for market timing.
- Cap rate 53.7% vs local median 2.2% in Murrells Inlet — top-decile yield for the area; either an underpriced asset or a hidden risk that comps aren't pricing in. Stress-test before assuming the spread holds.
Location & tenants
- Location reads 76/100 on livability (#25 in SC, #3,720 nationally) — a middle-class / working-renter tenant base. Strengths: crime A+, housing A+, health & safety A+; Watch: amenities F, commute F.
- Georgetown 01 (town): math 26% / reading 38% proficiency, ranked #51 of 80 in SC (top 64%) — families likely to look elsewhere, expect single-tenant / working-renter base with shorter leases.
- Market conditions: Rents rising fast (+4.7%/yr); 287 active listings in the ZIP; 6 comparable units currently listed for rent nearby; rentals at typical pace (median 24d on market — plan ~3-4 weeks tenant-placement turnaround); 323 units permitted in Georgetown County in 2024 (0 in 5+ unit buildings).
Forward outlook
- Local home prices are declining (-3.0%/yr); year-one equity from $207 of loan paydown is wiped out by about $897 of value loss. Plan a longer hold.
- At projected returns (-3.0% appreciation + 4.7% rent growth), your $8k cash investment doubles in ~1 year — after that, you're playing with house money.
Negotiation context
- It's been on market 20 days — a 2% lower offer ($29k) is reasonable based on typical stale-listing flexibility.
- 4 sale attempts since 23y ago with the ask held roughly flat each time — persistent listings suggest the price (not the market) is what's stuck; bring a comps-based counter.
Risks & watch-outs
- Climate carrying-cost: severe wind risk, 99% chance of damaging wind over 30y; extreme-heat days projected 7→18/yr by 2055 (HVAC capex compounding) — expect insurance premiums to compound above CPI over the hold.
Questions for the listing agent
- Is there a deadline driving the sale (1031 exchange, divorce, estate, relocation)? That informs how much negotiation room exists.
- Schools are A-rated — typically a magnet for longer-tenancy family renters. What's the average tenant stay here, and is there a school-zone premium baked into asking?
- The area grade is low — what's the realistic commute time and amenity access for the typical tenant pool here? Any planned neighborhood developments (good or bad) we should know about?
- What's the average days-on-market for RENTAL listings here right now (not sales)? A rising rental-DOM trend means longer vacancies and softer asking-rent achievability than the comps imply.
- What's the recent tenant-quality profile in this submarket — average credit score on applications, eviction rate, late-payment / NSF rate, and stable-employment percentage? A property-management company in the area should have these aggregated.
- How much new for-sale + rental construction is in the pipeline within 1–3 miles? Heavy new supply typically softens prices + rents 12–24 months out; constrained supply supports both.
Investment metrics
- 1% rule
- 5.88% ✓
- Cap rate
- 53.74%
- Cash-on-cash
- 169.47%
- DSCR
- 8.54
- GRM
- 1.4
CMA / ARV
- ARV (on-the-fly)
- $70,752
- Comps found
- 12
Show comp detail 12 sales within ~0.75 mi
| Address | Dist | Beds/Ba | Sqft | Sold | Price | $/sf | Match |
|---|---|---|---|---|---|---|---|
| 29 Oceanside Landing Crooked Island Cir | 0.07mi | 3/2.0 (+1) | 1,064 (+1%) | 4mo | $58,500 | $55 | 87 |
| 67 Crooked Island Cir | 0.14mi | 2/2.0 | 1,100 (+4%) | 0mo | $45,000 | $41 | 86 |
| 53 Crooked Island Cir | 0.09mi | 3/2.0 (+1) | 1,000 (-5%) | 0mo | $67,000 | $67 | 82 |
| 91 Crooked Island Cir | 0.15mi | 2/2.0 | 1,120 (+6%) | 4mo | $11,500 | $10 | 79 |
| 11 Dover St | 0.07mi | 3/1.0 (+1) | 980 (-7%) | 2mo | $28,000 | $29 | 74 |
| 54 Crooked Island Cir | 0.08mi | 3/2.0 (+1) | 920 (-13%) | 1mo | $65,000 | $71 | 69 |
| 10 Acorn Ct | 0.40mi | 2/2.0 | 1,130 (+7%) | 8mo | $75,000 | $66 | 63 |
| 135 Crooked Island Cir | 0.21mi | 2/2.0 | 1,203 (+14%) | 10mo | $50,000 | $42 | 58 |
| 1021 S Marlin St | 0.39mi | 2/2.0 | 920 (-13%) | 4mo | $218,000 | $237 | 58 |
| 176 Burr Cir | 0.52mi | 2/2.0 | 980 (-7%) | 14mo | $72,000 | $73 | 52 |
| 103 Village Ct | 0.44mi | 3/2.0 (+1) | 1,194 (+13%) | 9mo | $92,000 | $77 | 45 |
| 857 S Marlin Cir | 0.38mi | 3/2.0 (+1) | 1,210 (+15%) | 14mo | $258,500 | $214 | 41 |
Match score weights: distance 35% · size 25% · config 20% · recency 20%. Top-matched comps best support the ARV.
Projected returns pro-forma
-3.0% appreciation · 4.66% rent growth · sell at horizon
- IRR
- —
- Equity multiple
- 9.78×
- Total profit
- $73,469
- Equity at exit
- $4,458
- IRR
- —
- Equity multiple
- 21.75×
- Total profit
- $173,719
- Equity at exit
- $2,585
Cash invested: $8,372 (down + closing). Projections, not guarantees.
Landlord ↔ Tenant lean methodology
- Overall (STATE)
- 90 Strongly Landlord-Friendly
- State South Carolina
- 90 Strongly Landlord-Friendly · R+6
- County
- — inherits STATE
- City
- — inherits STATE
ZIP-level market 29576
- Home prices YoY
- -18.8%
- Rents YoY
- 4.7%
- Active inventory
- 287
- Price-to-rent
- 1.4×
Monthly cashflow live
- Estimated rent
- $1,758 high interval (Pro) →
- Mortgage (P&I)
- −$157
- Tax est. 1.5%
- −$37 /mo · $448/yr
- Insurance
- −$12
- HOA
- −$0
- Vacancy / Maint / Mgmt
- −$369
- Net cashflow
- $1,182
Break-even live
UW: 25.0% down · 7.5% · 30yr · 1.5% tax · 5.0% vac · 8.0% maint · 8.0% mgmt
Financing live
Cash to close
- Down payment
- $7,475
- Closing costs
- $897
- Reserves months
- —
- Total cash needed
- —
Loan-product check · same deal, 3 products live
Conventional
25% down · 7.5% · 30yr
- Down + closing
- —
- Monthly P&I
- —
- Monthly cashflow
- —
- DSCR
- —
- Eligible?
- —
Personal DTI + credit; lowest rate.
DSCR
20% down · 8.5% · 30yr
- Down + closing
- —
- Monthly P&I
- —
- Monthly cashflow
- —
- DSCR
- —
- Eligible?
- —
No personal income docs; deal must DSCR.
Hard money
10% down · 12.0% · 12mo
- Down + closing
- —
- Monthly P&I
- —
- Monthly cashflow
- —
- DSCR
- —
- Eligible?
- —
Short-term bridge; refi at stabilization.
Rent comps 6 comps
| Address | Beds | Baths | Sqft | Rent | $/sqft | DOM | Units | Dist |
|---|---|---|---|---|---|---|---|---|
| 4996 Highway 17 Business Murrells Inlet, SC | 2.0 | 2.0 | 925 | $1,500 | $1.62 | 14d | 1 | 0.50mi |
| 13 Muddy Bay Dr Murrells Inlet, SC | 2.0–3.0 | 2.0 | 1095 | $1,801 | $1.64 | 14d | 13 | 0.79mi |
| 50 Turning Stone Boulelvard Murrells Inlet, SC | 3.0 | 2.0 | 1350 | $1,750 | $1.30 | 23d | 1 | 0.87mi |
| 66 Turning Stone Boulelvard Unit 1 Murrells Inlet, SC | 3.0 | 2.0 | 1350 | $1,595 | $1.18 | 23d | 1 | 0.88mi |
| 66 Turning Stone Blvd Murrells Inlet, SC | 3.0 | 2.0 | 1450 | $1,700 | $1.17 | 23d | 1 | 0.90mi |
| 4323 Lotus Ct Unit F Murrells Inlet, SC | 3.0 | 2.0 | 1319 | $1,750 | $1.33 | 23d | 1 | 1.31mi |
Listing history 15 events
-
2026-06-18days on market $29,900 Active 20 DOM
-
2026-06-17days on market $29,900 Active 19 DOM
-
2026-06-16days on market $29,900 Active 18 DOM
-
2026-06-15days on market $29,900 Active 17 DOM
-
2026-06-14days on market $29,900 Active 15 DOM
-
2026-06-10days on market $29,900 Active 12 DOM
-
2026-06-09days on market $29,900 Active 11 DOM
-
2026-06-08days on market $29,900 Active 10 DOM
-
2026-06-07days on market $29,900 Active 9 DOM
-
2026-06-03days on market $29,900 Active 5 DOM
-
2026-06-02days on market $29,900 Active 4 DOM
-
2026-06-01days on market $29,900 Active 3 DOM
-
2026-05-31days on market $29,900 Active 2 DOM
-
2026-05-30remarks 699-char remark
-
2026-05-30$29,900 Active 1 DOM
ⓘ Source: listings_history table (triggers on properties + properties_extension) + one-shot
backfill from property_details.listing_events for pre-trigger history.
Climate risk First Street
- Flood 1/10 Low FEMA zone X (unshaded) · 0% chance over 30 yrs
- Wildfire 4/10 Moderate
- Heat 9/10 Extreme 7 d/yr ≥106°F today · 18 d/yr by 30 yrs out
- Wind 9/10 Extreme 99% chance of damaging wind over 30 yrs
- Air quality 2/10 Low 0 unhealthy d/yr today · 1 by 30 yrs out
Nearby sold comps map
Loading sold comps map…
Walkable amenities ~0.75 mi
Loading nearby amenities…
Taxation est. · year 1
- Rental income
- $21,098
- − Mortgage interest
- −$1,675
- − Property taxes
- −$448
- − Insurance
- −$150
- − Repairs & maintenance
- −$1,688
- − Management
- −$1,688
- − Depreciation
- −$870
- Taxable income
- $14,580
- Est. tax owed @ 24.0%
- −$3,499
- After-tax cash flow
- $10,689/yr
For passive investors: Depreciation is non-cash, so a rental often shows a tax loss while cash-flowing — sheltering income. Rental losses are passive: they offset passive income freely, and up to $25,000/yr can offset ordinary (W-2) income if you actively participate and your MAGI is under $100k (phasing out to $0 by $150k); unused losses carry forward. On sale, claimed depreciation is recaptured at up to 25%, and gains may owe capital-gains tax (a 1031 exchange can defer both). Figures are a year-1 estimate at your 24.0% rate — not tax advice; consult a CPA.
Schools (NCES district)
- District
- Georgetown 01
- NCES district ID
- 4502280
- Math proficiency
- 26% ▼ -11.00%
- Reading proficiency
- 38% ▼ -5.00%
- Median HH income
- $43,045
- Composite
- 27.15/100
- National rank
- #7030
- State rank
- #51 of 80 in SC
Livability — Murrells Inlet
- Score
- 76/100
- State rank
- #25
- US rank
- #3720
Category grades
Schools grade is shown separately in the Schools card above.
Census & demographics
- Census place
- Murrells Inlet, SC
- County
- Horry County · 356,152 people
- City population
- 34,695
- Metro
- Myrtle Beach-Conway-North Myrtle Beach, SC-NC
- Population (ZIP)
- 34,695
- Household income
- $70,691
- Rent vs Own
- Severe rent burden
- 309.0
Population outlook (Georgetown County) Hauer SSP2
- Today (2025)
- 63,275 people
- By 2030
- 63,630 · +0.6%
- By 2040
- 63,130 · -0.2%
- By 2050
- 61,904 · -2.2%
- By 2075
- 59,305 · -6.3%
- By 2100
- 53,852 · -14.9%
Race, ethnicity, and origin ACS 2023
- Neighborhood character
- Predominantly White (89%)
- Race & ethnicity
- White 89% Hispanic / Latino 4% Black 3% Two or more races 3% Asian 2%
- Common ancestry
- Romanian 4% Slovak 3% Serbian 2%
- Foreign-born
- 5% · Canada, China, Vietnam
- Languages at home
- 96% English-only · Spanish 2% Chinese 1%
Political lean MEDSL · Georgetown
- 2024 margin
- R (+19.5) · D 39.6% · R 59.1% · Other 1.2%
- 2008→2024 swing
- -14.2pp toward R · 2008: -5.2pp · 2024: -19.5pp
- All cycles
- 2024: R+19.5 2020: R+12.7 2016: R+13.0 2012: R+7.6 2008: R+5.2
Not yet ingested
- Civics
- —
Market trends
- HPI YoY
- ▼ -57.53%
- Current HPI
- 248.5102
- Rent YoY
- ▲ 4.66%
- Metro
- Myrtle Beach-Conway-North Myrtle Beach, SC-NC
- State GDP YoY
- ▲ 4.51%
- F500 in state
- 2
Industry mix (Fortune 500 HQ in SC)
| Industry | F500 HQs | Revenue |
|---|---|---|
| Packaging | 1 | $7B |
|
||
Price history
+50.3% since first listed8 events — show timeline
- 2026-05-29 Listed $29,900 CCAR
- 2020-01-09 Sold (MLS) $48,000 CCAR
- 2019-12-25 Contingent — CCAR
- 2019-11-13 Relisted — CCAR
- 2019-11-06 Contingent — CCAR
- 2019-10-11 Listed $54,900 CCAR
- 2003-07-08 Sold (MLS) $17,000 CCAR
- 2003-06-01 Listed $19,900 CCAR
Cash-flow waterfall
monthlySold comps — $/sqft
last 12 mo · ≤1 miLoading sold comps…