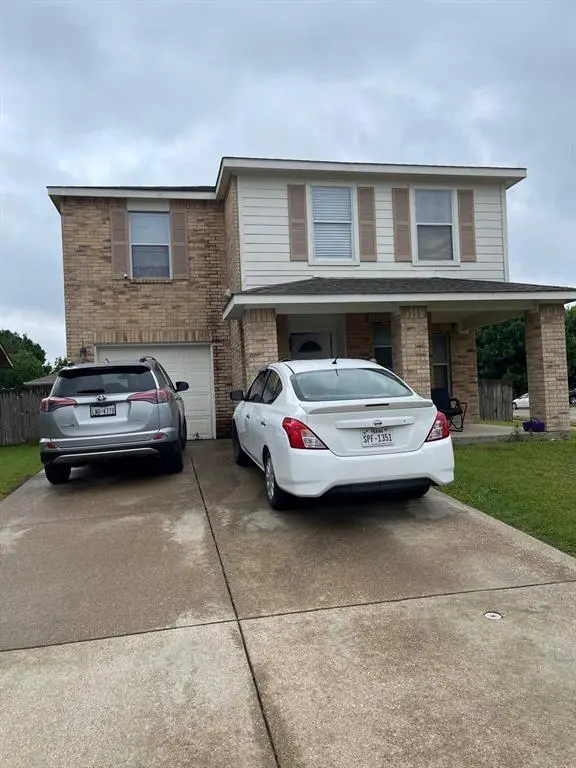
4014 China Elm Dr · Dallas, TX
Flood risk 1/10 · Minimal
- FEMA flood zone
- X
- Chance of flooding over 30 yrs
- 0.0%
- Est. flood insurance / yr
- $507 – $1,088
Fire risk 1/10 · Minimal
- Est. fire insurance / yr
- $1,222 – $2,270
Heat risk 7/10 · Major
- Hot days now (above 109°F)
- 7 days/yr
- Hot days in 30 yrs
- 23 days/yr
Wind risk 6/10 · Moderate
- Chance of severe wind over 30 yrs
- 27.0%
Air-quality risk 3/10 · Minor
- Unhealthy air days now
- 3 days/yr
- Unhealthy air days in 30 yrs
- 4 days/yr
Risk factors via First Street. Map © Google.
Why this score? — see what drove the D grade
The composite is a weighted blend of 9 inputs, each scored 0–100. Each bar is that input's sub-score; the figure is the points it added to the 100-point composite (weight × sub-score).
- ARV discount +11.3/15.0
- Appreciation +10.0/10.0
- Cash flow +5.8/30.0
- Livability +4.0/5.0
- 1% rule +3.5/10.0
- Schools +2.8/10.0
- Condition / age +2.5/5.0
- Rent growth +1.4/5.0
- DSCR +0.2/10.0
$290,000
🖨 Deal sheet (PDF) 📄 Offer letter ✓ Due diligence
Listing remarks
The home does need TLC and cosmetic updating, making it ideal for buyers looking to personalize and add value. While it may not show its absolute best currently, the location, lot size, and corner position create a strong foundation for future improvements. Whether for an owner-occupant, investor, or renovation project, this property offers strong potential. The corner lot provides a more open feel, added privacy, and enhances the home’s presence from the street. The drive-up appeal creates a welcoming first impression and makes this property stand out in the neighborhood. Conveniently located near Downtown Dallas, Trinity Groves, Bishop Arts District, and major highways including I-3
Key facts
- Outdoor recreation
- Strong foundation
- Drive-up appeal
Tags
Property features AI
Finance
- Financial info: Accepts Cash, Conventional, FHA financing
- HOA & community: Mandatory HOA; Monthly HOA fee of 275 (includes grounds maintenance); HOA managed by Greenleaf Village HOA
Exterior
- Parking: Detached driveway; Garage faces front; Attached garage with 1 garage space; 1 covered parking space
- Security: Security system
- Utilities: City sewer; Cable available; No municipal utility district
- Home design: Single family residence; Residential property; Built in 2003; Not attached to another property; Security system
- Construction: Brick construction; Composition roof; Slab foundation
- Exterior features: Wood fencing; Lot less than 0.5 acre; Subdivision: Greenleaf Village Ph 02; Directions available
Interior
- Kitchen: Electric range
- Bedrooms: 3 bedrooms (primary bedroom on main level)
- Flooring: Carpet; Tile
- Bathrooms: 2 full bathrooms; 1 half bathroom
- Heating & cooling: Central heating (electric); Central air conditioning (electric)
- Interior features: Cable TV available; Two levels; One living area; One dining area
- Laundry & utility: Full-size washer/dryer area; Utility room; Electric dryer hookup
Neighborhood map
What this means for you Summary
Snapshot
- This is a 3-bed/2.5-bath single-family listed at $290k.
Deal economics
- At list price, monthly cash flow is $-582 ($-7k/yr) — negative.
- To cash-flow at today's rent, offer at most $187k (35.4% below list).
- To meet the 1% rule (rent ≥ 1% of price), the offer needs to be $246k (15.1% below list).
- Recommended offer: $187k (35.4% below list) — sets the bar for cash-flow.
- Cap rate 3.9% vs local median 2.3% in Dallas — top-decile yield for the area; either an underpriced asset or a hidden risk that comps aren't pricing in. Stress-test before assuming the spread holds.
Location & tenants
- Location reads 81/100 on livability (#24 in TX, #1,380 nationally) — a professional / high-income tenant draw. Strengths: amenities A+, commute A+, housing A+; Watch: crime F.
- Dallas ISD (urban): math 31% / reading 36% proficiency, ranked #559 of 826 in TX (top 68%) — families likely to look elsewhere, expect single-tenant / working-renter base with shorter leases; 83% free/reduced lunch — lower-income household profile, screen leases tightly.
- Zoned schools: C F Carr El (math 32% / reading 22%, grade F, #2,791 of 4,322 statewide, top 68%, 281 students, 99% FRL); D A Hulcy Steam Middle (math 33% / reading 32%, grade F, #947 of 1,662 statewide, top 58%, 423 students, 88% FRL); L G Pinkston H S (math 10% / reading 21%, grade F, #1,505 of 1,632 statewide, top 92%, 1,139 students, 92% FRL).
- Market conditions: Rents falling (-4.2%/yr); 249 active listings in the ZIP; 29 comparable units currently listed for rent nearby; rentals at typical pace (median 26d on market — plan ~3-4 weeks tenant-placement turnaround); 12,577 units permitted in Dallas County in 2024 (6,829 in 5+ unit buildings).
- At $2,462/mo this rent would consume 49% of the median local household income ($60k/yr) (locally 892% of renters already pay >50% of income on rent) — very limited rent-growth headroom before tenants either downsize or default.
Forward outlook
- In year one you build about $31k of equity ($2k loan paydown + $29k appreciation (10.0% local appreciation)).
- Dallas County population projected at +35% by 2050 — long-run rental-demand tailwind backs the buy-and-hold thesis.
- By year 2, paydown + projected appreciation supports a ~$50k cash-out refi (75% LTV) — recoverable capital for the next deal without selling this one.
Negotiation context
- It's been on market 15 days — a 2% lower offer ($286k) is reasonable based on typical stale-listing flexibility.
Risks & watch-outs
- Watch-outs: property tax is 2.5% of price.
- Climate carrying-cost: major wind risk, 27% chance of damaging wind over 30y; extreme-heat days projected 7→23/yr by 2055 (HVAC capex compounding) — expect insurance premiums to compound above CPI over the hold.
Questions for the listing agent
- What do current leases actually rent for vs. the listed asking? Can we see a recent rent roll and the last 12 months of T-12 income?
- Property tax is high relative to price — has the assessment been appealed recently, and will the sale trigger a re-assessment?
- What does the HOA fee cover, when was the last increase, and are there any pending special assessments or reserve-fund shortfalls?
- Is there a deadline driving the sale (1031 exchange, divorce, estate, relocation)? That informs how much negotiation room exists.
- Crime grade is F in this area — have there been break-ins, vandalism, or insurance claims at this property in the last 3 years? What carrier currently insures it and at what premium?
- The area grade is low — what's the realistic commute time and amenity access for the typical tenant pool here? Any planned neighborhood developments (good or bad) we should know about?
- What's the average days-on-market for RENTAL listings here right now (not sales)? A rising rental-DOM trend means longer vacancies and softer asking-rent achievability than the comps imply.
- What's the recent tenant-quality profile in this submarket — average credit score on applications, eviction rate, late-payment / NSF rate, and stable-employment percentage? A property-management company in the area should have these aggregated.
- How much new for-sale + rental construction is in the pipeline within 1–3 miles? Heavy new supply typically softens prices + rents 12–24 months out; constrained supply supports both.
Investment metrics
- 1% rule
- 0.85% ✗
- Cap rate
- 3.89%
- Cash-on-cash
- -8.60%
- DSCR
- 0.62
- GRM
- 9.8
CMA / ARV
- ARV (median comp)
- $316,932
- List price
- $290,000
- Delta
- -8.50%
- Verdict
- FAIR
- Comps
- 20 within 1.0 mi
Show comp detail 12 sales within ~0.75 mi
| Address | Dist | Beds/Ba | Sqft | Sold | Price | $/sf | Match |
|---|---|---|---|---|---|---|---|
| 2524 Tan Oak Dr | 0.22mi | 3/2.5 | 1,588 (0%) | 8mo | $270,000 | $170 | 83 |
| 2529 Blue Myrtle Way | 0.20mi | 3/2.0 | 1,588 (0%) | 9mo | $319,000 | $201 | 81 |
| 2440 Tan Oak Dr | 0.26mi | 3/2.5 | 1,640 (+3%) | 7mo | $332,000 | $202 | 77 |
| 3920 Gray Oak Pl | 0.05mi | 3/2.5 | 1,411 (-11%) | 7mo | $325,000 | $230 | 74 |
| 2322 Tan Oak Dr | 0.33mi | 3/2.5 | 1,630 (+3%) | 9mo | $325,900 | $200 | 73 |
| 3826 Aransas St | 0.62mi | 3/2.0 | 1,641 (+3%) | 2mo | $339,900 | $207 | 62 |
| 2055 Angelina Dr | 0.52mi | 3/2.0 | 1,655 (+4%) | 14mo | $301,990 | $182 | 55 |
| 4011 Puget St | 0.66mi | 3/2.0 | 1,465 (-8%) | 2mo | $250,000 | $171 | 53 |
| 3395 Peyton Lila Rd | 0.51mi | 4/2.5 (+1) | 1,739 (+10%) | 5mo | $335,000 | $193 | 51 |
| 4026 Aransas St | 0.64mi | 4/2.0 (+1) | 1,444 (-9%) | 2mo | $285,500 | $198 | 46 |
| 3331 Canada Dr | 0.71mi | 3/2.0 | 1,430 (-10%) | 3mo | $199,900 | $140 | 46 |
| 3806 Vineyard Dr | 0.69mi | 4/2.0 (+1) | 1,686 (+6%) | 10mo | $255,000 | $151 | 42 |
Match score weights: distance 35% · size 25% · config 20% · recency 20%. Top-matched comps best support the ARV.
Projected returns pro-forma
10.0% appreciation · 0.0% rent growth · sell at horizon
- IRR
- 17.3%
- Equity multiple
- 2.40×
- Total profit
- $114,040
- Equity at exit
- $261,255
- IRR
- 15.7%
- Equity multiple
- 5.34×
- Total profit
- $352,756
- Equity at exit
- $563,406
Cash invested: $81,200 (down + closing). Projections, not guarantees.
Landlord ↔ Tenant lean methodology
- Overall (STATE)
- 87 Strongly Landlord-Friendly
- State Texas
- 87 Strongly Landlord-Friendly · R+5
- County
- — inherits STATE
- City
- — inherits STATE
ZIP-level market 75212
- Rents YoY
- -4.2%
- Active inventory
- 249
- Price-to-rent
- 9.8×
Monthly cashflow live
- Estimated rent
- $2,462 high interval (Pro) →
- Mortgage (P&I)
- −$1,521
- Tax from tax record
- −$610 /mo · $7,317/yr
- Insurance
- −$121
- HOA
- −$275
- Vacancy / Maint / Mgmt
- −$517
- Net cashflow
- $-582
Break-even live
Sensitivity live
| Price | -10% $-417 | -5% $-500 | +0% $-582 | +5% $-664 | +10% $-746 |
|---|---|---|---|---|---|
| Rent | -10% $-776 | -5% $-679 | +0% $-582 | +5% $-484 | +10% $-387 |
| Rate | -1.0pp $-436 | -0.5pp $-508 | base $-582 | +0.5pp $-657 | +1.0pp $-733 |
UW: 25.0% down · 7.5% · 30yr · 1.5% tax · 5.0% vac · 8.0% maint · 8.0% mgmt
Financing live
Cash to close
- Down payment
- $72,500
- Closing costs
- $8,700
- Reserves months
- —
- Total cash needed
- —
Loan-product check · same deal, 3 products live
Conventional
25% down · 7.5% · 30yr
- Down + closing
- —
- Monthly P&I
- —
- Monthly cashflow
- —
- DSCR
- —
- Eligible?
- —
Personal DTI + credit; lowest rate.
DSCR
20% down · 8.5% · 30yr
- Down + closing
- —
- Monthly P&I
- —
- Monthly cashflow
- —
- DSCR
- —
- Eligible?
- —
No personal income docs; deal must DSCR.
Hard money
10% down · 12.0% · 12mo
- Down + closing
- —
- Monthly P&I
- —
- Monthly cashflow
- —
- DSCR
- —
- Eligible?
- —
Short-term bridge; refi at stabilization.
Rent comps 29 comps
| Address | Beds | Baths | Sqft | Rent | $/sqft | DOM | Units | Dist |
|---|---|---|---|---|---|---|---|---|
| 4043 Gray Oak Pl Dallas, TX | 3.0 | 2.0 | 1152 | $1,999 | $1.74 | 18d | 1 | 0.16mi |
| 4043 Gray Oak Pl Dallas, TX | 3.0 | 2.0 | 1152 | $2,100 | $1.82 | 45d | 1 | 0.16mi |
| 2322 Tan Oak Dr Dallas, TX | 3.0 | 2.5 | 1630 | $2,500 | $1.53 | 45d | 1 | 0.33mi |
| 4022 Baker Ave Dallas, TX | 3.0 | 1.0 | 1276 | $1,900 | $1.49 | 26d | 1 | 0.48mi |
| 3386 Peyton Lila Rd Dallas, TX | 4.0 | 2.5 | 1739 | $2,350 | $1.35 | 45d | 1 | 0.49mi |
| 3232 Peyton Lila Rd Dallas, TX | 4.0 | 2.5 | 2000 | $2,495 | $1.25 | 9d | 1 | 0.59mi |
| 4022 Ivanhoe Ln Dallas, TX | 4.0 | 2.5 | 2042 | $2,795 | $1.37 | 45d | 1 | 0.59mi |
| 1944 Gallagher St Dallas, TX | 3.0 | 2.0 | 1125 | $1,961 | $1.74 | 7d | 1 | 0.72mi |
| 1834 Bayside St Dallas, TX | 3.0 | 2.0 | 1322 | $2,000 | $1.51 | 19d | 1 | 0.85mi |
| 1907 Nomas St Dallas, TX | 3.0 | 2.0 | 1368 | $2,900 | $2.12 | 20d | 1 | 0.91mi |
| 3807 Vilbig Rd Dallas, TX | 3.0 | 2.5 | 2000 | $5,500 | $2.75 | 45d | 1 | 0.93mi |
| 1723 Shaw St Dallas, TX | 4.0 | 3.0 | 1720 | $2,699 | $1.57 | 9d | 1 | 0.98mi |
| 1739 McBroom St Dallas, TX | 3.0 | 2.0 | 1138 | $2,100 | $1.85 | 13d | 1 | 1.01mi |
| 1610 Life Ave Dallas, TX | 3.0 | 2.5 | 1657 | $2,800 | $1.69 | 45d | 1 | 1.07mi |
| 2811 Harston St Dallas, TX | 3.0 | 2.0 | 1937 | $2,950 | $1.52 | 45d | 1 | 1.08mi |
| 3226 Navaro St Dallas, TX | 3.0 | 2.0 | 1547 | $2,500 | $1.62 | 45d | 1 | 1.14mi |
| 3321 Rutz St Dallas, TX | 3.0 | 2.5 | 1436 | $2,550 | $1.78 | 6d | 1 | 1.16mi |
| 3105 Chihuahua Ave Dallas, TX | 4.0 | 2.5 | 2214 | $3,200 | $1.45 | 17d | 1 | 1.20mi |
| 3122 Chihuahua Ave Unit 1510240P Dallas, TX | 4.0 | 3.0 | 2174 | $5,369 | $2.47 | 1d | 1 | 1.21mi |
| 3129 Rutz St Unit 1241909P Dallas, TX | 4.0 | 2.5 | 2098 | $9,353 | $4.46 | 24d | 1 | 1.21mi |
| 3129 Rutz St Dallas, TX | 4.0 | 2.5 | 2102 | $7,850 | $3.73 | 45d | 1 | 1.21mi |
| 3517 Chicago St Dallas, TX | 3.0 | 3.0 | 1538 | $1,200 | $0.78 | 8d | 1 | 1.23mi |
| 4128 Mart St Dallas, TX | 3.0 | 2.5 | 1754 | $2,800 | $1.60 | 26d | 1 | 1.40mi |
| 2635 Carmelita St Dallas, TX | 3.0 | 3.5 | 2237 | $3,399 | $1.52 | 26d | 1 | 1.41mi |
| 2654 Carolwood Ln Dallas, TX | 3.0 | 3.5 | 2174 | $3,500 | $1.61 | 45d | 1 | 1.44mi |
| 2806 Chicago St Dallas, TX | 4.0 | 3.5 | 1976 | $2,900 | $1.47 | 26d | 1 | 1.44mi |
| 2901 Borger St Apt 511 Dallas, TX | 2.0 | 2.0 | 1084 | $1,850 | $1.71 | 0d | 1 | 1.46mi |
| 2633 La Altura Ln Dallas, TX | 3.0 | 3.5 | 2170 | $3,650 | $1.68 | 14d | 1 | 1.47mi |
| 2601 La Altura Ln Dallas, TX | 3.0 | 3.5 | 2233 | $4,200 | $1.88 | 45d | 1 | 1.49mi |
HOA detail
- Monthly dues
- $275 · $3,300/yr
Listing history 1 events
-
2026-04-30$290,000 Active 1325-char remark
ⓘ Source: listings_history table (triggers on properties + properties_extension) + one-shot
backfill from property_details.listing_events for pre-trigger history.
Tax reassessment forecast TX · Resets to sale price
- Current annual tax
- $7,317 · $610/mo
- Projected year-2 tax
- $7,317 · $610/mo
- Expected delta
- $0/yr ($0/mo · 0.0%)
ⓘ Screening estimate from a state-policy table — verify with the county assessor before closing.
Climate risk First Street
- Flood 1/10 Low FEMA zone X · 0% chance over 30 yrs
- Wildfire 1/10 Low
- Heat 7/10 Severe 7 d/yr ≥109°F today · 23 d/yr by 30 yrs out
- Wind 6/10 Major 27% chance of damaging wind over 30 yrs
- Air quality 3/10 Moderate 3 unhealthy d/yr today · 4 by 30 yrs out
Nearby sold comps map
Loading sold comps map…
Walkable amenities ~0.75 mi
Loading nearby amenities…
Taxation est. · year 1
- Rental income
- $29,541
- − Mortgage interest
- −$16,245
- − Property taxes
- −$7,317
- − Insurance
- −$1,450
- − Repairs & maintenance
- −$2,363
- − Management
- −$2,363
- − HOA
- −$3,300
- − Depreciation
- −$8,436
- Taxable loss
- −$11,934
- Est. tax savings @ 24.0%
- +$2,864
- After-tax cash flow
- $-4,116/yr
For passive investors: Depreciation is non-cash, so a rental often shows a tax loss while cash-flowing — sheltering income. Rental losses are passive: they offset passive income freely, and up to $25,000/yr can offset ordinary (W-2) income if you actively participate and your MAGI is under $100k (phasing out to $0 by $150k); unused losses carry forward. On sale, claimed depreciation is recaptured at up to 25%, and gains may owe capital-gains tax (a 1031 exchange can defer both). Figures are a year-1 estimate at your 24.0% rate — not tax advice; consult a CPA.
Schools (NCES district)
- District
- Dallas ISD
- NCES district ID
- 4816230
- Math proficiency
- 31% ▼ -16.00%
- Reading proficiency
- 36% ▼ -4.00%
- Median HH income
- $42,881
- Composite
- 28.41/100
- National rank
- #6763
- State rank
- #559 of 826 in TX
Livability — Dallas
- Score
- 81/100
- State rank
- #24
- US rank
- #1380
Category grades
Schools grade is shown separately in the Schools card above.
Census & demographics
- Census place
- Dallas, TX
- County
- Dallas County · 2,612,404 people
- City population
- 1,168,437
- Metro
- Dallas-Fort Worth-Arlington, TX
- Population (ZIP)
- 28,259
- Household income
- $59,750
- Rent vs Own
- Severe rent burden
- 892.0
Population outlook (Dallas County) Hauer SSP2
- Today (2025)
- 2,979,839 people
- By 2030
- 3,191,823 · +7.1%
- By 2040
- 3,619,611 · +21.5%
- By 2050
- 4,026,915 · +35.1%
- By 2075
- 4,957,073 · +66.4%
- By 2100
- 5,508,725 · +84.9%
Race, ethnicity, and origin ACS 2023
- Neighborhood character
- Predominantly Hispanic (67%)
- Race & ethnicity
- Hispanic / Latino 67% Two or more races 26% Black 23% White 6% Asian 2%
- Hispanic origin (detail)
- Mexican 55%
- Common ancestry
- Slovak 1%
- Foreign-born
- 27% · Canada, Vietnam, Jamaica
- Languages at home
- 42% English-only · Spanish 52% Vietnamese 1%
Political lean MEDSL · Dallas
- 2024 margin
- Strong D (+22.2) · D 60.2% · R 38.0% · Other 1.8%
- 2008→2024 swing
- +6.9pp toward D · 2008: 15.3pp · 2024: 22.2pp
- All cycles
- 2024: D+22.2 2020: D+31.6 2016: D+26.2 2012: D+15.4 2008: D+15.3
Not yet ingested
- Civics
- —
Market trends
- HPI YoY
- ▲ 138.69%
- Current HPI
- 477.2035
- Rent YoY
- ▼ -4.21%
- Metro
- Dallas-Fort Worth-Arlington, TX
- State GDP YoY
- ▲ 3.95%
- F500 in state
- 110
Industry mix (Fortune 500 HQ in TX)
| Industry | F500 HQs | Revenue |
|---|---|---|
| Energy | 16 | $1,198B |
|
||
| Technology | 5 | $198B |
|
||
| Engineering / Construction | 4 | $72B |
|
||
| Energy Services | 3 | $60B |
|
||
| Utilities | 3 | $41B |
|
||
| Healthcare | 2 | $330B |
|
||
Price history
2 events — show timeline
- 2026-05-23 Pending — NTREIS
- 2026-04-30 Listed $290,000 NTREIS
Property tax history
+5.3%/yrLatest (2025): $7,317 · -6.5% YoY. Source: county tax records.
Cash-flow waterfall
monthlySold comps — $/sqft
last 12 mo · ≤1 miLoading sold comps…