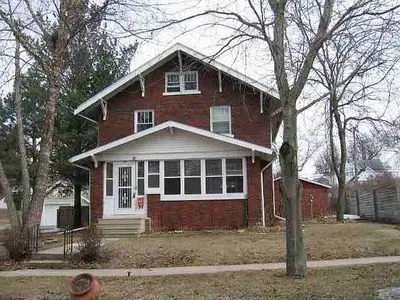
506 West St · Reinbeck, IA
Flood risk 1/10 · Minimal
- FEMA flood zone
- X (unshaded)
- Chance of flooding over 30 yrs
- 0.0%
- Est. flood insurance / yr
- $473 – $860
Fire risk 1/10 · Minimal
- Est. fire insurance / yr
- $902 – $1,676
Heat risk 2/10 · Minimal
- Hot days now (above 101°F)
- 7 days/yr
- Hot days in 30 yrs
- 16 days/yr
Wind risk 2/10 · Minimal
- Chance of severe wind over 30 yrs
- —
Air-quality risk 1/10 · Minimal
- Unhealthy air days now
- 0 days/yr
- Unhealthy air days in 30 yrs
- 0 days/yr
Risk factors via First Street. Map © Google.
Why this score? — see what drove the A grade
The composite is a weighted blend of 9 inputs, each scored 0–100. Each bar is that input's sub-score; the figure is the points it added to the 100-point composite (weight × sub-score).
- Cash flow +28.7/30.0
- ARV discount +15.0/15.0
- DSCR +10.0/10.0
- Appreciation +10.0/10.0
- 1% rule +9.1/10.0
- Schools +6.4/10.0
- Livability +3.5/5.0
- Rent growth +2.5/5.0
- Condition / age +2.5/5.0
$85,000
🖨 Deal sheet (PDF) 📄 Offer letter ✓ Due diligence
Listing remarks
Handyman Special - Cheap - Cash or possible Contract COMPS in Good Condition = $158,000 to $180,000. Needs work. Livable as-is. Needs: electrical updated New furnace/mini-split re-finish hardwoods Other minor updates as buyer sees fit. Other pics coming soon. School Information Elementary School: Gladbrook-Reinbeck High School: Gladbrook-Reinbeck Middle School: Gladbrook-Reinbeck Annual Tax Amount: 1958.94 Directions: Via Iowa HWY-175: Head West On IA-175 W/ 260 Th St/Reinbeck Toward Progress Dr 0.8 Mi Turn Left Onto Blackhawk St 0.3 Mi Turn Right Onto Park St 361 Ft Turn Left Onto West St Destination Will Be On The Left Property Type: RESIDENTIAL Area: Grundy Building and Constructi
Key facts
- Built 1910
- Listed 23 days
Neighborhood map
What this means for you Summary
Snapshot
- This is a 4-bed/1.5-bath single-family listed at $85k.
Deal economics
- At list price, monthly cash flow is $283 ($3k/yr) — positive.
- The deal already cash-flows at list — no discount required.
- Meets the 1% rule at list price ($1k rent vs $85k).
- Recommended offer: $84k (1.5% below list) — sets the bar for market timing.
Location & tenants
- Location reads 70/100 on livability (#382 in IA) — a middle-class / working-renter tenant base. Strengths: schools A+, crime A+, cost of living A+; Watch: amenities F, commute F.
- Gladbrook-Reinbeck Community School District (rural): math 76% / reading 74% proficiency, ranked #71 of 289 in IA (top 25%) — strong family-tenant draw, lease renewals of 3-5y typical.
- Market conditions: 14 active listings in the ZIP; 14 units permitted in Grundy County in 2024 (0 in 5+ unit buildings).
Forward outlook
- In year one you build about $9k of equity ($588 loan paydown + $8k appreciation (10.0% local appreciation)).
- At projected returns (10.0% appreciation + 3.0% rent growth), your $24k cash investment doubles in ~2 years — after that, you're playing with house money.
- By year 4, paydown + projected appreciation supports a ~$32k cash-out refi (75% LTV) — recoverable capital for the next deal without selling this one.
Negotiation context
- It's been on market 24 days — a 2% lower offer ($84k) is reasonable based on typical stale-listing flexibility.
Risks & watch-outs
- Watch-outs: property tax is 2.5% of price; built in 1910 — expect roof / HVAC / electrical / plumbing capex.
Questions for the listing agent
- Built in 1910 — when were the roof, HVAC, electrical panel, plumbing, and water heater last replaced?
- Property tax is high relative to price — has the assessment been appealed recently, and will the sale trigger a re-assessment?
- Is there a deadline driving the sale (1031 exchange, divorce, estate, relocation)? That informs how much negotiation room exists.
- Schools are A-rated — typically a magnet for longer-tenancy family renters. What's the average tenant stay here, and is there a school-zone premium baked into asking?
- What's the average days-on-market for RENTAL listings here right now (not sales)? A rising rental-DOM trend means longer vacancies and softer asking-rent achievability than the comps imply.
- What's the recent tenant-quality profile in this submarket — average credit score on applications, eviction rate, late-payment / NSF rate, and stable-employment percentage? A property-management company in the area should have these aggregated.
- How much new for-sale + rental construction is in the pipeline within 1–3 miles? Heavy new supply typically softens prices + rents 12–24 months out; constrained supply supports both.
Investment metrics
- 1% rule
- 1.41% ✓
- Cap rate
- 10.29%
- Cash-on-cash
- 14.28%
- DSCR
- 1.64
- GRM
- 5.9
CMA / ARV
- ARV (on-the-fly)
- $129,884
- Comps found
- 12
Show comp detail 12 sales within ~0.75 mi
| Address | Dist | Beds/Ba | Sqft | Sold | Price | $/sf | Match |
|---|---|---|---|---|---|---|---|
| 807 Randall St | 0.22mi | 3/1.0 (-1) | 1,756 (+3%) | 1mo | $118,000 | $67 | 77 |
| 812 Blackhawk St | 0.25mi | 4/2.0 | 1,652 (-3%) | 11mo | $70,000 | $42 | 72 |
| 303 Broad St | 0.19mi | 3/1.5 (-1) | 1,640 (-4%) | 10mo | $124,000 | $76 | 71 |
| 501 Blackhawk St | 0.04mi | 3/1.5 (-1) | 1,864 (+9%) | 11mo | $145,000 | $78 | 68 |
| 707 Park St | 0.14mi | 4/2.0 | 1,640 (-4%) | 21mo | $118,000 | $72 | 68 |
| 208 Center St | 0.29mi | 3/1.0 (-1) | 1,724 (+1%) | 14mo | $100,000 | $58 | 67 |
| 411 Broad St | 0.12mi | 4/2.0 | 1,631 (-5%) | 22mo | $119,000 | $73 | 66 |
| 404 Spruce St | 0.37mi | 3/1.5 (-1) | 1,694 (-1%) | 19mo | $269,900 | $159 | 60 |
| 706 Park St | 0.12mi | 3/1.5 (-1) | 1,532 (-10%) | 21mo | $110,000 | $72 | 54 |
| 605 Pioneer Rd | 0.43mi | 3/3.0 (-1) | 1,600 (-6%) | 12mo | $232,500 | $145 | 49 |
| 103 Park St | 0.39mi | 4/2.0 | 1,848 (+8%) | 22mo | $180,000 | $97 | 48 |
| 103 Fieldstone Dr | 0.57mi | 3/2.0 (-1) | 1,891 (+11%) | 22mo | $458,000 | $242 | 30 |
Match score weights: distance 35% · size 25% · config 20% · recency 20%. Top-matched comps best support the ARV.
Projected returns pro-forma
10.0% appreciation · 3.0% rent growth · sell at horizon
- IRR
- 34.8%
- Equity multiple
- 3.71×
- Total profit
- $64,400
- Equity at exit
- $76,575
- IRR
- 30.0%
- Equity multiple
- 8.38×
- Total profit
- $175,586
- Equity at exit
- $165,136
Cash invested: $23,800 (down + closing). Projections, not guarantees.
Landlord ↔ Tenant lean methodology
- Overall (STATE)
- 83 Strongly Landlord-Friendly
- State Iowa
- 83 Strongly Landlord-Friendly · R+6
- County
- — inherits STATE
- City
- — inherits STATE
ZIP-level market 50669
- Home prices YoY
- 4.9%
- Active inventory
- 14
- Price-to-rent
- 5.9×
Monthly cashflow live
- Estimated rent
- $1,196 medium interval (Pro) →
- Mortgage (P&I)
- −$446
- Tax from tax record
- −$180 /mo · $2,164/yr
- Insurance
- −$35
- HOA
- −$0
- Vacancy / Maint / Mgmt
- −$251
- Net cashflow
- $283
Break-even live
Sensitivity live
| Price | -10% $331 | -5% $307 | +0% $283 | +5% $259 | +10% $235 |
|---|---|---|---|---|---|
| Rent | -10% $189 | -5% $236 | +0% $283 | +5% $331 | +10% $378 |
| Rate | -1.0pp $326 | -0.5pp $305 | base $283 | +0.5pp $261 | +1.0pp $239 |
UW: 25.0% down · 7.5% · 30yr · 1.5% tax · 5.0% vac · 8.0% maint · 8.0% mgmt
Financing live
Cash to close
- Down payment
- $21,250
- Closing costs
- $2,550
- Reserves months
- —
- Total cash needed
- —
Loan-product check · same deal, 3 products live
Conventional
25% down · 7.5% · 30yr
- Down + closing
- —
- Monthly P&I
- —
- Monthly cashflow
- —
- DSCR
- —
- Eligible?
- —
Personal DTI + credit; lowest rate.
DSCR
20% down · 8.5% · 30yr
- Down + closing
- —
- Monthly P&I
- —
- Monthly cashflow
- —
- DSCR
- —
- Eligible?
- —
No personal income docs; deal must DSCR.
Hard money
10% down · 12.0% · 12mo
- Down + closing
- —
- Monthly P&I
- —
- Monthly cashflow
- —
- DSCR
- —
- Eligible?
- —
Short-term bridge; refi at stabilization.
Listing history 23 events
-
2026-06-19days on market $85,000 Active 24 DOM
-
2026-06-18days on market $85,000 Active 23 DOM
-
2026-06-17days on market $85,000 Active 22 DOM
-
2026-06-16days on market $85,000 Active 21 DOM
-
2026-06-15days on market $85,000 Active 20 DOM
-
2026-06-14days on market $85,000 Active 18 DOM
-
2026-06-12days on market $85,000 Active 17 DOM
-
2026-06-09days on market $85,000 Active 14 DOM
-
2026-06-08days on market $85,000 Active 13 DOM
-
2026-06-07days on market $85,000 Active 12 DOM
-
2026-06-05days on market $85,000 Active 9 DOM
-
2026-06-03days on market $85,000 Active 8 DOM
-
2026-06-02days on market $85,000 Active 7 DOM
-
2026-06-01days on market $85,000 Active 6 DOM
-
2026-05-31days on market $85,000 Active 5 DOM
-
2026-05-30days on market $85,000 Active 4 DOM
-
2026-05-26$85,000 Active
-
2023-11-23price $92,000
-
2023-10-30price $109,900
-
2023-10-16price $124,900
-
2023-09-08price $130,900
-
2023-08-03price $139,900
-
2005-11-07soldstatus $126,500
ⓘ Source: listings_history table (triggers on properties + properties_extension) + one-shot
backfill from property_details.listing_events for pre-trigger history.
Tax reassessment forecast IA · Partial reset (capped growth)
- Current annual tax
- $2,164 · $180/mo
- Projected year-2 tax
- $2,164 · $180/mo
- Expected delta
- $0/yr ($0/mo · 0.0%)
ⓘ Screening estimate from a state-policy table — verify with the county assessor before closing.
Climate risk First Street
- Flood 1/10 Low FEMA zone X (unshaded) · 0% chance over 30 yrs
- Wildfire 1/10 Low
- Heat 2/10 Low 7 d/yr ≥101°F today · 16 d/yr by 30 yrs out
- Wind 2/10 Low
- Air quality 1/10 Low 0 unhealthy d/yr today · 0 by 30 yrs out
Nearby sold comps map
Loading sold comps map…
Walkable amenities ~0.75 mi
Loading nearby amenities…
Taxation est. · year 1
- Rental income
- $14,351
- − Mortgage interest
- −$4,761
- − Property taxes
- −$2,164
- − Insurance
- −$425
- − Repairs & maintenance
- −$1,148
- − Management
- −$1,148
- − Depreciation
- −$2,473
- Taxable income
- $2,232
- Est. tax owed @ 24.0%
- −$536
- After-tax cash flow
- $2,864/yr
For passive investors: Depreciation is non-cash, so a rental often shows a tax loss while cash-flowing — sheltering income. Rental losses are passive: they offset passive income freely, and up to $25,000/yr can offset ordinary (W-2) income if you actively participate and your MAGI is under $100k (phasing out to $0 by $150k); unused losses carry forward. On sale, claimed depreciation is recaptured at up to 25%, and gains may owe capital-gains tax (a 1031 exchange can defer both). Figures are a year-1 estimate at your 24.0% rate — not tax advice; consult a CPA.
Schools (NCES district)
- District
- Gladbrook-Reinbeck Community School District
- NCES district ID
- 1912660
- Math proficiency
- 76% ▼ -3.00%
- Reading proficiency
- 74% ▲ 9.00%
- Median HH income
- $55,866
- Composite
- 64.09/100
- National rank
- #576
- State rank
- #71 of 289 in IA
Livability — Reinbeck
- Score
- 70/100
- State rank
- #382
- US rank
- #8130
Category grades
Schools grade is shown separately in the Schools card above.
Census & demographics
- Census place
- Reinbeck, IA
- Population (ZIP)
- 2,447
Population outlook (Grundy County) Hauer SSP2
- Today (2025)
- 12,452 people
- By 2030
- 12,452 · +0.0%
- By 2040
- 12,437 · -0.1%
- By 2050
- 12,370 · -0.7%
- By 2075
- 12,495 · +0.3%
- By 2100
- 11,823 · -5.1%
Race, ethnicity, and origin ACS 2023
- Neighborhood character
- Predominantly White (95%)
- Race & ethnicity
- White 95% Hispanic / Latino 3% Two or more races 3% Native American 1%
- Common ancestry
- Portuguese 3% Slovak 1% Iranian 1%
- Foreign-born
- 2% · Canada
- Languages at home
- 98% English-only · Spanish 1%
Political lean MEDSL · Grundy
- 2024 margin
- Solid R (+41.8) · D 28.3% · R 70.1% · Other 1.6%
- 2008→2024 swing
- -24.9pp toward R · 2008: -16.9pp · 2024: -41.8pp
- All cycles
- 2024: R+41.8 2020: R+37.4 2016: R+39.5 2012: R+23.1 2008: R+16.9
Not yet ingested
- Civics
- —
Market trends
- HPI YoY
- ▲ 11.93%
- Current HPI
- 257.04
- Rent YoY
- —
- Metro
- —
- State GDP YoY
- ▲ 2.48%
- F500 in state
- 4
Industry mix (Fortune 500 HQ in IA)
| Industry | F500 HQs | Revenue |
|---|---|---|
| Financial Services | 1 | $16B |
|
||
| Retail / Convenience | 1 | $15B |
|
||
Price history
-32.8% since first listed7 events — show timeline
- 2026-05-26 Listed $85,000 FSBO.com
- 2023-11-23 Price Changed $92,000 NEIRBR as distributed by MLS GRID
- 2023-10-30 Price Changed $109,900 NEIRBR as distributed by MLS GRID
- 2023-10-16 Price Changed $124,900 NEIRBR as distributed by MLS GRID
- 2023-09-08 Price Changed $130,900 NEIRBR as distributed by MLS GRID
- 2023-08-03 Price Changed $139,900 NEIRBR as distributed by MLS GRID
- 2005-11-07 Sold (Public Records) $126,500 Public Records
Property tax history
+3.5%/yrLatest (2025): $2,164 · +5.7% YoY. Source: county tax records.
Cash-flow waterfall
monthlySold comps — $/sqft
last 12 mo · ≤1 miLoading sold comps…