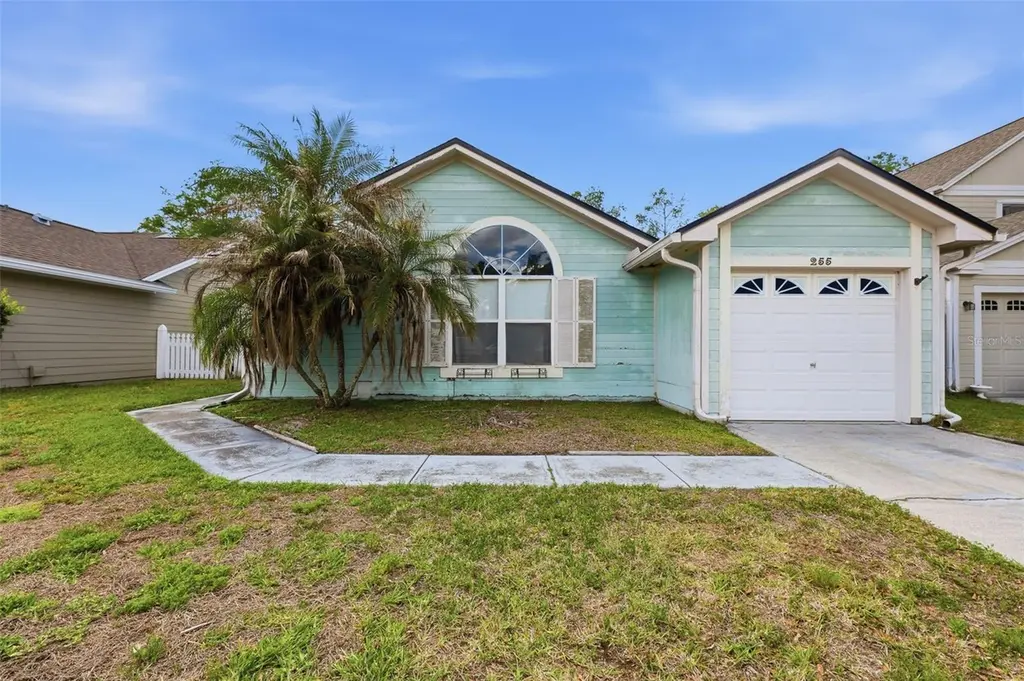
255 Tom Sawyer Ct · Alafaya, FL
Flood risk 1/10 · Minimal
- FEMA flood zone
- X (unshaded)
- Chance of flooding over 30 yrs
- 0.0%
- Est. flood insurance / yr
- $507 – $1,088
Fire risk 4/10 · Minor
- Est. fire insurance / yr
- $947 – $1,759
Heat risk 9/10 · Severe
- Hot days now (above 108°F)
- 7 days/yr
- Hot days in 30 yrs
- 22 days/yr
Wind risk 9/10 · Severe
- Chance of severe wind over 30 yrs
- 99.0%
Air-quality risk 2/10 · Minimal
- Unhealthy air days now
- 1 days/yr
- Unhealthy air days in 30 yrs
- 1 days/yr
Risk factors via First Street. Map © Google.
Why this score? — see what drove the D+ grade
The composite is a weighted blend of 9 inputs, each scored 0–100. Each bar is that input's sub-score; the figure is the points it added to the 100-point composite (weight × sub-score).
- ARV discount +14.2/15.0
- Cash flow +11.3/30.0
- Appreciation +4.8/10.0
- Schools +4.1/10.0
- Livability +4.1/5.0
- DSCR +3.3/10.0
- 1% rule +2.8/10.0
- Rent growth +2.7/5.0
- Condition / age +2.5/5.0
$280,000
🖨 Deal sheet (PDF) 📄 Offer letter ✓ Due diligence
Listing remarks
Under contract-accepting backup offers. CASH ONLY!! Nestled on a quiet cul-de-sac in the highly desirable Waterford Lakes community of East Orlando, this 3-bedroom, 2-bath home offers incredible potential with peaceful pond views and vaulted ceilings that create a bright, open feel throughout the main living areas. The home does need some updating, including new flooring in the living areas, but the good news is the previous owner already purchased laminate flooring and it is included with the home—making it even easier to bring your vision to life. Enjoy relaxing water views from your backyard while living in a community known for its outstanding amenities. Residents enjoy access to
Key facts
- Community pool
- Pond views
- Cul-de-sac
Tags
Neighborhood map
What this means for you Summary
Snapshot
- This is a 3-bed/2.0-bath single-family listed at $280k.
Deal economics
- At list price, monthly cash flow is $-102 ($-1k/yr) — negative.
- To cash-flow at today's rent, offer at most $262k (6.4% below list).
- To meet the 1% rule (rent ≥ 1% of price), the offer needs to be $218k (22.0% below list).
- Recommended offer: $218k (22.0% below list) — sets the bar for 1% rule.
- Cap rate 5.9% vs local median 3.4% in Alafaya — top-decile yield for the area; either an underpriced asset or a hidden risk that comps aren't pricing in. Stress-test before assuming the spread holds.
Location & tenants
- Location reads 82/100 on livability (#60 in FL, #1,076 nationally) — a professional / high-income tenant draw. Strengths: housing A+, health & safety A+, crime A; Watch: cost of living C-.
- Orange (suburban): math 46% / reading 51% proficiency, ranked #43 of 73 in FL (top 59%) — families likely to look elsewhere, expect single-tenant / working-renter base with shorter leases.
- Zoned schools: Waterford Elementary (math 71% / reading 70%, grade A-, #333 of 2,144 statewide, top 16%, 526 students, 42% FRL); Discovery Middle (math 61% / reading 55%, grade B, #151 of 571 statewide, top 27%, 812 students, 53% FRL); Timber Creek High (math 46% / reading 72%, grade C+, #113 of 667 statewide, top 17%, 3,573 students, 33% FRL).
- Zoned-school proficiency averages 62% at this address vs 48% district-wide (+14 pts) — the actual schools serving this property are materially stronger than the Orange average implies; a family-tenant draw the district grade alone would hide.
- Market conditions: Rents flat; 330 active listings in the ZIP; 28 comparable units currently listed for rent nearby; rentals leasing fast (median 13d on market — plan ~1-2 weeks tenant-placement turnaround); solid renter incomes; 8,053 units permitted in Orange County in 2024 (3,133 in 5+ unit buildings).
Forward outlook
- In year one you build about $908 of equity ($2k loan paydown + $-1k appreciation (-0.4% local appreciation)).
- Orange County population projected at +52% by 2050 — long-run rental-demand tailwind backs the buy-and-hold thesis.
Negotiation context
- Only 6 days on market — expect competitive offers; lowballing is unlikely to land.
- Current owner paid $122k; list at $280k implies a 130% gain — meaningful room to come down on a strong offer.
Risks & watch-outs
- Climate carrying-cost: severe wind risk, 99% chance of damaging wind over 30y; extreme-heat days projected 7→22/yr by 2055 (HVAC capex compounding) — expect insurance premiums to compound above CPI over the hold.
Questions for the listing agent
- What do current leases actually rent for vs. the listed asking? Can we see a recent rent roll and the last 12 months of T-12 income?
- What does the HOA fee cover, when was the last increase, and are there any pending special assessments or reserve-fund shortfalls?
- Is there a deadline driving the sale (1031 exchange, divorce, estate, relocation)? That informs how much negotiation room exists.
- Schools are D-rated, which usually means shorter tenancies and higher turnover. Who's the typical renter profile here, and what's been the actual vacancy rate?
- The area grade is low — what's the realistic commute time and amenity access for the typical tenant pool here? Any planned neighborhood developments (good or bad) we should know about?
- What's the average days-on-market for RENTAL listings here right now (not sales)? A rising rental-DOM trend means longer vacancies and softer asking-rent achievability than the comps imply.
- What's the recent tenant-quality profile in this submarket — average credit score on applications, eviction rate, late-payment / NSF rate, and stable-employment percentage? A property-management company in the area should have these aggregated.
- How much new for-sale + rental construction is in the pipeline within 1–3 miles? Heavy new supply typically softens prices + rents 12–24 months out; constrained supply supports both.
Investment metrics
- 1% rule
- 0.78% ✗
- Cap rate
- 5.86%
- Cash-on-cash
- -1.56%
- DSCR
- 0.93
- GRM
- 10.7
CMA / ARV
- ARV (on-the-fly)
- $329,400
- Comps found
- 4
Show comp detail 4 sales within ~0.75 mi
| Address | Dist | Beds/Ba | Sqft | Sold | Price | $/sf | Match |
|---|---|---|---|---|---|---|---|
| 248 Pap Finn Ct | 0.09mi | 3/2.0 | 1,243 (+2%) | 13mo | $335,000 | $270 | 82 |
| 264 Clemens Ct | 0.08mi | 2/1.5 (-1) | 1,214 (-0%) | 24mo | $315,000 | $259 | 69 |
| 747 Deacon Winn Ct | 0.47mi | 3/2.0 | 1,377 (+13%) | 3mo | $400,000 | $290 | 54 |
| 12952 Downstream Cir | 0.61mi | 3/2.0 | 1,375 (+13%) | 12mo | $360,000 | $262 | 40 |
Match score weights: distance 35% · size 25% · config 20% · recency 20%. Top-matched comps best support the ARV.
Projected returns pro-forma
-0.37% appreciation · 0.82% rent growth · sell at horizon
- IRR
- -6.9%
- Equity multiple
- 0.69×
- Total profit
- $-24,201
- Equity at exit
- $76,203
- IRR
- -2.2%
- Equity multiple
- 0.79×
- Total profit
- $-16,581
- Equity at exit
- $87,623
Cash invested: $78,400 (down + closing). Projections, not guarantees.
Landlord ↔ Tenant lean methodology
- Overall (STATE)
- 87 Strongly Landlord-Friendly
- State Florida
- 87 Strongly Landlord-Friendly · R+3
- County
- — inherits STATE
- City
- — inherits STATE
ZIP-level market 32828
- Home prices YoY
- -0.1%
- Rents YoY
- 0.8%
- Active inventory
- 330
- Price-to-rent
- 10.7×
Monthly cashflow live
- Estimated rent
- $2,184 high interval (Pro) →
- Mortgage (P&I)
- −$1,468
- Tax from tax record
- −$119 /mo · $1,433/yr
- Insurance
- −$117
- HOA
- −$123
- Lot rent
- −$0
- Vacancy / Maint / Mgmt
- −$459
- Net cashflow
- $-102
Break-even live
Sensitivity live
| Price | -10% $57 | -5% $-23 | +0% $-102 | +5% $-181 | +10% $-260 |
|---|---|---|---|---|---|
| Rent | -10% $-275 | -5% $-188 | +0% $-102 | +5% $-16 | +10% $71 |
| Rate | -1.0pp $39 | -0.5pp $-31 | base $-102 | +0.5pp $-175 | +1.0pp $-248 |
UW: 25.0% down · 7.5% · 30yr · 1.5% tax · 5.0% vac · 8.0% maint · 8.0% mgmt
Financing live
Cash to close
- Down payment
- $70,000
- Closing costs
- $8,400
- Reserves months
- —
- Total cash needed
- —
Loan-product check · same deal, 3 products live
Conventional
25% down · 7.5% · 30yr
- Down + closing
- —
- Monthly P&I
- —
- Monthly cashflow
- —
- DSCR
- —
- Eligible?
- —
Personal DTI + credit; lowest rate.
DSCR
20% down · 8.5% · 30yr
- Down + closing
- —
- Monthly P&I
- —
- Monthly cashflow
- —
- DSCR
- —
- Eligible?
- —
No personal income docs; deal must DSCR.
Hard money
10% down · 12.0% · 12mo
- Down + closing
- —
- Monthly P&I
- —
- Monthly cashflow
- —
- DSCR
- —
- Eligible?
- —
Short-term bridge; refi at stabilization.
Rent comps 28 comps
| Address | Beds | Baths | Sqft | Rent | $/sqft | DOM | Units | Dist |
|---|---|---|---|---|---|---|---|---|
| 713 Crest Pines Dr #217 Orlando, FL | 2.0 | 2.0 | 1013 | $1,850 | $1.83 | 24d | 1 | 0.36mi |
| 725 Crest Pines Dr Orlando, FL | 2.0–3.0 | 2.0 | 1100 | $1,950 | $1.77 | 26d | 2 | 0.39mi |
| 725 Crest Pines Dr #417 Orlando, FL | 3.0 | 2.0 | 1187 | $1,950 | $1.64 | 13d | 1 | 0.40mi |
| 725 Crest Pines Dr Unit 1 Orlando, FL | 2.0 | 2.0 | 1013 | $1,895 | $1.87 | 10d | 1 | 0.40mi |
| 12602 Crest Springs Ln #1318 Orlando, FL | 2.0 | 2.0 | 1013 | $1,975 | $1.95 | 17d | 1 | 0.40mi |
| 738 Crest Pines Dr #716 Orlando, FL | 2.0 | 1.5 | 1200 | $1,900 | $1.58 | 0d | 1 | 0.45mi |
| 12500 Crest Springs Ln #1023 Orlando, FL | 2.0 | 2.0 | 1013 | $1,599 | $1.58 | 24d | 1 | 0.49mi |
| 12500 Crest Springs Ln #1014 Orlando, FL | 2.0 | 2.0 | 1013 | $1,700 | $1.68 | 13d | 1 | 0.49mi |
| 12932 Mallory Cir Orlando, FL | 1.0–3.0 | 1.0–2.0 | 1096 | $2,564 | $2.34 | 0d | 33 | 0.49mi |
| 12932 Mallory Cir Orlando, FL | 1.0–3.0 | 1.0–3.0 | 1173 | $2,737 | $2.33 | 18d | 49 | 0.49mi |
| 986 Tillery Way #106 Orlando, FL | 2.0 | 2.5 | 1260 | $1,850 | $1.47 | 15d | 1 | 0.55mi |
| 12101 Fountainbrook Blvd Orlando, FL | 1.0–3.0 | 1.0–2.0 | 968 | $2,453 | $2.53 | 0d | 16 | 0.63mi |
| 12846 Lexington Summit St Orlando, FL | 3.0 | 2.5 | 1483 | $2,350 | $1.58 | 10d | 1 | 0.91mi |
| 12640 Somerset Oaks St Orlando, FL | 2.0 | 2.5 | 1483 | $2,000 | $1.35 | 24d | 1 | 0.97mi |
| 12640 Somerset Oaks St Orlando, FL | 3.0 | 2.5 | 1483 | $2,000 | $1.35 | 17d | 1 | 0.97mi |
| 12664 Somerset Oaks St Orlando, FL | 2.0 | 2.5 | 1264 | $1,895 | $1.50 | 13d | 1 | 0.97mi |
| 1301 Waterford Oak Dr Orlando, FL | 1.0–3.0 | 1.0–2.0 | 985 | $2,469 | $2.51 | 0d | 14 | 0.98mi |
| 12649 Somerset Oaks St Orlando, FL | 2.0 | 2.5 | 1264 | $2,000 | $1.58 | 6d | 1 | 0.99mi |
| 12973 Lexington Summit St Orlando, FL | 3.0 | 2.5 | 1476 | $2,195 | $1.49 | 24d | 1 | 0.99mi |
| 834 Oberry Hoover Rd Orlando, FL | 2.0 | 1.0 | 1061 | $1,750 | $1.65 | 26d | 1 | 1.04mi |
| 11701 Heritage Estates Ave Orlando, FL | 1.0–3.0 | 1.0–2.0 | 1106 | $2,295 | $2.07 | 0d | 13 | 1.17mi |
| 1215 Sophie Blvd Orlando, FL | 2.0 | 2.0 | 1205 | $1,625 | $1.35 | 6d | 1 | 1.20mi |
| 1230 Sophie Blvd Orlando, FL | 2.0 | 2.0 | 1087 | $1,550 | $1.43 | 6d | 1 | 1.25mi |
| 12137 Ashton Manor Way Orlando, FL | 1.0–3.0 | 1.0–2.0 | 1024 | $2,003 | $1.96 | 0d | 9 | 1.35mi |
| 1700 Woodbury Rd Orlando, FL | 1.0–3.0 | 1.0–2.0 | 940 | $2,009 | $2.14 | 0d | 9 | 1.40mi |
| 12000 Bryonia Rd Alafaya, FL | 1.0–3.0 | 1.0–2.0 | 979 | $2,523 | $2.58 | 0d | 12 | 1.42mi |
| 1421 Sophie Blvd Orlando, FL | 2.0 | 2.0 | 1087 | $1,795 | $1.65 | 20d | 1 | 1.43mi |
| 1641 Cricket Club Cir Orlando, FL | 3.0 | 2.0 | 1200 | $2,228 | $1.86 | 10d | 2 | 1.46mi |
HOA detail
- Monthly dues
- $123 · $1,476/yr
- Likely covers
- water
Listing history 6 events
-
2026-04-27status Pending
-
2026-04-21$280,000 Active
-
2003-07-01soldstatus $122,000
-
2001-06-20soldstatus $106,000
-
1996-04-04soldstatus $79,900
-
1986-10-01soldstatus $68,100
ⓘ Source: listings_history table (triggers on properties + properties_extension) + one-shot
backfill from property_details.listing_events for pre-trigger history.
Tax reassessment forecast FL · Resets to sale price
- Current annual tax
- $1,433 · $119/mo
- Projected year-2 tax
- $2,324 · $194/mo
- Expected delta
- +$891/yr (+$74/mo · 62.2%)
ⓘ Screening estimate from a state-policy table — verify with the county assessor before closing.
Climate risk First Street
- Flood 1/10 Low FEMA zone X (unshaded) · 0% chance over 30 yrs
- Wildfire 4/10 Moderate
- Heat 9/10 Extreme 7 d/yr ≥108°F today · 22 d/yr by 30 yrs out
- Wind 9/10 Extreme 99% chance of damaging wind over 30 yrs
- Air quality 2/10 Low 1 unhealthy d/yr today · 1 by 30 yrs out
Nearby sold comps map
Loading sold comps map…
Walkable amenities ~0.75 mi
Loading nearby amenities…
Taxation est. · year 1
- Rental income
- $26,210
- − Mortgage interest
- −$15,684
- − Property taxes
- −$1,433
- − Insurance
- −$1,400
- − Repairs & maintenance
- −$2,097
- − Management
- −$2,097
- − HOA
- −$1,476
- − Depreciation
- −$8,145
- Taxable loss
- −$6,123
- Est. tax savings @ 24.0%
- +$1,469
- After-tax cash flow
- $246/yr
For passive investors: Depreciation is non-cash, so a rental often shows a tax loss while cash-flowing — sheltering income. Rental losses are passive: they offset passive income freely, and up to $25,000/yr can offset ordinary (W-2) income if you actively participate and your MAGI is under $100k (phasing out to $0 by $150k); unused losses carry forward. On sale, claimed depreciation is recaptured at up to 25%, and gains may owe capital-gains tax (a 1031 exchange can defer both). Figures are a year-1 estimate at your 24.0% rate — not tax advice; consult a CPA.
Schools (NCES district)
- District
- Orange
- NCES district ID
- 1201440
- Math proficiency
- 46% ▼ -9.00%
- Reading proficiency
- 51% ▼ -2.00%
- Median HH income
- $49,350
- Composite
- 41.47/100
- National rank
- #3461
- State rank
- #43 of 73 in FL
Livability — Alafaya
- Score
- 82/100
- State rank
- #60
- US rank
- #1076
Category grades
Schools grade is shown separately in the Schools card above.
Census & demographics
- Census place
- Alafaya, FL
- County
- Orange County · 1,471,359 people
- City population
- 131,972
- Metro
- Orlando-Kissimmee-Sanford, FL
- Population (ZIP)
- 69,202
- Household income
- $101,767
- Rent vs Own
- Severe rent burden
- 2213.0
Population outlook (Orange County) Hauer SSP2
- Today (2025)
- 1,618,226 people
- By 2030
- 1,787,404 · +10.5%
- By 2040
- 2,125,621 · +31.4%
- By 2050
- 2,454,016 · +51.6%
- By 2075
- 3,173,711 · +96.1%
- By 2100
- 3,607,781 · +122.9%
Race, ethnicity, and origin ACS 2023
- Neighborhood character
- Diverse neighborhood (Simpson 0.67)
- Race & ethnicity
- White 42% Hispanic / Latino 37% Two or more races 23% Black 9% Asian 7%
- Hispanic origin (detail)
- Mexican 1% Puerto Rican 19% Cuban 4% Dominican 3%
- Common ancestry
- Slovak 2% Romanian 1% Lithuanian 1%
- Foreign-born
- 20% · Canada, Jamaica, Vietnam
- Languages at home
- 63% English-only · Spanish 27% Other Indo-European 3% Arabic 1%
Political lean MEDSL · Orange
- 2024 margin
- D (+13.6) · D 56.1% · R 42.5% · Other 1.3%
- 2008→2024 swing
- -5.0pp toward R · 2008: 18.6pp · 2024: 13.6pp
- All cycles
- 2024: D+13.6 2020: D+23.1 2016: D+24.6 2012: D+18.2 2008: D+18.6
Not yet ingested
- Civics
- —
Market trends
- HPI YoY
- ▼ -0.37%
- Current HPI
- 284.5182
- Rent YoY
- ▲ 0.82%
- Metro
- Orlando-Kissimmee-Sanford, FL
- State GDP YoY
- ▲ 3.28%
- F500 in state
- 36
Industry mix (Fortune 500 HQ in FL)
| Industry | F500 HQs | Revenue |
|---|---|---|
| Industrial Technology | 2 | $29B |
|
||
| Insurance | 2 | $17B |
|
||
| Retail | 1 | $60B |
|
||
| Technology Distribution | 1 | $58B |
|
||
| Homebuilding | 1 | $35B |
|
||
| Technology Manufacturing | 1 | $35B |
|
||
Price history
+311.2% since first listed6 events — show timeline
- 2026-04-27 Pending — Stellar MLS as Distributed by MLS Grid
- 2026-04-21 Listed $280,000 Stellar MLS as Distributed by MLS Grid
- 2003-07-01 Sold (Public Records) $122,000 Public Records
- 2001-06-20 Sold (Public Records) $106,000 Public Records
- 1996-04-04 Sold (Public Records) $79,900 Public Records
- 1986-10-01 Sold (Public Records) $68,100 Public Records
Property tax history
+2.9%/yrLatest (2025): $1,433 · +11.9% YoY. Source: county tax records.
Cash-flow waterfall
monthlySold comps — $/sqft
last 12 mo · ≤1 miLoading sold comps…