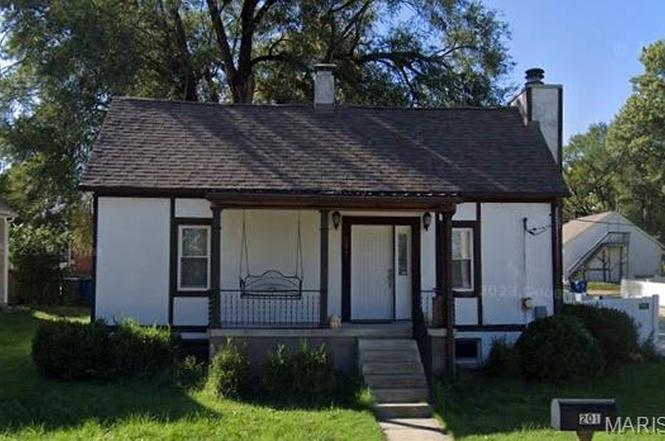
201 S Lange Ave · Maryville, IL
Flood risk 1/10 · Minimal
- FEMA flood zone
- —
- Chance of flooding over 30 yrs
- 0.0%
- Est. flood insurance / yr
- —
Fire risk 1/10 · Minimal
- Est. fire insurance / yr
- $804 – $1,492
Heat risk 5/10 · Moderate
- Hot days now (above 107°F)
- 7 days/yr
- Hot days in 30 yrs
- 21 days/yr
Wind risk 2/10 · Minimal
- Chance of severe wind over 30 yrs
- 1.0%
Air-quality risk 3/10 · Minor
- Unhealthy air days now
- 3 days/yr
- Unhealthy air days in 30 yrs
- 4 days/yr
Risk factors via First Street. Map © Google.
Why this score? — see what drove the C+ grade
The composite is a weighted blend of 9 inputs, each scored 0–100. Each bar is that input's sub-score; the figure is the points it added to the 100-point composite (weight × sub-score).
- Cash flow +26.0/30.0
- 1% rule +9.0/10.0
- DSCR +8.7/10.0
- ARV discount +7.5/15.0
- Livability +3.8/5.0
- Rent growth +2.5/5.0
- Condition / age +2.5/5.0
- Appreciation +1.8/10.0
- Schools +1.6/10.0
$75,000
🖨 Deal sheet (PDF) 📄 Offer letter ✓ Due diligence
Listing remarks MLS
Well maintained home on corner lot. Gas fireplace in living room, updated bath and light fixtures. Newer entry door off kitchen, front door, front porch, tilt-in thermal windows. Large fenced back yard with shed, appliances include gas range, refrigerator, dishwasher, 3 ceiling fans. Move-in ready! Minutes from bike trail.
Key facts
- 5,501 sq ft lot
- Built 1945
Neighborhood map
What this means for you Summary
Snapshot
- This is a 2-bed/1.0-bath single-family listed at $75k.
Deal economics
- At list price, monthly cash flow is $186 ($2k/yr) — positive.
- The deal already cash-flows at list — no discount required.
- Meets the 1% rule at list price ($1k rent vs $75k).
- Cap rate 9.3% vs local median 2.0% in Maryville — top-decile yield for the area; either an underpriced asset or a hidden risk that comps aren't pricing in. Stress-test before assuming the spread holds.
Location & tenants
- Location reads 76/100 on livability (#197 in IL, #3,649 nationally) — a middle-class / working-renter tenant base. Strengths: crime A+, employment A+, housing A+; Watch: amenities F, commute F, health & safety F.
- Collinsville CUSD 10 (suburban): math 14% / reading 20% proficiency, ranked #465 of 620 in IL (top 75%) — low school quality limits family demand, transient renter base, plan for 1-2y turnover.
- Zoned schools: Maryville Elem School (math 52% / reading 37%, grade F, #267 of 2,056 statewide, top 15%, 383 students, 0% FRL); Collinsville Middle School (math 11% / reading 19%, grade F, #501 of 665 statewide, top 77%, 950 students, 0% FRL); Collinsville High School (math 16% / reading 21%, grade F, #427 of 693 statewide, top 62%, 1,978 students, 0% FRL) — zoned schools average 0% FRL vs 52% district-wide (52 pts lower); this property's tenant base skews higher-income than the district average.
- Market conditions: 27 active listings in the ZIP; 1 comparable units currently listed for rent nearby; 336 units permitted in Madison County in 2024 (0 in 5+ unit buildings).
Forward outlook
- Local home prices are declining (-3.0%/yr); year-one equity from $519 of loan paydown is wiped out by about $2k of value loss. Plan a longer hold.
- Madison County population projected at -18% by 2050 — secular population decline; favor cash flow + early exit over multi-decade hold.
Negotiation context
- Only 1 days on market — expect competitive offers; lowballing is unlikely to land.
- 4 sale attempts since 7y ago with the ask held roughly flat each time — persistent listings suggest the price (not the market) is what's stuck; bring a comps-based counter.
Risks & watch-outs
- Watch-outs: property tax is 3.5% of price; built in 1945 — expect roof / HVAC / electrical / plumbing capex.
- Climate carrying-cost: extreme-heat days projected 7→21/yr by 2055 (HVAC capex compounding) — expect insurance premiums to compound above CPI over the hold.
Questions for the listing agent
- Built in 1945 — when were the roof, HVAC, electrical panel, plumbing, and water heater last replaced?
- Property tax is high relative to price — has the assessment been appealed recently, and will the sale trigger a re-assessment?
- Is there a deadline driving the sale (1031 exchange, divorce, estate, relocation)? That informs how much negotiation room exists.
- Schools are A-rated — typically a magnet for longer-tenancy family renters. What's the average tenant stay here, and is there a school-zone premium baked into asking?
- What's the average days-on-market for RENTAL listings here right now (not sales)? A rising rental-DOM trend means longer vacancies and softer asking-rent achievability than the comps imply.
- What's the recent tenant-quality profile in this submarket — average credit score on applications, eviction rate, late-payment / NSF rate, and stable-employment percentage? A property-management company in the area should have these aggregated.
- How much new for-sale + rental construction is in the pipeline within 1–3 miles? Heavy new supply typically softens prices + rents 12–24 months out; constrained supply supports both.
Investment metrics
- 1% rule
- 1.40% ✓
- Cap rate
- 9.27%
- Cash-on-cash
- 10.62%
- DSCR
- 1.47
- GRM
- 6.0
CMA / ARV
- ARV (on-the-fly)
- $192,719
- Comps found
- 6
Show comp detail 6 sales within ~0.75 mi
| Address | Dist | Beds/Ba | Sqft | Sold | Price | $/sf | Match |
|---|---|---|---|---|---|---|---|
| 137 W Zupan St | 0.23mi | 2/2.0 | 945 (-6%) | 7mo | $115,000 | $122 | 69 |
| 45 Duke Dr | 0.33mi | 2/1.5 | 1,060 (+5%) | 9mo | $240,000 | $226 | 67 |
| 6705 W Main St | 0.53mi | 3/1.0 (+1) | 1,040 (+3%) | 2mo | $198,800 | $191 | 64 |
| 6320 W Main St | 0.41mi | 3/1.0 (+1) | 1,100 (+9%) | 6mo | $185,000 | $168 | 56 |
| 2202 Williams St | 0.49mi | 2/1.0 | 928 (-8%) | 15mo | $167,500 | $180 | 52 |
| 905 Andra Dr | 0.73mi | 3/2.0 (+1) | 1,144 (+13%) | 8mo | $240,000 | $210 | 28 |
Match score weights: distance 35% · size 25% · config 20% · recency 20%. Top-matched comps best support the ARV.
Projected returns pro-forma
-3.0% appreciation · 3.0% rent growth · sell at horizon
- IRR
- -0.3%
- Equity multiple
- 0.99×
- Total profit
- $-221
- Equity at exit
- $11,183
- IRR
- 9.5%
- Equity multiple
- 1.73×
- Total profit
- $15,429
- Equity at exit
- $6,485
Cash invested: $21,000 (down + closing). Projections, not guarantees.
Landlord ↔ Tenant lean methodology
- Overall (STATE)
- 43 Moderately Tenant-Leaning
- State Illinois
- 43 Moderately Tenant-Leaning · D+7
- County
- — inherits STATE
- City
- — inherits STATE
ZIP-level market 62062
- Home prices YoY
- -2.5%
- Active inventory
- 27
- Price-to-rent
- 6.0×
Monthly cashflow live
- Estimated rent
- $1,050 medium interval (Pro) →
- Mortgage (P&I)
- −$393
- Tax from tax record
- −$219 /mo · $2,629/yr
- Insurance
- −$31
- HOA
- −$0
- Lot rent
- −$0
- Vacancy / Maint / Mgmt
- −$220
- Net cashflow
- $186
Break-even live
Sensitivity live
| Price | -10% $228 | -5% $207 | +0% $186 | +5% $165 | +10% $143 |
|---|---|---|---|---|---|
| Rent | -10% $103 | -5% $144 | +0% $186 | +5% $227 | +10% $269 |
| Rate | -1.0pp $224 | -0.5pp $205 | base $186 | +0.5pp $166 | +1.0pp $147 |
UW: 25.0% down · 7.5% · 30yr · 1.5% tax · 5.0% vac · 8.0% maint · 8.0% mgmt
Financing live
Cash to close
- Down payment
- $18,750
- Closing costs
- $2,250
- Reserves months
- —
- Total cash needed
- —
Loan-product check · same deal, 3 products live
Conventional
25% down · 7.5% · 30yr
- Down + closing
- —
- Monthly P&I
- —
- Monthly cashflow
- —
- DSCR
- —
- Eligible?
- —
Personal DTI + credit; lowest rate.
DSCR
20% down · 8.5% · 30yr
- Down + closing
- —
- Monthly P&I
- —
- Monthly cashflow
- —
- DSCR
- —
- Eligible?
- —
No personal income docs; deal must DSCR.
Hard money
10% down · 12.0% · 12mo
- Down + closing
- —
- Monthly P&I
- —
- Monthly cashflow
- —
- DSCR
- —
- Eligible?
- —
Short-term bridge; refi at stabilization.
Rent comps 1 comps
| Address | Beds | Baths | Sqft | Rent | $/sqft | DOM | Units | Dist |
|---|---|---|---|---|---|---|---|---|
| 115 Mary Dr #2 Maryville, IL | 2.0 | 1.0 | 750 | $1,050 | $1.40 | 21d | 1 | 0.39mi |
Listing history 16 events
-
2025-10-20status Pending
-
2025-10-20$75,000 Active
-
2025-02-05historical
-
2025-01-19historical Active Under Contract
-
2024-10-25price $122,000
-
2024-10-04price $129,900
-
2024-09-13$152,000 Active
-
2024-09-06historical
-
2019-09-20soldstatus $101,000
-
2019-09-18soldstatus 324-char remark
Show marketing remark (324 chars)
Well maintained home on corner lot. Gas fireplace in living room, updated bath and light fixtures. Newer entry door off kitchen, front door, front porch, tilt-in thermal windows. Large fenced back yard with shed, appliances include gas range, refrigerator, dishwasher, 3 ceiling fans. Move-in ready! Minutes from bike trail.
-
2019-09-18soldstatus Closed
Show marketing remark (324 chars)
Well maintained home on corner lot. Gas fireplace in living room, updated bath and light fixtures. Newer entry door off kitchen, front door, front porch, tilt-in thermal windows. Large fenced back yard with shed, appliances include gas range, refrigerator, dishwasher, 3 ceiling fans. Move-in ready! Minutes from bike trail.
-
2019-08-02status Pending
-
2019-07-11$99,900 Active
-
2019-07-10$99,900 324-char remark
Show marketing remark (324 chars)
Well maintained home on corner lot. Gas fireplace in living room, updated bath and light fixtures. Newer entry door off kitchen, front door, front porch, tilt-in thermal windows. Large fenced back yard with shed, appliances include gas range, refrigerator, dishwasher, 3 ceiling fans. Move-in ready! Minutes from bike trail.
-
2010-07-07soldstatus $85,000
-
2007-08-16soldstatus $50,000
ⓘ Source: listings_history table (triggers on properties + properties_extension) + one-shot
backfill from property_details.listing_events for pre-trigger history.
Tax reassessment forecast IL · Partial reset (capped growth)
- Current annual tax
- $2,629 · $219/mo
- Projected year-2 tax
- $2,629 · $219/mo
- Expected delta
- $0/yr ($0/mo · 0.0%)
ⓘ Screening estimate from a state-policy table — verify with the county assessor before closing.
Climate risk First Street
- Flood 1/10 Low 0% chance over 30 yrs
- Wildfire 1/10 Low
- Heat 5/10 Major 7 d/yr ≥107°F today · 21 d/yr by 30 yrs out
- Wind 2/10 Low 100% chance of damaging wind over 30 yrs
- Air quality 3/10 Moderate 3 unhealthy d/yr today · 4 by 30 yrs out
Nearby sold comps map
Loading sold comps map…
Walkable amenities ~0.75 mi
Loading nearby amenities…
Taxation est. · year 1
- Rental income
- $12,600
- − Mortgage interest
- −$4,201
- − Property taxes
- −$2,629
- − Insurance
- −$375
- − Repairs & maintenance
- −$1,008
- − Management
- −$1,008
- − Depreciation
- −$2,182
- Taxable income
- $1,197
- Est. tax owed @ 24.0%
- −$287
- After-tax cash flow
- $1,943/yr
For passive investors: Depreciation is non-cash, so a rental often shows a tax loss while cash-flowing — sheltering income. Rental losses are passive: they offset passive income freely, and up to $25,000/yr can offset ordinary (W-2) income if you actively participate and your MAGI is under $100k (phasing out to $0 by $150k); unused losses carry forward. On sale, claimed depreciation is recaptured at up to 25%, and gains may owe capital-gains tax (a 1031 exchange can defer both). Figures are a year-1 estimate at your 24.0% rate — not tax advice; consult a CPA.
Schools (NCES district)
- District
- Collinsville CUSD 10
- NCES district ID
- 1710650
- Math proficiency
- 14% ▼ -9.00%
- Reading proficiency
- 20% ▼ -7.00%
- Median HH income
- $52,504
- Composite
- 15.65/100
- National rank
- #9288
- State rank
- #465 of 620 in IL
Livability — Maryville
- Score
- 76/100
- State rank
- #197
- US rank
- #3649
Category grades
Schools grade is shown separately in the Schools card above.
Census & demographics
- Census place
- Maryville, IL
- City population
- 8,521
- Population (ZIP)
- 8,521
Population outlook (Madison County) Hauer SSP2
- Today (2025)
- 258,371 people
- By 2030
- 251,523 · -2.7%
- By 2040
- 233,640 · -9.6%
- By 2050
- 213,042 · -17.5%
- By 2075
- 165,255 · -36.0%
- By 2100
- 123,953 · -52.0%
Race, ethnicity, and origin ACS 2023
- Neighborhood character
- Predominantly White (87%)
- Race & ethnicity
- White 87% Black 6% Two or more races 4% Asian 2% Hispanic / Latino 2%
- Common ancestry
- Italian 5% Lithuanian 2% Romanian 2%
- Foreign-born
- 3% · Canada, China
- Languages at home
- 97% English-only · Other Asian/Pacific 1% Spanish 1% Tagalog/Filipino 1%
Political lean MEDSL · Madison
- 2024 margin
- R (+13.3) · D 42.5% · R 55.8% · Other 1.8%
- 2008→2024 swing
- -22.5pp toward R · 2008: 9.2pp · 2024: -13.3pp
- All cycles
- 2024: R+13.3 2020: R+13.2 2016: R+15.6 2012: R+1.4 2008: D+9.2
Not yet ingested
- Civics
- —
Market trends
- HPI YoY
- ▼ -6.32%
- Current HPI
- 242.989
- Rent YoY
- —
- Metro
- —
- State GDP YoY
- ▲ 1.59%
- F500 in state
- 60
Industry mix (Fortune 500 HQ in IL)
| Industry | F500 HQs | Revenue |
|---|---|---|
| Insurance | 4 | $201B |
|
||
| Consumer Goods | 4 | $87B |
|
||
| Industrial Machinery | 3 | $64B |
|
||
| Healthcare | 2 | $55B |
|
||
| Retail / Pharmacy | 1 | $148B |
|
||
| Agriculture / Food | 1 | $86B |
|
||
Price history
+50.0% since first listed16 events — show timeline
- 2025-10-20 Pending — MARIS as Distributed by MLS Grid
- 2025-10-20 Listed $75,000 MARIS as Distributed by MLS Grid
- 2025-02-05 Delisted — MARIS as Distributed by MLS Grid
- 2025-01-19 Contingent — MARIS as Distributed by MLS Grid
- 2024-10-25 Price Changed $122,000 MARIS as Distributed by MLS Grid
- 2024-10-04 Price Changed $129,900 MARIS as Distributed by MLS Grid
- 2024-09-13 Listed $152,000 MARIS as Distributed by MLS Grid
- 2024-09-06 Coming Soon — MARIS as Distributed by MLS Grid
- 2019-09-20 Sold (Public Records) $101,000 Public Records
- 2019-09-18 Sold (MLS) — MRED as Distributed by MLS Grid
- 2019-09-18 Sold (MLS) — MARIS as Distributed by MLS Grid
- 2019-08-02 Pending — MARIS as Distributed by MLS Grid
- 2019-07-11 Listed $99,900 MARIS as Distributed by MLS Grid
- 2019-07-10 Listed $99,900 MRED as Distributed by MLS Grid
- 2010-07-07 Sold (Public Records) $85,000 Public Records
- 2007-08-16 Sold (Public Records) $50,000 Public Records
Property tax history
+4.9%/yrLatest (2024): $2,629 · +9.1% YoY. Source: county tax records.
Cash-flow waterfall
monthlySold comps — $/sqft
last 12 mo · ≤1 miLoading sold comps…