6546 W NC 10 Hwy · Mountain View, NC
Flood risk 1/10 · Minimal
- FEMA flood zone
- X (unshaded)
- Chance of flooding over 30 yrs
- 0.0%
- Est. flood insurance / yr
- $507 – $1,088
Fire risk 4/10 · Minor
- Est. fire insurance / yr
- $906 – $1,684
Heat risk 5/10 · Moderate
- Hot days now (above 102°F)
- 7 days/yr
- Hot days in 30 yrs
- 17 days/yr
Wind risk 2/10 · Minimal
- Chance of severe wind over 30 yrs
- 2.0%
Air-quality risk 3/10 · Minor
- Unhealthy air days now
- 3 days/yr
- Unhealthy air days in 30 yrs
- 3 days/yr
Risk factors via First Street. Map © Google.
Why this score? — see what drove the C+ grade
The composite is a weighted blend of 9 inputs, each scored 0–100. Each bar is that input's sub-score; the figure is the points it added to the 100-point composite (weight × sub-score).
- Cash flow +25.8/30.0
- DSCR +8.6/10.0
- ARV discount +7.5/15.0
- 1% rule +6.2/10.0
- Schools +4.5/10.0
- Livability +3.2/5.0
- Condition / age +2.8/5.0
- Rent growth +2.5/5.0
- Appreciation +0.0/10.0
$148,900
🖨 Deal sheet 📄 Offer letter ✓ Due diligence
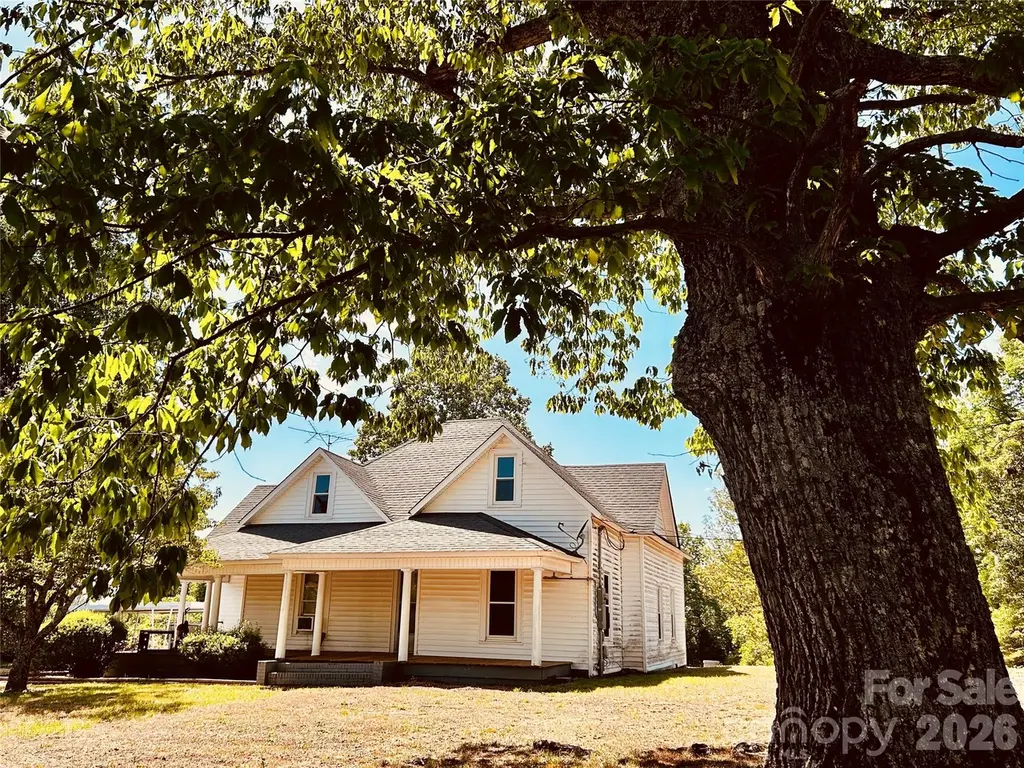
Listing remarks
Picturesque setting nestled in mature trees. Fabulous wrap around porch catches wonderful breezes and overlooks the large front yard and the pastoral view across the road. Several massive trees anchor this gorgeous setting on 1.37 acres. Enter into the Living Room. To the right is a room used as a third BR, but it does not have a closet - would make great office. Kitchen is at back of the house overlooking tranquil field and woods beyond the home's back yard. The primary bedroom has an adjoining room that would be great for extra closet expansion, sitting area, study, or for the future addition of a private bath. So much charm and history in great location. Fireplaces in home have been seal
Key facts
- Wrap around porch
- Adjoining room
- Large front yard
Tags
Property features AI
Finance
- Other: Lot approximately 1.37 acres
- HOA & community: No HOA
Exterior
- Parking: Detached carport; Has carport (no main-level garage)
- Utilities: Well water; Septic system installed; Electric service (implied)
- Home design: Single-family residence; Site-built construction; One story; R-40 zoning
- Construction: Vinyl and wood exterior; Crawl space foundation; Built on site (site-built)
- Exterior features: Front porch; Gravel and paved road access; Publicly maintained road
Interior
- Kitchen: Refrigerator included
- Bedrooms: 2 bedrooms (both on the main level)
- Bathrooms: 1 full bathroom (main level)
- Heating & cooling: Oil heating; Window unit(s) for cooling
- Interior features: 4 total rooms; Insulated windows
- Laundry & utility: Laundry closet; Laundry located on the porch
Neighborhood map
What this means for you Summary
Snapshot
- This is a 3-bed/1.0-bath single-family listed at $149k. Condition is rated average.
Deal economics
- At list price, monthly cash flow is $360 ($4k/yr) — positive.
- The deal already cash-flows at list — no discount required.
- Meets the 1% rule at list price ($2k rent vs $149k).
- Recommended offer: $144k (3.0% below list) — sets the bar for market timing.
- Cap rate 9.2% vs local median 3.3% in Mountain View — top-decile yield for the area; either an underpriced asset or a hidden risk that comps aren't pricing in. Stress-test before assuming the spread holds.
Location & tenants
- Location reads 64/100 on livability (#347 in NC) — a middle-class / working-renter tenant base. Strengths: cost of living A+, housing A+, crime A-; Watch: amenities F, commute F, health & safety F.
- Catawba County Schools (rural): math 54% / reading 51% proficiency, ranked #54 of 178 in NC (top 30%) — acceptable for families but not a draw, mixed tenant base, ~2y average lease.
- Zoned schools: Banoak Elementary (math 57% / reading 47%, grade C-, #354 of 1,410 statewide, top 28%, 291 students, 57% FRL); Fred T Foard High (math 77% / reading 61%, grade B, #131 of 535 statewide, top 25%, 956 students, 41% FRL).
- Market conditions: 50 active listings in the ZIP; 2,016 units permitted in Catawba County in 2024 (255 in 5+ unit buildings).
Forward outlook
- Local home prices are declining (-3.0%/yr); year-one equity from $1k of loan paydown is wiped out by about $4k of value loss. Plan a longer hold.
- Catawba County population projected to shrink 7% by 2050 — rents likely to lag national; underwrite the cash flow, not the appreciation.
Negotiation context
- It's been on market 55 days — a 3% lower offer ($144k) is reasonable based on typical stale-listing flexibility.
Risks & watch-outs
- Watch-outs: built in 1870 — expect roof / HVAC / electrical / plumbing capex.
- Climate carrying-cost: extreme-heat days projected 7→17/yr by 2055 (HVAC capex compounding) — expect insurance premiums to compound above CPI over the hold.
Questions for the listing agent
- It's been on market 55 days. Have you received any prior offers? Is the seller open to a 3% concession, seller financing, or rate buy-down credit?
- Built in 1870 — when were the roof, HVAC, electrical panel, plumbing, and water heater last replaced?
- Is there a deadline driving the sale (1031 exchange, divorce, estate, relocation)? That informs how much negotiation room exists.
- Schools are F-rated, which usually means shorter tenancies and higher turnover. Who's the typical renter profile here, and what's been the actual vacancy rate?
- What's the average days-on-market for RENTAL listings here right now (not sales)? A rising rental-DOM trend means longer vacancies and softer asking-rent achievability than the comps imply.
- What's the recent tenant-quality profile in this submarket — average credit score on applications, eviction rate, late-payment / NSF rate, and stable-employment percentage? A property-management company in the area should have these aggregated.
- How much new for-sale + rental construction is in the pipeline within 1–3 miles? Heavy new supply typically softens prices + rents 12–24 months out; constrained supply supports both.
Investment metrics
- 1% rule
- 1.12% ✓
- Cap rate
- 9.19%
- Cash-on-cash
- 10.35%
- DSCR
- 1.46
- GRM
- 7.4
CMA / ARV
- ARV (on-the-fly)
- $348,936
- Comps found
- 1
Show comp detail 1 sale within ~0.75 mi
| Address | Dist | Beds/Ba | Sqft | Sold | Price | $/sf | Match |
|---|---|---|---|---|---|---|---|
| 6328 W Nc 10 Hwy | 0.60mi | 3/2.0 | 1,674 (+4%) | 9mo | $363,000 | $217 | 54 |
Match score weights: distance 35% · size 25% · config 20% · recency 20%. Top-matched comps best support the ARV.
Projected returns pro-forma
-3.0% appreciation · 3.0% rent growth · sell at horizon
- IRR
- -0.8%
- Equity multiple
- 0.97×
- Total profit
- $-1,246
- Equity at exit
- $22,201
- IRR
- 8.9%
- Equity multiple
- 1.68×
- Total profit
- $28,338
- Equity at exit
- $12,874
Cash invested: $41,692 (down + closing). Projections, not guarantees.
Landlord ↔ Tenant lean methodology
- Overall (STATE)
- 85 Strongly Landlord-Friendly
- State North Carolina
- 85 Strongly Landlord-Friendly · R+3
- County
- — inherits STATE
- City
- — inherits STATE
ZIP-level market 28168
- Home prices YoY
- -12.6%
- Active inventory
- 50
- Price-to-rent
- 7.4×
Monthly cashflow live
- Estimated rent
- $1,674 medium interval (Pro) →
- Mortgage (P&I)
- −$781
- Tax from tax record
- −$120 /mo · $1,442/yr
- Insurance
- −$62
- HOA
- −$0
- Vacancy / Maint / Mgmt
- −$352
- Net cashflow
- $360
Break-even live
UW: 25.0% down · 7.5% · 30yr · 1.5% tax · 5.0% vac · 8.0% maint · 8.0% mgmt
Financing live
Cash to close
- Down payment
- $37,225
- Closing costs
- $4,467
- Reserves months
- —
- Total cash needed
- —
Loan-product check · same deal, 3 products live
Conventional
25% down · 7.5% · 30yr
- Down + closing
- —
- Monthly P&I
- —
- Monthly cashflow
- —
- DSCR
- —
- Eligible?
- —
Personal DTI + credit; lowest rate.
DSCR
20% down · 8.5% · 30yr
- Down + closing
- —
- Monthly P&I
- —
- Monthly cashflow
- —
- DSCR
- —
- Eligible?
- —
No personal income docs; deal must DSCR.
Hard money
10% down · 12.0% · 12mo
- Down + closing
- —
- Monthly P&I
- —
- Monthly cashflow
- —
- DSCR
- —
- Eligible?
- —
Short-term bridge; refi at stabilization.
Listing history 16 events
-
2026-06-18days on market $148,900 Active 55 DOM
-
2026-06-17days on market $148,900 Active 54 DOM
-
2026-06-16days on market $148,900 Active 53 DOM
-
2026-06-15days on market $148,900 Active 52 DOM
-
2026-06-13days on market $148,900 Active 50 DOM
-
2026-06-13days on market $148,900 Active 49 DOM
-
2026-06-09days on market $148,900 Active 46 DOM
-
2026-06-08days on market $148,900 Active 45 DOM
-
2026-06-07days on market $148,900 Active 44 DOM
-
2026-06-04days on market $148,900 Active 41 DOM
-
2026-06-03days on market $148,900 Active 40 DOM
-
2026-06-02days on market $148,900 Active 39 DOM
-
2026-06-01days on market $148,900 Active 38 DOM
-
2026-05-31days on market $148,900 Active 37 DOM
-
2026-04-28historical Active Under Contract
-
2026-04-24$148,900 Active
ⓘ Source: listings_history table (triggers on properties + properties_extension) + one-shot
backfill from property_details.listing_events for pre-trigger history.
Tax reassessment forecast NC · Resets to sale price
- Current annual tax
- $1,442 · $120/mo
- Projected year-2 tax
- $1,442 · $120/mo
- Expected delta
- $0/yr ($0/mo · 0.0%)
ⓘ Screening estimate from a state-policy table — verify with the county assessor before closing.
Climate risk First Street
- Flood 1/10 Low FEMA zone X (unshaded) · 0% chance over 30 yrs
- Wildfire 4/10 Moderate
- Heat 5/10 Major 7 d/yr ≥102°F today · 17 d/yr by 30 yrs out
- Wind 2/10 Low 2% chance of damaging wind over 30 yrs
- Air quality 3/10 Moderate 3 unhealthy d/yr today · 3 by 30 yrs out
Nearby sold comps map
Loading sold comps map…
Walkable amenities ~0.75 mi
Loading nearby amenities…
Taxation est. · year 1
- Rental income
- $20,089
- − Mortgage interest
- −$8,341
- − Property taxes
- −$1,442
- − Insurance
- −$744
- − Repairs & maintenance
- −$1,607
- − Management
- −$1,607
- − Depreciation
- −$4,332
- Taxable income
- $2,016
- Est. tax owed @ 24.0%
- −$484
- After-tax cash flow
- $3,830/yr
For passive investors: Depreciation is non-cash, so a rental often shows a tax loss while cash-flowing — sheltering income. Rental losses are passive: they offset passive income freely, and up to $25,000/yr can offset ordinary (W-2) income if you actively participate and your MAGI is under $100k (phasing out to $0 by $150k); unused losses carry forward. On sale, claimed depreciation is recaptured at up to 25%, and gains may owe capital-gains tax (a 1031 exchange can defer both). Figures are a year-1 estimate at your 24.0% rate — not tax advice; consult a CPA.
Condition & rehab AI · 12 photos
A charming single-family home with average condition, requiring cosmetic repairs and maintenance to enhance its resale and rental value.
Repairs flagged
- Minor Kitchen appliances — Older appliances need replacement.
- Minor Bathroom fixtures — Older fixtures need replacement.
- Minor Exterior siding — Weathered siding needs repainting or replacement.
- Minor Paint — Painted walls need touch-up or repainting.
- Minor Windows — Windows need cleaning or replacement.
- Minor Landscaping — Landscaping needs trimming and planting.
Value-add opportunities
- Both Painting and repainting — Enhances curb appeal and interior aesthetics.
- Both Landscaping — Improves curb appeal and enhances property value.
- Resale New kitchen appliances — Modernizes kitchen and attracts buyers.
- Resale New bathroom fixtures — Modernizes bathroom and attracts buyers.
- Resale New exterior siding — Enhances curb appeal and property value.
- Resale New windows — Enhances curb appeal and property value.
- Both HVAC system — Improves comfort and energy efficiency.
- Rental Landscaping — Enhances curb appeal and attracts renters.
Renovation cost estimate screening
| Repair item | Severity | Est. cost |
|---|---|---|
| Kitchen appliances · Older appliances need replacement. | Minor | $500–3,000 |
| Bathroom fixtures · Older fixtures need replacement. | Minor | $500–3,000 |
| Exterior siding · Weathered siding needs repainting or replacement. | Minor | $500–3,000 |
| Paint · Painted walls need touch-up or repainting. | Minor | $500–3,000 |
| Windows · Windows need cleaning or replacement. | Minor | $500–3,000 |
| Landscaping · Landscaping needs trimming and planting. | Minor | $500–3,000 |
| Total estimated repair cost · 6 items | $3,000–18,000 |
Value-add ROI direction
- Both Painting and repainting — Enhances curb appeal and interior aesthetics. ↑
- Both Landscaping — Improves curb appeal and enhances property value. ↑
- Resale New kitchen appliances — Modernizes kitchen and attracts buyers. ↑
- Resale New bathroom fixtures — Modernizes bathroom and attracts buyers. ↑
- Resale New exterior siding — Enhances curb appeal and property value. ↑
- Resale New windows — Enhances curb appeal and property value. ↑
- Both HVAC system — Improves comfort and energy efficiency. ↑
- Rental Landscaping — Enhances curb appeal and attracts renters. ↑
ⓘ Cost ranges are severity-bucket heuristics (US national rule-of-thumb). Get contractor quotes + a written scope before underwriting a rehab budget.
Schools (NCES district)
- District
- Catawba County Schools
- NCES district ID
- 3700690
- Math proficiency
- 54% ▲ 9.00%
- Reading proficiency
- 51% ▲ 3.00%
- Median HH income
- $48,180
- Composite
- 44.71/100
- National rank
- #2754
- State rank
- #54 of 178 in NC
Livability — Mountain View
- Score
- 64/100
- State rank
- #347
- US rank
- #13847
Category grades
Schools grade is shown separately in the Schools card above.
Census & demographics
- City population
- 29,273
- Population (ZIP)
- 10,436
Population outlook (Catawba County) Hauer SSP2
- Today (2025)
- 156,513 people
- By 2030
- 155,267 · -0.8%
- By 2040
- 151,110 · -3.5%
- By 2050
- 145,524 · -7.0%
- By 2075
- 134,047 · -14.4%
- By 2100
- 119,424 · -23.7%
Race, ethnicity, and origin ACS 2023
- Neighborhood character
- Predominantly White (84%)
- Race & ethnicity
- White 84% Hispanic / Latino 7% Two or more races 7% Black 6%
- Hispanic origin (detail)
- Mexican 5%
- Common ancestry
- Lithuanian 2% Scottish 1% Iranian 1%
- Foreign-born
- 6% · Canada, Guatemala
- Languages at home
- 95% English-only · Spanish 4% Other Asian/Pacific 1%
Political lean MEDSL · Catawba
- 2024 margin
- Solid R (+38.0) · D 30.6% · R 68.6%
- 2008→2024 swing
- -13.0pp toward R · 2008: -25.0pp · 2024: -38.0pp
- All cycles
- 2024: R+38.0 2020: R+37.0 2016: R+38.0 2012: R+29.6 2008: R+25.0
Not yet ingested
- Civics
- —
Market trends
- HPI YoY
- ▼ -41.82%
- Current HPI
- 289.1565
- Rent YoY
- —
- Metro
- —
- State GDP YoY
- ▲ 3.28%
- F500 in state
- 26
Industry mix (Fortune 500 HQ in NC)
| Industry | F500 HQs | Revenue |
|---|---|---|
| Financial Services | 2 | $213B |
|
||
| Retail | 2 | $95B |
|
||
| Industrial Conglomerate | 1 | $38B |
|
||
| Metals / Steel | 1 | $35B |
|
||
| Utilities | 1 | $30B |
|
||
| Industrial Machinery | 1 | $19B |
|
||
Price history
2 events — show timeline
- 2026-04-28 Contingent — CANOPYMLS as Distributed by MLS Grid
- 2026-04-24 Listed $148,900 CANOPYMLS as Distributed by MLS Grid
Property tax history
+5.7%/yrLatest (2024): $1,442 · +0.0% YoY. Source: county tax records.
Cash-flow waterfall
monthlySold comps — $/sqft
last 12 mo · ≤1 miLoading sold comps…