416 Pine Branch Ln · Magnolia, TX
Flood risk 1/10 · Minimal
- FEMA flood zone
- X (unshaded)
- Chance of flooding over 30 yrs
- 0.0%
- Est. flood insurance / yr
- $507 – $1,088
Fire risk 6/10 · Moderate
- Est. fire insurance / yr
- $1,222 – $2,270
Heat risk 8/10 · Major
- Hot days now (above 111°F)
- 7 days/yr
- Hot days in 30 yrs
- 20 days/yr
Wind risk 8/10 · Major
- Chance of severe wind over 30 yrs
- 99.0%
Air-quality risk 2/10 · Minimal
- Unhealthy air days now
- 1 days/yr
- Unhealthy air days in 30 yrs
- 1 days/yr
Risk factors via First Street. Map © Google.
Why this score? — see what drove the D grade
The composite is a weighted blend of 9 inputs, each scored 0–100. Each bar is that input's sub-score; the figure is the points it added to the 100-point composite (weight × sub-score).
- ARV discount +12.9/15.0
- Cash flow +10.0/30.0
- Condition / age +4.0/5.0
- Livability +3.7/5.0
- 1% rule +3.2/10.0
- Schools +2.9/10.0
- DSCR +2.8/10.0
- Rent growth +2.1/5.0
- Appreciation +0.0/10.0
$288,990
🖨 Deal sheet (PDF) 📄 Offer letter ✓ Due diligence
Listing remarks MLS
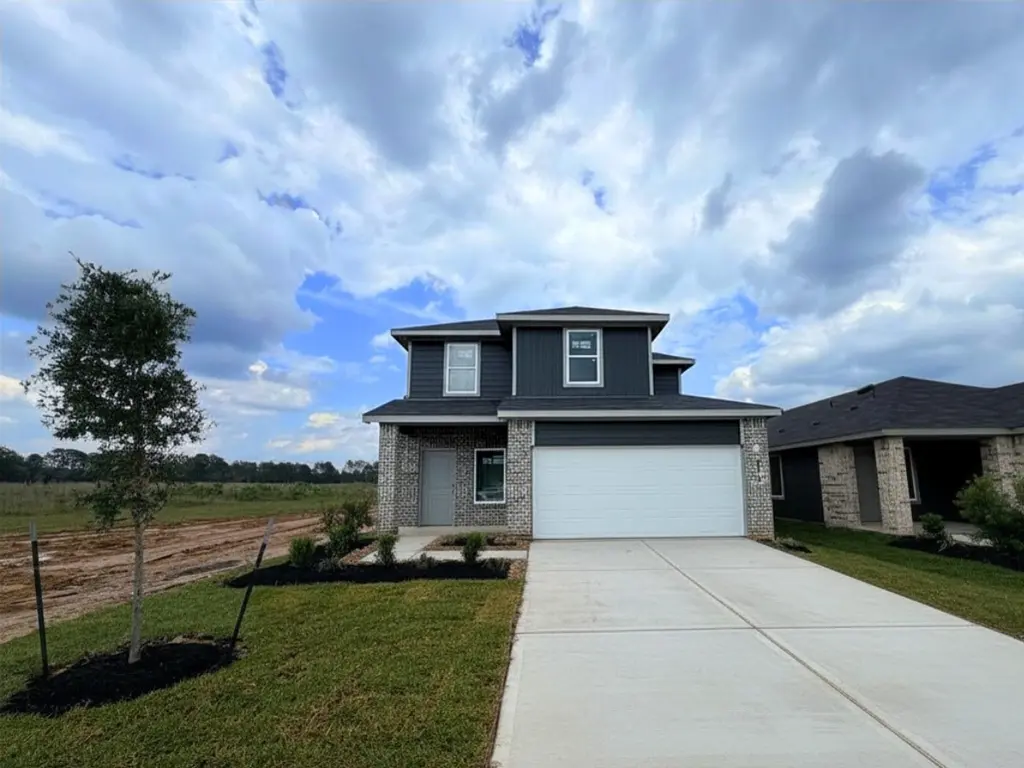
Lovely New D.R. Horton Two-Story Home in Maple Woods! Welcoming curb appeal! Spacious four-bedroom, two-and-a-half-bath layout designed for comfort and functionality. The open-concept family room and dining area flow seamlessly into the island kitchen—perfect for everyday living and effortless entertaining. The kitchen features 42” white shaker cabinetry and a large corner walk-in pantry for exceptional storage. The privately located primary suite offers a generously sized walk-in closet and a beautifully appointed bathroom with a glass encased oversized shower. Upstairs, enjoy a versatile game room ideal for gatherings, hobbies, or relaxation. Additional highlights include a convenient indoor utility room, a covered patio, and a full landscape package. Zoned to WISD! D.R. Horton—America’s #1 Homebuilder! Visit Maple Woods and make this stunning new home yours today!
Key facts
- 2 garage spots
- Built 2026
- Listed 72 days
Neighborhood map
What this means for you Summary
Snapshot
- This is a 4-bed/2.5-bath single-family listed at $289k. Condition is rated good.
Deal economics
- At list price, monthly cash flow is $-176 ($-2k/yr) — negative.
- To cash-flow at today's rent, offer at most $263k (8.8% below list).
- To meet the 1% rule (rent ≥ 1% of price), the offer needs to be $237k (18.0% below list).
- Recommended offer: $237k (18.0% below list) — sets the bar for 1% rule.
- Cap rate 5.6% vs local median 3.4% in Magnolia — top-decile yield for the area; either an underpriced asset or a hidden risk that comps aren't pricing in. Stress-test before assuming the spread holds.
Location & tenants
- Location reads 73/100 on livability (#222 in TX) — a middle-class / working-renter tenant base. Strengths: crime A+, cost of living A+, housing A+; Watch: amenities F, commute F.
- Waller ISD (rural): math 30% / reading 35% proficiency, ranked #532 of 826 in TX (top 64%) — families likely to look elsewhere, expect single-tenant / working-renter base with shorter leases.
- Zoned schools: Evelyn Turlington El (math 46% / reading 45%, grade D-, #1,112 of 4,322 statewide, top 26%, 1,084 students, 69% FRL); Schultz J H (math 31% / reading 37%, grade F, #892 of 1,662 statewide, top 55%, 1,120 students, 65% FRL); Waller H S (math 25% / reading 40%, grade F, #1,029 of 1,632 statewide, top 64%, 2,639 students, 62% FRL).
- Market conditions: Rents soft (-1.6%/yr); 1791 active listings in the ZIP; high-income renter base; 483 units permitted in Waller County in 2024 (89 in 5+ unit buildings).
Forward outlook
- Local home prices are declining (-3.0%/yr); year-one equity from $2k of loan paydown is wiped out by about $9k of value loss. Plan a longer hold.
- Waller County population projected at +62% by 2050 — long-run rental-demand tailwind backs the buy-and-hold thesis.
Negotiation context
- It's been on market 72 days — a 6% lower offer ($272k) is reasonable based on typical stale-listing flexibility.
Risks & watch-outs
- Climate carrying-cost: severe wind risk, 99% chance of damaging wind over 30y; major wildfire risk; extreme-heat days projected 7→20/yr by 2055 (HVAC capex compounding) — expect insurance premiums to compound above CPI over the hold.
Questions for the listing agent
- What do current leases actually rent for vs. the listed asking? Can we see a recent rent roll and the last 12 months of T-12 income?
- It's been on market 72 days. Have you received any prior offers? Is the seller open to a 18% concession, seller financing, or rate buy-down credit?
- What does the HOA fee cover, when was the last increase, and are there any pending special assessments or reserve-fund shortfalls?
- Why hasn't it sold? Are there any deal-killer items the seller is aware of (foundation, flood, title, zoning, code violations)?
- Is there a deadline driving the sale (1031 exchange, divorce, estate, relocation)? That informs how much negotiation room exists.
- Schools are D-rated, which usually means shorter tenancies and higher turnover. Who's the typical renter profile here, and what's been the actual vacancy rate?
- The area grade is low — what's the realistic commute time and amenity access for the typical tenant pool here? Any planned neighborhood developments (good or bad) we should know about?
- What's the average days-on-market for RENTAL listings here right now (not sales)? A rising rental-DOM trend means longer vacancies and softer asking-rent achievability than the comps imply.
- What's the recent tenant-quality profile in this submarket — average credit score on applications, eviction rate, late-payment / NSF rate, and stable-employment percentage? A property-management company in the area should have these aggregated.
- How much new for-sale + rental construction is in the pipeline within 1–3 miles? Heavy new supply typically softens prices + rents 12–24 months out; constrained supply supports both.
Investment metrics
- 1% rule
- 0.82% ✗
- Cap rate
- 5.56%
- Cash-on-cash
- -2.61%
- DSCR
- 0.88
- GRM
- 10.2
CMA / ARV
- ARV (median comp)
- $328,608
- List price
- $288,990
- Delta
- -12.06%
- Verdict
- UNDERPRICED
- Comps
- 20 within 1.0 mi
Show comp detail 3 sales within ~0.75 mi
| Address | Dist | Beds/Ba | Sqft | Sold | Price | $/sf | Match |
|---|---|---|---|---|---|---|---|
| 517 Wax Myrtle Way | 0.14mi | 4/3.0 | 2,041 (-0%) | 0mo | $314,990 | $154 | 91 |
| 105 Rising Cedar Ln | 0.12mi | 4/2.5 | 2,042 (0%) | 4mo | $303,990 | $149 | 91 |
| 553 Wax Myrtle Way | 0.14mi | 4/3.0 | 2,041 (-0%) | 2mo | $314,990 | $154 | 90 |
Match score weights: distance 35% · size 25% · config 20% · recency 20%. Top-matched comps best support the ARV.
Projected returns pro-forma
-3.0% appreciation · 0.0% rent growth · sell at horizon
- IRR
- -24.1%
- Equity multiple
- 0.20×
- Total profit
- $-64,923
- Equity at exit
- $43,089
- IRR
- -31.5%
- Equity multiple
- -0.21×
- Total profit
- $-97,535
- Equity at exit
- $24,987
Cash invested: $80,917 (down + closing). Projections, not guarantees.
Landlord ↔ Tenant lean methodology
- Overall (STATE)
- 87 Strongly Landlord-Friendly
- State Texas
- 87 Strongly Landlord-Friendly · R+5
- County
- — inherits STATE
- City
- — inherits STATE
ZIP-level market 77447
- Home prices YoY
- -31.1%
- Rents YoY
- -1.6%
- Active inventory
- 1791
- Price-to-rent
- 10.2×
Monthly cashflow live
- Estimated rent
- $2,368 medium interval (Pro) →
- Mortgage (P&I)
- −$1,515
- Tax est. 1.5%
- −$361 /mo · $4,335/yr
- Insurance
- −$120
- HOA
- −$50
- Vacancy / Maint / Mgmt
- −$497
- Net cashflow
- $-176
Break-even live
Sensitivity live
| Price | -10% $24 | -5% $-76 | +0% $-176 | +5% $-276 | +10% $-376 |
|---|---|---|---|---|---|
| Rent | -10% $-363 | -5% $-270 | +0% $-176 | +5% $-83 | +10% $11 |
| Rate | -1.0pp $-31 | -0.5pp $-103 | base $-176 | +0.5pp $-251 | +1.0pp $-327 |
UW: 25.0% down · 7.5% · 30yr · 1.5% tax · 5.0% vac · 8.0% maint · 8.0% mgmt
Financing live
Cash to close
- Down payment
- $72,248
- Closing costs
- $8,670
- Reserves months
- —
- Total cash needed
- —
Loan-product check · same deal, 3 products live
Conventional
25% down · 7.5% · 30yr
- Down + closing
- —
- Monthly P&I
- —
- Monthly cashflow
- —
- DSCR
- —
- Eligible?
- —
Personal DTI + credit; lowest rate.
DSCR
20% down · 8.5% · 30yr
- Down + closing
- —
- Monthly P&I
- —
- Monthly cashflow
- —
- DSCR
- —
- Eligible?
- —
No personal income docs; deal must DSCR.
Hard money
10% down · 12.0% · 12mo
- Down + closing
- —
- Monthly P&I
- —
- Monthly cashflow
- —
- DSCR
- —
- Eligible?
- —
Short-term bridge; refi at stabilization.
HOA detail
- Monthly dues
- $50 · $600/yr
Listing history 15 events
-
2026-06-21days on market $288,990 Active 72 DOM
-
2026-06-18days on market $288,990 Active 69 DOM
-
2026-06-17days on market $288,990 Active 68 DOM
-
2026-06-16days on market $288,990 Active 67 DOM
-
2026-06-15days on market $288,990 Active 66 DOM
-
2026-06-13days on market $288,990 Active 64 DOM
-
2026-06-09days on market $288,990 Active 60 DOM
-
2026-06-08days on market $288,990 Active 59 DOM
-
2026-06-07days on market $288,990 Active 58 DOM
-
2026-06-04days on market $288,990 Active 55 DOM
-
2026-06-03days on market $288,990 Active 54 DOM
-
2026-06-02days on market $288,990 Active 53 DOM
-
2026-06-01days on market $288,990 Active 52 DOM
-
2026-05-31days on market $288,990 Active 51 DOM
-
2026-04-10$288,990 Active 904-char remark
Show marketing remark (904 chars)
Lovely New D.R. Horton Two-Story Home in Maple Woods! Welcoming curb appeal! Spacious four-bedroom, two-and-a-half-bath layout designed for comfort and functionality. The open-concept family room and dining area flow seamlessly into the island kitchen—perfect for everyday living and effortless entertaining. The kitchen features 42” white shaker cabinetry and a large corner walk-in pantry for exceptional storage. The privately located primary suite offers a generously sized walk-in closet and a beautifully appointed bathroom with a glass encased oversized shower. Upstairs, enjoy a versatile game room ideal for gatherings, hobbies, or relaxation. Additional highlights include a convenient indoor utility room, a covered patio, and a full landscape package. Zoned to WISD! D.R. Horton—America’s #1 Homebuilder! Visit Maple Woods and make this stunning new home yours today!
ⓘ Source: listings_history table (triggers on properties + properties_extension) + one-shot
backfill from property_details.listing_events for pre-trigger history.
Climate risk First Street
- Flood 1/10 Low FEMA zone X (unshaded) · 0% chance over 30 yrs
- Wildfire 6/10 Major
- Heat 8/10 Severe 7 d/yr ≥111°F today · 20 d/yr by 30 yrs out
- Wind 8/10 Severe 99% chance of damaging wind over 30 yrs
- Air quality 2/10 Low 1 unhealthy d/yr today · 1 by 30 yrs out
Nearby sold comps map
Loading sold comps map…
Walkable amenities ~0.75 mi
Loading nearby amenities…
Taxation est. · year 1
- Rental income
- $28,420
- − Mortgage interest
- −$16,188
- − Property taxes
- −$4,335
- − Insurance
- −$1,445
- − Repairs & maintenance
- −$2,274
- − Management
- −$2,274
- − HOA
- −$600
- − Depreciation
- −$8,407
- Taxable loss
- −$7,102
- Est. tax savings @ 24.0%
- +$1,704
- After-tax cash flow
- $-410/yr
For passive investors: Depreciation is non-cash, so a rental often shows a tax loss while cash-flowing — sheltering income. Rental losses are passive: they offset passive income freely, and up to $25,000/yr can offset ordinary (W-2) income if you actively participate and your MAGI is under $100k (phasing out to $0 by $150k); unused losses carry forward. On sale, claimed depreciation is recaptured at up to 25%, and gains may owe capital-gains tax (a 1031 exchange can defer both). Figures are a year-1 estimate at your 24.0% rate — not tax advice; consult a CPA.
Condition & rehab AI · 1 photo
This D.R. Horton two-story home in Magnolia, TX, is in excellent condition with a good condition score of 80. It is move-in ready with minimal cosmetic updates needed to enhance its resale and rental value.
Value-add opportunities
- Both Painting interior and exterior — Fresh paint enhances curb appeal and interior aesthetics
- Both Landscaping and curb appeal improvements — Enhances curb appeal and makes the home more inviting
- Rental HVAC maintenance — Ensures comfort and energy efficiency for tenants
Renovation cost estimate screening
Value-add ROI direction
- Both Painting interior and exterior — Fresh paint enhances curb appeal and interior aesthetics ↑
- Both Landscaping and curb appeal improvements — Enhances curb appeal and makes the home more inviting ↑
- Rental HVAC maintenance — Ensures comfort and energy efficiency for tenants ↑
ⓘ Cost ranges are severity-bucket heuristics (US national rule-of-thumb). Get contractor quotes + a written scope before underwriting a rehab budget.
Schools (NCES district)
- District
- Waller ISD
- NCES district ID
- 4844430
- Math proficiency
- 30% ▼ -23.00%
- Reading proficiency
- 35% ▼ -11.00%
- Median HH income
- $58,911
- Composite
- 29.12/100
- National rank
- #6593
- State rank
- #532 of 826 in TX
Livability — Magnolia
- Score
- 73/100
- State rank
- #222
- US rank
- #5442
Category grades
Schools grade is shown separately in the Schools card above.
Census & demographics
- County
- Harris County · 4,702,590 people
- City population
- 3,226,434
- Metro
- Houston-The Woodlands-Sugar Land, TX
- Population (ZIP)
- 25,231
- Household income
- $116,925
- Rent vs Own
- Severe rent burden
- 265.0
Population outlook (Waller County) Hauer SSP2
- Today (2025)
- 60,772 people
- By 2030
- 67,616 · +11.3%
- By 2040
- 82,283 · +35.4%
- By 2050
- 98,276 · +61.7%
- By 2075
- 142,860 · +135.1%
- By 2100
- 175,596 · +188.9%
Race, ethnicity, and origin ACS 2023
- Neighborhood character
- Diverse neighborhood (Simpson 0.63)
- Race & ethnicity
- White 44% Hispanic / Latino 41% Two or more races 16% Black 9% Asian 1%
- Hispanic origin (detail)
- Mexican 27%
- Common ancestry
- Lithuanian 3% Slovak 1% Romanian 1%
- Foreign-born
- 15% · Canada, Jamaica, Dominican Republic
- Languages at home
- 69% English-only · Spanish 28% Other Indo-European 1% Vietnamese 1%
Political lean MEDSL · Waller
- 2024 margin
- Strong R (+25.0) · D 37.0% · R 62.0% · Other 1.0%
- 2008→2024 swing
- -17.9pp toward R · 2008: -7.2pp · 2024: -25.0pp
- All cycles
- 2024: R+25.0 2020: R+26.7 2016: R+28.6 2012: R+17.6 2008: R+7.2
Not yet ingested
- Civics
- —
Market trends
- HPI YoY
- ▼ -112.73%
- Current HPI
- 249.6969
- Rent YoY
- ▼ -1.58%
- Metro
- Houston-The Woodlands-Sugar Land, TX
- State GDP YoY
- ▲ 3.95%
- F500 in state
- 110
Industry mix (Fortune 500 HQ in TX)
| Industry | F500 HQs | Revenue |
|---|---|---|
| Energy | 16 | $1,198B |
|
||
| Technology | 5 | $198B |
|
||
| Engineering / Construction | 4 | $72B |
|
||
| Energy Services | 3 | $60B |
|
||
| Utilities | 3 | $41B |
|
||
| Healthcare | 2 | $330B |
|
||
Price history
1 event — show timeline
- 2026-04-10 Listed $288,990 HARMLS
Cash-flow waterfall
monthlySold comps — $/sqft
last 12 mo · ≤1 miLoading sold comps…