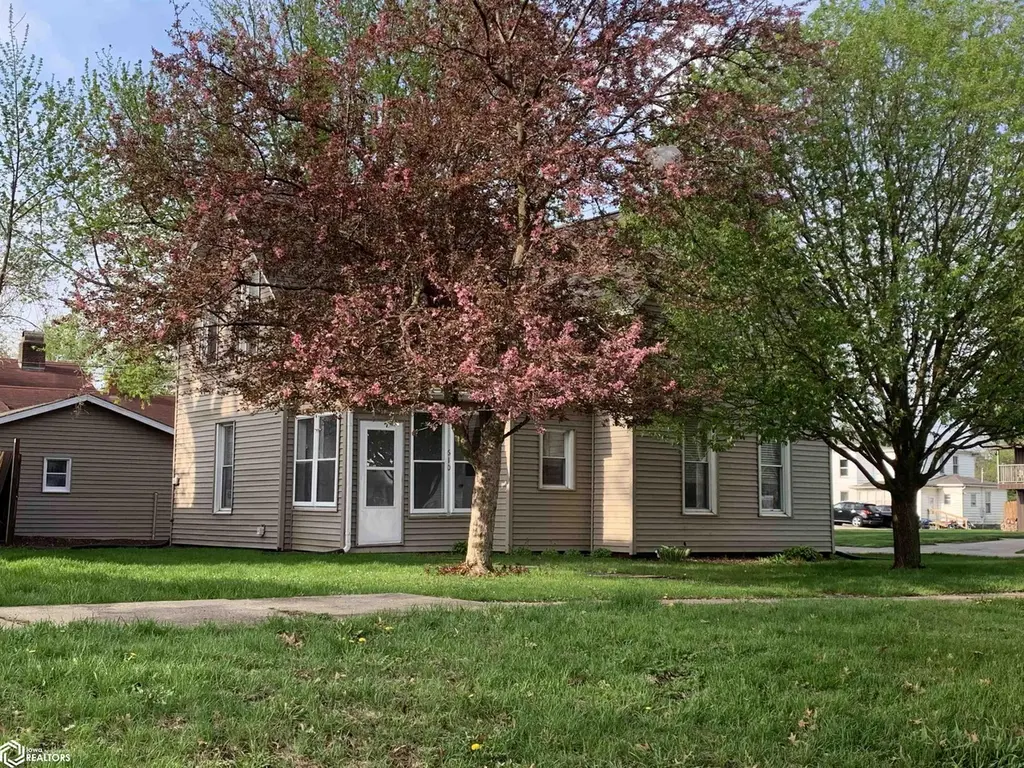
610 W Montgomery St · Creston, IA
Flood risk 1/10 · Minimal
- FEMA flood zone
- X (unshaded)
- Chance of flooding over 30 yrs
- 0.0%
- Est. flood insurance / yr
- $473 – $860
Fire risk 4/10 · Minor
- Est. fire insurance / yr
- $902 – $1,676
Heat risk 3/10 · Minor
- Hot days now (above 103°F)
- 7 days/yr
- Hot days in 30 yrs
- 15 days/yr
Wind risk 2/10 · Minimal
- Chance of severe wind over 30 yrs
- —
Air-quality risk 2/10 · Minimal
- Unhealthy air days now
- 0 days/yr
- Unhealthy air days in 30 yrs
- 1 days/yr
Risk factors via First Street. Map © Google.
Why this score? — see what drove the D- grade
The composite is a weighted blend of 9 inputs, each scored 0–100. Each bar is that input's sub-score; the figure is the points it added to the 100-point composite (weight × sub-score).
- Cash flow +13.5/30.0
- Schools +5.5/10.0
- DSCR +4.1/10.0
- Livability +4.0/5.0
- 1% rule +3.6/10.0
- Rent growth +2.5/5.0
- Condition / age +2.5/5.0
- ARV discount +0.0/15.0
- Appreciation +0.0/10.0
$147,500
🖨 Deal sheet (PDF) 📄 Offer letter ✓ Due diligence
Listing remarks MLS
HUD Case #161-228847. Great older 2 story in Creston—lots of space and nice potential. Convenient access to restaurants and conveniences. College town makes great potential investment property as well! School District: Creston Community
Key facts
- Remodeled
- New hvac
- Spacious kitchen
Tags
Neighborhood map
What this means for you Summary
Snapshot
- This is a 4-bed/1.0-bath single-family listed at $148k.
Deal economics
- At list price, monthly cash flow is $5 ($60/yr) — positive.
- The deal already cash-flows at list — no discount required.
- To meet the 1% rule (rent ≥ 1% of price), the offer needs to be $127k (14.2% below list).
- Recommended offer: $127k (14.2% below list) — sets the bar for 1% rule.
- Cap rate 6.3% vs local median 4.6% in Creston — top-decile yield for the area; either an underpriced asset or a hidden risk that comps aren't pricing in. Stress-test before assuming the spread holds.
Location & tenants
- Location reads 81/100 on livability (#76 in IA, #1,607 nationally) — a professional / high-income tenant draw. Strengths: cost of living A+, housing A+, health & safety A+; Watch: employment C-, amenities F.
- Creston Community School District (town): math 63% / reading 69% proficiency, ranked #195 of 289 in IA (top 68%) — acceptable for families but not a draw, mixed tenant base, ~2y average lease.
- Zoned schools: Creston Elementary School (math 60% / reading 49%, grade C, #462 of 616 statewide, top 79%, 410 students, 55% FRL); Creston Middle School (math 65% / reading 74%, grade A, #113 of 246 statewide, top 49%, 291 students, 60% FRL); Creston High School (math 63% / reading 78%, grade B+, #140 of 336 statewide, top 43%, 532 students, 46% FRL).
- Market conditions: 78 active listings in the ZIP; 5 units permitted in Union County in 2024 (0 in 5+ unit buildings).
Forward outlook
- Local home prices are declining (-3.0%/yr); year-one equity from $1k of loan paydown is wiped out by about $4k of value loss. Plan a longer hold.
Negotiation context
- Only 5 days on market — expect competitive offers; lowballing is unlikely to land.
- 2 sale attempts since 13y ago with the ask held roughly flat each time — persistent listings suggest the price (not the market) is what's stuck; bring a comps-based counter.
- Current owner paid $30k; list at $148k implies a 384% gain — meaningful room to come down on a strong offer.
Risks & watch-outs
- Watch-outs: built in 1890 — expect roof / HVAC / electrical / plumbing capex.
Questions for the listing agent
- Built in 1890 — when were the roof, HVAC, electrical panel, plumbing, and water heater last replaced?
- Is there a deadline driving the sale (1031 exchange, divorce, estate, relocation)? That informs how much negotiation room exists.
- Schools are B-rated — typically a magnet for longer-tenancy family renters. What's the average tenant stay here, and is there a school-zone premium baked into asking?
- The area grade is low — what's the realistic commute time and amenity access for the typical tenant pool here? Any planned neighborhood developments (good or bad) we should know about?
- What's the average days-on-market for RENTAL listings here right now (not sales)? A rising rental-DOM trend means longer vacancies and softer asking-rent achievability than the comps imply.
- What's the recent tenant-quality profile in this submarket — average credit score on applications, eviction rate, late-payment / NSF rate, and stable-employment percentage? A property-management company in the area should have these aggregated.
- How much new for-sale + rental construction is in the pipeline within 1–3 miles? Heavy new supply typically softens prices + rents 12–24 months out; constrained supply supports both.
Investment metrics
- 1% rule
- 0.86% ✗
- Cap rate
- 6.33%
- Cash-on-cash
- 0.14%
- DSCR
- 1.01
- GRM
- 9.7
CMA / ARV
- ARV (on-the-fly)
- $105,493
- Comps found
- 12
Show comp detail 12 sales within ~0.75 mi
| Address | Dist | Beds/Ba | Sqft | Sold | Price | $/sf | Match |
|---|---|---|---|---|---|---|---|
| 312 N Oak St | 0.28mi | 3/1.0 (-1) | 1,320 (+4%) | 6mo | $67,000 | $51 | 70 |
| 105 N Park St | 0.51mi | 3/2.0 (-1) | 1,270 (-0%) | 2mo | $265,000 | $209 | 65 |
| 1201 W Jefferson St | 0.38mi | 3/1.0 (-1) | 1,210 (-5%) | 6mo | $39,900 | $33 | 64 |
| 302 N Elm St | 0.31mi | 3/1.0 (-1) | 1,138 (-10%) | 1mo | $75,000 | $66 | 63 |
| 213 N Oak St | 0.26mi | 3/1.5 (-1) | 1,402 (+10%) | 6mo | $116,000 | $83 | 58 |
| 519 New York Ave | 0.44mi | 3/2.0 (-1) | 1,360 (+7%) | 2mo | $113,000 | $83 | 57 |
| 507 W Prairie St | 0.71mi | 3/1.0 (-1) | 1,296 (+2%) | 6mo | $149,750 | $116 | 54 |
| 500 N Elm St | 0.40mi | 3/1.5 (-1) | 1,440 (+13%) | 2mo | $141,000 | $98 | 50 |
| 606 S Elm St | 0.57mi | 3/2.0 (-1) | 1,172 (-8%) | 3mo | $165,500 | $141 | 49 |
| 506 S Birch St | 0.67mi | 4/1.0 | 1,126 (-11%) | 5mo | $82,500 | $73 | 45 |
| 410 N Pine St | 0.48mi | 3/1.0 (-1) | 1,460 (+15%) | 4mo | $73,000 | $50 | 45 |
| 1000 N Spruce St St | 0.71mi | 3/2.0 (-1) | 1,382 (+9%) | 4mo | $235,000 | $170 | 40 |
Match score weights: distance 35% · size 25% · config 20% · recency 20%. Top-matched comps best support the ARV.
Projected returns pro-forma
-3.0% appreciation · 3.0% rent growth · sell at horizon
- IRR
- -16.1%
- Equity multiple
- 0.43×
- Total profit
- $-23,581
- Equity at exit
- $21,993
- IRR
- -7.7%
- Equity multiple
- 0.51×
- Total profit
- $-20,110
- Equity at exit
- $12,753
Cash invested: $41,300 (down + closing). Projections, not guarantees.
Landlord ↔ Tenant lean methodology
- Overall (STATE)
- 83 Strongly Landlord-Friendly
- State Iowa
- 83 Strongly Landlord-Friendly · R+6
- County
- — inherits STATE
- City
- — inherits STATE
ZIP-level market 50801
- Home prices YoY
- -5.9%
- Active inventory
- 78
- Price-to-rent
- 9.7×
Monthly cashflow live
- Estimated rent
- $1,266 medium interval (Pro) →
- Mortgage (P&I)
- −$774
- Tax from tax record
- −$160 /mo · $1,920/yr
- Insurance
- −$61
- HOA
- −$0
- Vacancy / Maint / Mgmt
- −$266
- Net cashflow
- $5
Break-even live
Sensitivity live
| Price | -10% $88 | -5% $47 | +0% $5 | +5% $-37 | +10% $-79 |
|---|---|---|---|---|---|
| Rent | -10% $-95 | -5% $-45 | +0% $5 | +5% $55 | +10% $105 |
| Rate | -1.0pp $79 | -0.5pp $42 | base $5 | +0.5pp $-33 | +1.0pp $-72 |
UW: 25.0% down · 7.5% · 30yr · 1.5% tax · 5.0% vac · 8.0% maint · 8.0% mgmt
Financing live
Cash to close
- Down payment
- $36,875
- Closing costs
- $4,425
- Reserves months
- —
- Total cash needed
- —
Loan-product check · same deal, 3 products live
Conventional
25% down · 7.5% · 30yr
- Down + closing
- —
- Monthly P&I
- —
- Monthly cashflow
- —
- DSCR
- —
- Eligible?
- —
Personal DTI + credit; lowest rate.
DSCR
20% down · 8.5% · 30yr
- Down + closing
- —
- Monthly P&I
- —
- Monthly cashflow
- —
- DSCR
- —
- Eligible?
- —
No personal income docs; deal must DSCR.
Hard money
10% down · 12.0% · 12mo
- Down + closing
- —
- Monthly P&I
- —
- Monthly cashflow
- —
- DSCR
- —
- Eligible?
- —
Short-term bridge; refi at stabilization.
Listing history 4 events
-
2026-04-22status Pending
-
2026-04-17$147,500 Active
-
2013-05-24soldstatus $30,500 242-char remark
Show marketing remark (242 chars)
HUD Case #161-228847. Great older 2 story in Creston—lots of space and nice potential. Convenient access to restaurants and conveniences. College town makes great potential investment property as well! School District: Creston Community
-
2013-01-31$34,900 242-char remark
Show marketing remark (242 chars)
HUD Case #161-228847. Great older 2 story in Creston—lots of space and nice potential. Convenient access to restaurants and conveniences. College town makes great potential investment property as well! School District: Creston Community
ⓘ Source: listings_history table (triggers on properties + properties_extension) + one-shot
backfill from property_details.listing_events for pre-trigger history.
Tax reassessment forecast IA · Partial reset (capped growth)
- Current annual tax
- $1,920 · $160/mo
- Projected year-2 tax
- $2,118 · $176/mo
- Expected delta
- +$198/yr (+$16/mo · 10.3%)
ⓘ Screening estimate from a state-policy table — verify with the county assessor before closing.
Climate risk First Street
- Flood 1/10 Low FEMA zone X (unshaded) · 0% chance over 30 yrs
- Wildfire 4/10 Moderate
- Heat 3/10 Moderate 7 d/yr ≥103°F today · 15 d/yr by 30 yrs out
- Wind 2/10 Low
- Air quality 2/10 Low 0 unhealthy d/yr today · 1 by 30 yrs out
Nearby sold comps map
Loading sold comps map…
Walkable amenities ~0.75 mi
Loading nearby amenities…
Taxation est. · year 1
- Rental income
- $15,189
- − Mortgage interest
- −$8,262
- − Property taxes
- −$1,920
- − Insurance
- −$738
- − Repairs & maintenance
- −$1,215
- − Management
- −$1,215
- − Depreciation
- −$4,291
- Taxable loss
- −$2,452
- Est. tax savings @ 24.0%
- +$589
- After-tax cash flow
- $648/yr
For passive investors: Depreciation is non-cash, so a rental often shows a tax loss while cash-flowing — sheltering income. Rental losses are passive: they offset passive income freely, and up to $25,000/yr can offset ordinary (W-2) income if you actively participate and your MAGI is under $100k (phasing out to $0 by $150k); unused losses carry forward. On sale, claimed depreciation is recaptured at up to 25%, and gains may owe capital-gains tax (a 1031 exchange can defer both). Figures are a year-1 estimate at your 24.0% rate — not tax advice; consult a CPA.
Schools (NCES district)
- District
- Creston Community School District
- NCES district ID
- 1908310
- Math proficiency
- 63% ▬ 0.00%
- Reading proficiency
- 69% ▲ 4.00%
- Median HH income
- $42,292
- Composite
- 55.29/100
- National rank
- #1263
- State rank
- #195 of 289 in IA
Livability — Creston
- Score
- 81/100
- State rank
- #76
- US rank
- #1607
Category grades
Schools grade is shown separately in the Schools card above.
Census & demographics
- Census place
- Creston, IA
- Population (ZIP)
- 9,027
Population outlook (Union County) Hauer SSP2
- Today (2025)
- 12,536 people
- By 2030
- 12,561 · +0.2%
- By 2040
- 12,583 · +0.4%
- By 2050
- 12,543 · +0.1%
- By 2075
- 12,816 · +2.2%
- By 2100
- 12,754 · +1.7%
Race, ethnicity, and origin ACS 2023
- Neighborhood character
- Predominantly White (94%)
- Race & ethnicity
- White 94% Two or more races 3% Hispanic / Latino 2%
- Common ancestry
- Romanian 3% Slovak 2% Portuguese 2%
- Foreign-born
- 0%
- Languages at home
- 98% English-only · Spanish 1% German/W. Germanic 1%
Political lean MEDSL · Union
- 2024 margin
- Solid R (+36.2) · D 31.2% · R 67.4% · Other 1.3%
- 2008→2024 swing
- -39.9pp toward R · 2008: 3.7pp · 2024: -36.2pp
- All cycles
- 2024: R+36.2 2020: R+31.5 2016: R+27.8 2012: D+3.9 2008: D+3.7
Not yet ingested
- Civics
- —
Market trends
- HPI YoY
- ▼ -13.71%
- Current HPI
- 217.2057
- Rent YoY
- —
- Metro
- —
- State GDP YoY
- ▲ 2.48%
- F500 in state
- 4
Industry mix (Fortune 500 HQ in IA)
| Industry | F500 HQs | Revenue |
|---|---|---|
| Financial Services | 1 | $16B |
|
||
| Retail / Convenience | 1 | $15B |
|
||
Price history
+322.6% since first listed4 events — show timeline
- 2026-04-22 Pending — IAR
- 2026-04-17 Listed $147,500 IAR
- 2013-05-24 Sold (MLS) $30,500 DMMLS
- 2013-01-31 Listed $34,900 DMMLS
Property tax history
+2.3%/yrLatest (2025): $1,920 · +19.0% YoY. Source: county tax records.
Cash-flow waterfall
monthlySold comps — $/sqft
last 12 mo · ≤1 miLoading sold comps…