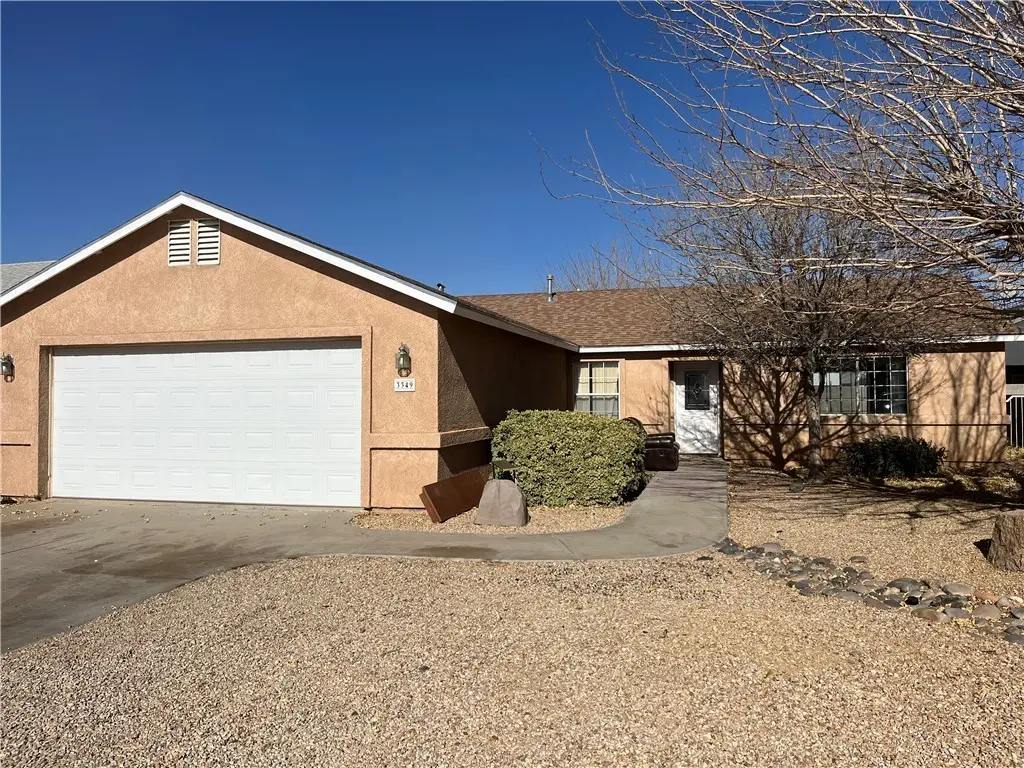
3349 E Ames Ave · New Kingman-Butler, AZ
Flood risk 1/10 · Minimal
- FEMA flood zone
- X (shaded)
- Chance of flooding over 30 yrs
- 0.0%
- Est. flood insurance / yr
- $507 – $1,088
Fire risk 7/10 · Major
- Est. fire insurance / yr
- $610 – $1,132
Heat risk 7/10 · Major
- Hot days now (above 100°F)
- 7 days/yr
- Hot days in 30 yrs
- 17 days/yr
Wind risk 1/10 · Minimal
- Chance of severe wind over 30 yrs
- —
Air-quality risk 1/10 · Minimal
- Unhealthy air days now
- 0 days/yr
- Unhealthy air days in 30 yrs
- 0 days/yr
Risk factors via First Street. Map © Google.
Why this score? — see what drove the D grade
The composite is a weighted blend of 9 inputs, each scored 0–100. Each bar is that input's sub-score; the figure is the points it added to the 100-point composite (weight × sub-score).
- Cash flow +13.0/30.0
- ARV discount +11.7/15.0
- DSCR +3.9/10.0
- 1% rule +2.7/10.0
- Rent growth +2.6/5.0
- Livability +2.5/5.0
- Condition / age +2.5/5.0
- Schools +1.8/10.0
- Appreciation +0.0/10.0
$237,899
🖨 Deal sheet (PDF) 📄 Offer letter ✓ Due diligence
Listing remarks MLS
GREAT HOME 3 BEDROOM 2 BATH WITH 2 CAR GARAGE. FULLY FENCED New interior paint. New carpet in all bedrooms and Living room.
Key facts
- 6,098 sq ft lot
- 2 garage spots
- Built 2005
Neighborhood map
What this means for you Summary
Snapshot
- This is a 3-bed/2.0-bath single-family listed at $238k.
Deal economics
- At list price, monthly cash flow is $-13 ($-158/yr) — negative.
- To cash-flow at today's rent, offer at most $236k (1.0% below list).
- To meet the 1% rule (rent ≥ 1% of price), the offer needs to be $184k (22.6% below list).
- Recommended offer: $184k (22.6% below list) — sets the bar for 1% rule.
- Cap rate 6.2% vs local median 4.3% in New Kingman-Butler — top-decile yield for the area; either an underpriced asset or a hidden risk that comps aren't pricing in. Stress-test before assuming the spread holds.
Location & tenants
- Location reads: area grade D — affects rentability + tenant quality, not the cash-flow math above.
- Kingman Unified School District (79598) (town): math 19% / reading 24% proficiency, ranked #179 of 249 in AZ (top 72%) — low school quality limits family demand, transient renter base, plan for 1-2y turnover.
- Zoned schools: Cerbat Elementary (math 9% / reading 15%, grade F, #963 of 1,109 statewide, top 87%, 700 students, 78% FRL); Kingman Middle School (math 10% / reading 13%, grade F, #180 of 218 statewide, top 83%, 737 students, 74% FRL); Kingman High School (math 4% / reading 6%, grade F, #364 of 381 statewide, top 100%, 905 students, 50% FRL).
- Zoned-school proficiency averages 10% at this address vs 22% district-wide (-12 pts) — the specific schools serving this property underperform the Kingman Unified School District (79598) average; the district grade overstates school quality for this exact location.
- Market conditions: Rents flat; 647 active listings in the ZIP; 8 comparable units currently listed for rent nearby; rentals lingering (median 46d on market — plan ~5-8 weeks vacancy on turnover, expect pricing pressure); 75% of comp listings sitting > 30 days — soft ceiling on asking rent; 2,543 units permitted in Mohave County in 2024 (33 in 5+ unit buildings).
- This rent runs 43% of the median local income ($51k/yr) — at the standard rent-burdened threshold; future hikes will face affordability resistance.
Forward outlook
- Local home prices are declining (-3.0%/yr); year-one equity from $2k of loan paydown is wiped out by about $7k of value loss. Plan a longer hold.
- Mohave County population projected to shrink 6% by 2050 — rents likely to lag national; underwrite the cash flow, not the appreciation.
Negotiation context
- It's been on market 288 days — a 12% lower offer ($209k) is reasonable based on typical stale-listing flexibility.
- Current owner paid $87k; list at $238k implies a 173% gain — meaningful room to come down on a strong offer.
Risks & watch-outs
- Climate carrying-cost: major wildfire risk; extreme-heat days projected 7→17/yr by 2055 (HVAC capex compounding) — expect insurance premiums to compound above CPI over the hold.
Questions for the listing agent
- What do current leases actually rent for vs. the listed asking? Can we see a recent rent roll and the last 12 months of T-12 income?
- It's been on market 288 days. Have you received any prior offers? Is the seller open to a 23% concession, seller financing, or rate buy-down credit?
- Why hasn't it sold? Are there any deal-killer items the seller is aware of (foundation, flood, title, zoning, code violations)?
- Is there a deadline driving the sale (1031 exchange, divorce, estate, relocation)? That informs how much negotiation room exists.
- The area grade is low — what's the realistic commute time and amenity access for the typical tenant pool here? Any planned neighborhood developments (good or bad) we should know about?
- What's the average days-on-market for RENTAL listings here right now (not sales)? A rising rental-DOM trend means longer vacancies and softer asking-rent achievability than the comps imply.
- What's the recent tenant-quality profile in this submarket — average credit score on applications, eviction rate, late-payment / NSF rate, and stable-employment percentage? A property-management company in the area should have these aggregated.
- How much new for-sale + rental construction is in the pipeline within 1–3 miles? Heavy new supply typically softens prices + rents 12–24 months out; constrained supply supports both.
Investment metrics
- 1% rule
- 0.77% ✗
- Cap rate
- 6.23%
- Cash-on-cash
- -0.24%
- DSCR
- 0.99
- GRM
- 10.8
CMA / ARV
- ARV (median comp)
- $262,525
- List price
- $237,899
- Delta
- -9.38%
- Verdict
- FAIR
- Comps
- 20 within 1.0 mi
Show comp detail 12 sales within ~0.75 mi
| Address | Dist | Beds/Ba | Sqft | Sold | Price | $/sf | Match |
|---|---|---|---|---|---|---|---|
| 3378 E Cane Dr | 0.18mi | 3/2.0 | 1,289 (-2%) | 2mo | $262,625 | $204 | 86 |
| 3453 E Cane Dr | 0.25mi | 3/2.0 | 1,289 (-2%) | 2mo | $262,500 | $204 | 83 |
| 3390 Rusty Spur Ave | 0.16mi | 3/2.0 | 1,397 (+6%) | 1mo | $271,527 | $194 | 82 |
| 3331 E Rusty Spur Ave | 0.11mi | 3/2.0 | 1,192 (-10%) | 1mo | $225,000 | $189 | 78 |
| 3385 E Cane Dr | 0.16mi | 3/2.0 | 1,205 (-8%) | 1mo | $249,000 | $207 | 78 |
| 3372 E Cane Dr | 0.18mi | 3/2.0 | 1,205 (-8%) | 1mo | $249,500 | $207 | 76 |
| 3379 E Cane Dr | 0.16mi | 3/2.0 | 1,472 (+12%) | 0mo | $286,500 | $195 | 73 |
| 3623 E Andrea Dr | 0.59mi | 3/2.0 | 1,290 (-2%) | 1mo | $248,000 | $192 | 68 |
| 3427 E Cane Dr | 0.21mi | 4/2.0 (+1) | 1,458 (+11%) | 2mo | $275,363 | $189 | 66 |
| 3509 E Lum Ave | 0.46mi | 3/2.0 | 1,175 (-11%) | 3mo | $227,000 | $193 | 58 |
| 3677 E Koval Dr | 0.67mi | 3/2.0 | 1,208 (-8%) | 1mo | $248,000 | $205 | 54 |
| 3150 E Northfield Ave | 0.75mi | 3/2.0 | 1,207 (-8%) | 2mo | $198,000 | $164 | 50 |
Match score weights: distance 35% · size 25% · config 20% · recency 20%. Top-matched comps best support the ARV.
Projected returns pro-forma
-3.0% appreciation · 0.33% rent growth · sell at horizon
- IRR
- -19.4%
- Equity multiple
- 0.34×
- Total profit
- $-44,289
- Equity at exit
- $35,472
- IRR
- -18.2%
- Equity multiple
- 0.12×
- Total profit
- $-58,721
- Equity at exit
- $20,569
Cash invested: $66,612 (down + closing). Projections, not guarantees.
Landlord ↔ Tenant lean methodology
- Overall (STATE)
- 87 Strongly Landlord-Friendly
- State Arizona
- 87 Strongly Landlord-Friendly · R+3
- County
- — inherits STATE
- City
- — inherits STATE
ZIP-level market 86409
- Rents YoY
- 0.3%
- Active inventory
- 647
- Price-to-rent
- 10.8×
Monthly cashflow live
- Estimated rent
- $1,842 high interval (Pro) →
- Mortgage (P&I)
- −$1,248
- Tax from tax record
- −$121 /mo · $1,457/yr
- Insurance
- −$99
- HOA
- −$0
- Vacancy / Maint / Mgmt
- −$387
- Net cashflow
- $-13
Break-even live
Sensitivity live
| Price | -10% $121 | -5% $54 | +0% $-13 | +5% $-81 | +10% $-148 |
|---|---|---|---|---|---|
| Rent | -10% $-159 | -5% $-86 | +0% $-13 | +5% $60 | +10% $132 |
| Rate | -1.0pp $107 | -0.5pp $47 | base $-13 | +0.5pp $-75 | +1.0pp $-138 |
UW: 25.0% down · 7.5% · 30yr · 1.5% tax · 5.0% vac · 8.0% maint · 8.0% mgmt
Financing live
Cash to close
- Down payment
- $59,475
- Closing costs
- $7,137
- Reserves months
- —
- Total cash needed
- —
Loan-product check · same deal, 3 products live
Conventional
25% down · 7.5% · 30yr
- Down + closing
- —
- Monthly P&I
- —
- Monthly cashflow
- —
- DSCR
- —
- Eligible?
- —
Personal DTI + credit; lowest rate.
DSCR
20% down · 8.5% · 30yr
- Down + closing
- —
- Monthly P&I
- —
- Monthly cashflow
- —
- DSCR
- —
- Eligible?
- —
No personal income docs; deal must DSCR.
Hard money
10% down · 12.0% · 12mo
- Down + closing
- —
- Monthly P&I
- —
- Monthly cashflow
- —
- DSCR
- —
- Eligible?
- —
Short-term bridge; refi at stabilization.
Rent comps 8 comps
| Address | Beds | Baths | Sqft | Rent | $/sqft | DOM | Units | Dist |
|---|---|---|---|---|---|---|---|---|
| 3356 E El Tovar Ave Kingman, AZ | 3.0 | 2.0 | 1356 | $1,975 | $1.46 | 45d | 1 | 0.03mi |
| 3597 E Koval Dr Kingman, AZ | 4.0 | 3.0 | 1811 | $2,200 | $1.21 | 45d | 1 | 0.51mi |
| 3665 E Koval Dr Kingman, AZ | 3.0 | 2.0 | 1400 | $1,665 | $1.19 | 15d | 1 | 0.63mi |
| 2995 E Ames Ave Kingman, AZ | 3.0 | 2.0 | 1221 | $1,250 | $1.02 | 46d | 1 | 0.72mi |
| 3858 E Ames Ave Kingman, AZ | 3.0 | 2.0 | 1631 | $1,550 | $0.95 | 45d | 1 | 1.01mi |
| 2658 E Punta Vista Kingman, AZ | 3.0 | 2.0 | 1205 | $1,700 | $1.41 | 45d | 1 | 1.13mi |
| 4786 E Old West Rd Kingman, AZ | 3.0 | 2.0 | 1513 | $1,700 | $1.12 | 22d | 1 | 1.44mi |
| 2381 E Butler Ave Kingman, AZ | 2.0 | 2.0 | 1152 | $1,200 | $1.04 | 45d | 1 | 1.48mi |
Listing history 19 events
-
2026-06-21days on market $237,899 Active 288 DOM
-
2026-06-18days on market $237,899 Active 285 DOM
-
2026-06-17days on market $237,899 Active 284 DOM
-
2026-06-16days on market $237,899 Active 283 DOM
-
2026-06-15days on market $237,899 Active 282 DOM
-
2026-06-14days on market $237,899 Active 280 DOM
-
2026-06-13days on market $237,899 Active 279 DOM
-
2026-06-10days on market $237,899 Active 277 DOM
-
2026-06-09days on market $237,899 Active 276 DOM
-
2026-06-08days on market $237,899 Active 275 DOM
-
2026-06-07days on market $237,899 Active 274 DOM
-
2026-06-05days on market $237,899 Active 271 DOM
-
2026-06-03days on market $237,899 Active 270 DOM
-
2026-06-02days on market $237,899 Active 269 DOM
-
2026-05-31days on market $237,899 Active 268 DOM
-
2026-05-30days on market $237,899 Active 267 DOM
-
2025-12-19price $237,899 123-char remark
Show marketing remark (123 chars)
GREAT HOME 3 BEDROOM 2 BATH WITH 2 CAR GARAGE. FULLY FENCED New interior paint. New carpet in all bedrooms and Living room.
-
2025-09-05$247,899 Active 123-char remark
Show marketing remark (123 chars)
GREAT HOME 3 BEDROOM 2 BATH WITH 2 CAR GARAGE. FULLY FENCED New interior paint. New carpet in all bedrooms and Living room.
-
2013-12-19soldstatus $87,200
ⓘ Source: listings_history table (triggers on properties + properties_extension) + one-shot
backfill from property_details.listing_events for pre-trigger history.
Tax reassessment forecast AZ · Resets to sale price
- Current annual tax
- $1,457 · $121/mo
- Projected year-2 tax
- $1,570 · $131/mo
- Expected delta
- +$113/yr (+$9/mo · 7.7%)
ⓘ Screening estimate from a state-policy table — verify with the county assessor before closing.
Climate risk First Street
- Flood 1/10 Low FEMA zone X (shaded) · 0% chance over 30 yrs
- Wildfire 7/10 Severe
- Heat 7/10 Severe 7 d/yr ≥100°F today · 17 d/yr by 30 yrs out
- Wind 1/10 Low
- Air quality 1/10 Low 0 unhealthy d/yr today · 0 by 30 yrs out
Nearby sold comps map
Loading sold comps map…
Walkable amenities ~0.75 mi
Loading nearby amenities…
Taxation est. · year 1
- Rental income
- $22,101
- − Mortgage interest
- −$13,326
- − Property taxes
- −$1,457
- − Insurance
- −$1,189
- − Repairs & maintenance
- −$1,768
- − Management
- −$1,768
- − Depreciation
- −$6,921
- Taxable loss
- −$4,329
- Est. tax savings @ 24.0%
- +$1,039
- After-tax cash flow
- $881/yr
For passive investors: Depreciation is non-cash, so a rental often shows a tax loss while cash-flowing — sheltering income. Rental losses are passive: they offset passive income freely, and up to $25,000/yr can offset ordinary (W-2) income if you actively participate and your MAGI is under $100k (phasing out to $0 by $150k); unused losses carry forward. On sale, claimed depreciation is recaptured at up to 25%, and gains may owe capital-gains tax (a 1031 exchange can defer both). Figures are a year-1 estimate at your 24.0% rate — not tax advice; consult a CPA.
Schools (NCES district)
- District
- Kingman Unified School District (79598)
- NCES district ID
- 0400295
- Math proficiency
- 19% ▼ -11.00%
- Reading proficiency
- 24% ▼ -9.00%
- Median HH income
- $36,760
- Composite
- 17.87/100
- National rank
- #9002
- State rank
- #179 of 249 in AZ
Livability — New Kingman-Butler
No livability data for this city. (Only ~50 U.S. cities are tracked.)
Census & demographics
- Census place
- New Kingman-Butler, AZ
- County
- Mohave County · 181,906 people
- Metro
- Lake Havasu City-Kingman, AZ
- Population (ZIP)
- 30,365
- Household income
- $50,852
- Rent vs Own
- Severe rent burden
- 688.0
Population outlook (Mohave County) Hauer SSP2
- Today (2025)
- 209,184 people
- By 2030
- 209,674 · +0.2%
- By 2040
- 205,897 · -1.6%
- By 2050
- 196,810 · -5.9%
- By 2075
- 169,454 · -19.0%
- By 2100
- 136,630 · -34.7%
Race, ethnicity, and origin ACS 2023
- Neighborhood character
- Predominantly White (76%)
- Race & ethnicity
- White 76% Hispanic / Latino 16% Two or more races 10% Native American 1%
- Hispanic origin (detail)
- Mexican 12%
- Common ancestry
- Lithuanian 3% Slovak 2% Portuguese 2%
- Foreign-born
- 6% · Canada
- Languages at home
- 92% English-only · Spanish 7%
Political lean MEDSL · Mohave
- 2024 margin
- Solid R (+55.8) · D 21.8% · R 77.6%
- 2008→2024 swing
- -22.9pp toward R · 2008: -32.9pp · 2024: -55.8pp
- All cycles
- 2024: R+55.8 2020: R+51.3 2016: R+51.5 2012: R+42.6 2008: R+32.9
Not yet ingested
- Civics
- —
Market trends
- HPI YoY
- ▼ -158.90%
- Current HPI
- 280.1884
- Rent YoY
- ▲ 0.33%
- Metro
- Lake Havasu City-Kingman, AZ
- State GDP YoY
- ▲ 4.54%
- F500 in state
- 20
Industry mix (Fortune 500 HQ in AZ)
| Industry | F500 HQs | Revenue |
|---|---|---|
| Technology | 2 | $13B |
|
||
| Mining / Metals | 1 | $23B |
|
||
| Environmental Services | 1 | $16B |
|
||
| Metals / Steel | 1 | $14B |
|
||
| Technology Distribution | 1 | $9B |
|
||
| Homebuilding | 1 | $8B |
|
||
Price history
+172.8% since first listed3 events — show timeline
- 2025-12-19 Price Changed $237,899 WARDEX
- 2025-09-05 Listed $247,899 WARDEX
- 2013-12-19 Sold (Public Records) $87,200 Public Records
Property tax history
+3.9%/yrLatest (2025): $1,457 · +1.8% YoY. Source: county tax records.
Cash-flow waterfall
monthlySold comps — $/sqft
last 12 mo · ≤1 miLoading sold comps…