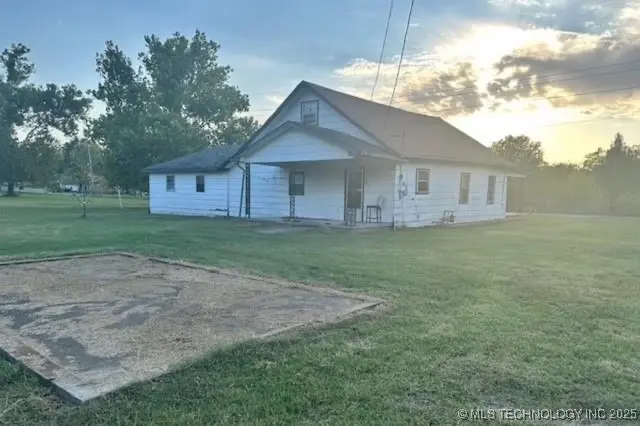
813 N Kern Ave · Okmulgee, OK
Flood risk 1/10 · Minimal
- FEMA flood zone
- X (unshaded)
- Chance of flooding over 30 yrs
- 0.0%
- Est. flood insurance / yr
- $507 – $1,088
Fire risk 8/10 · Major
- Est. fire insurance / yr
- $2,463 – $4,575
Heat risk 6/10 · Moderate
- Hot days now (above 111°F)
- 7 days/yr
- Hot days in 30 yrs
- 19 days/yr
Wind risk 3/10 · Minor
- Chance of severe wind over 30 yrs
- 6.0%
Air-quality risk 2/10 · Minimal
- Unhealthy air days now
- 1 days/yr
- Unhealthy air days in 30 yrs
- 2 days/yr
Risk factors via First Street. Map © Google.
Why this score? — see what drove the B- grade
The composite is a weighted blend of 9 inputs, each scored 0–100. Each bar is that input's sub-score; the figure is the points it added to the 100-point composite (weight × sub-score).
- Cash flow +30.0/30.0
- 1% rule +10.0/10.0
- DSCR +10.0/10.0
- ARV discount +7.5/15.0
- Livability +3.1/5.0
- Rent growth +2.5/5.0
- Condition / age +2.5/5.0
- Schools +0.4/10.0
- Appreciation +0.2/10.0
$55,000
🖨 Deal sheet (PDF) 📄 Offer letter ✓ Due diligence
Listing remarks
Ready to start building your Rental Portfolio? This property is being sold with 1101 N. Collins in Okmulgee. Asking price is $55,000.00 which includes both properties. This property is a large 3BR/1Bath home with upstairs bonus space and oversized attached two car garage on a very well kept corner lot. Would also be a great starter home if you don't mind doing some work. Motivated Sellers! Make an offer!
Key facts
- 0.34 acre lot
- Garage
- Built 1945
Neighborhood map
What this means for you Summary
Snapshot
- This is a 3-bed/1.0-bath single-family listed at $55k.
Deal economics
- At list price, monthly cash flow is $399 ($5k/yr) — positive.
- The deal already cash-flows at list — no discount required.
- Meets the 1% rule at list price ($986 rent vs $55k).
- Cap rate 15.0% vs local median 7.6% in Okmulgee — top-decile yield for the area; either an underpriced asset or a hidden risk that comps aren't pricing in. Stress-test before assuming the spread holds.
Location & tenants
- Location reads 61/100 on livability (#300 in OK) — a middle-class / working-renter tenant base. Strengths: cost of living A+, housing A+, health & safety A+; Watch: crime F, amenities F, commute F.
- Okmulgee (town): math 3% / reading 7% proficiency, ranked #264 of 270 in OK (top 98%) — low school quality limits family demand, transient renter base, plan for 1-2y turnover; 73% free/reduced lunch — lower-income household profile, screen leases tightly.
- Zoned schools: Okmulgee Primary Es (math 2% / reading 8%, grade F, #766 of 845 statewide, top 94%, 532 students, 0% FRL); Dunbar Intermediate Es (math 2% / reading 7%, grade F, #326 of 345 statewide, top 95%, 322 students, 0% FRL); Okmulgee Hs (math 5% / reading 5%, grade F, #430 of 447 statewide, top 99%, 331 students, 0% FRL) — zoned schools average 0% FRL vs 73% district-wide (73 pts lower); this property's tenant base skews higher-income than the district average.
- Market conditions: 147 active listings in the ZIP; 3 comparable units currently listed for rent nearby; rentals at typical pace (median 16d on market — plan ~3-4 weeks tenant-placement turnaround); 12 units permitted in Okmulgee County in 2024 (0 in 5+ unit buildings).
Forward outlook
- Local home prices are declining (-3.0%/yr); year-one equity from $380 of loan paydown is wiped out by about $2k of value loss. Plan a longer hold.
- Okmulgee County population projected at -13% by 2050 — secular population decline; favor cash flow + early exit over multi-decade hold.
- At projected returns (-3.0% appreciation + 3.0% rent growth), your $15k cash investment doubles in ~4 years — after that, you're playing with house money.
Negotiation context
- Only 5 days on market — expect competitive offers; lowballing is unlikely to land.
- 2 sale attempts since 2y ago with the ask held roughly flat each time — persistent listings suggest the price (not the market) is what's stuck; bring a comps-based counter.
Risks & watch-outs
- Watch-outs: built in 1945 — expect roof / HVAC / electrical / plumbing capex.
- Climate carrying-cost: severe wildfire risk; extreme-heat days projected 7→19/yr by 2055 (HVAC capex compounding) — expect insurance premiums to compound above CPI over the hold.
Questions for the listing agent
- Built in 1945 — when were the roof, HVAC, electrical panel, plumbing, and water heater last replaced?
- Is there a deadline driving the sale (1031 exchange, divorce, estate, relocation)? That informs how much negotiation room exists.
- Schools are F-rated, which usually means shorter tenancies and higher turnover. Who's the typical renter profile here, and what's been the actual vacancy rate?
- Crime grade is F in this area — have there been break-ins, vandalism, or insurance claims at this property in the last 3 years? What carrier currently insures it and at what premium?
- What's the average days-on-market for RENTAL listings here right now (not sales)? A rising rental-DOM trend means longer vacancies and softer asking-rent achievability than the comps imply.
- What's the recent tenant-quality profile in this submarket — average credit score on applications, eviction rate, late-payment / NSF rate, and stable-employment percentage? A property-management company in the area should have these aggregated.
- How much new for-sale + rental construction is in the pipeline within 1–3 miles? Heavy new supply typically softens prices + rents 12–24 months out; constrained supply supports both.
Investment metrics
- 1% rule
- 1.79% ✓
- Cap rate
- 14.99%
- Cash-on-cash
- 31.06%
- DSCR
- 2.38
- GRM
- 4.7
CMA / ARV
- ARV (on-the-fly)
- $135,642
- Comps found
- 12
Show comp detail 12 sales within ~0.75 mi
| Address | Dist | Beds/Ba | Sqft | Sold | Price | $/sf | Match |
|---|---|---|---|---|---|---|---|
| 1300 W 3rd St | 0.34mi | 3/2.0 | 1,485 (+3%) | 1mo | $140,000 | $94 | 74 |
| 305 N Taft Ave | 0.42mi | 3/1.0 | 1,548 (+7%) | 2mo | $32,500 | $21 | 66 |
| 901 N Seminole Ave | 0.59mi | 3/1.0 | 1,465 (+2%) | 10mo | $159,900 | $109 | 62 |
| 1106 N Alabama Ave | 0.48mi | 3/1.0 | 1,304 (-10%) | 3mo | $109,900 | $84 | 60 |
| 1225 W 5th St | 0.50mi | 3/2.0 | 1,424 (-1%) | 14mo | $175,000 | $123 | 59 |
| 602 N Collins Ave | 0.38mi | 2/2.0 (-1) | 1,333 (-8%) | 5mo | $75,000 | $56 | 57 |
| 911 N Kern Ave | 0.06mi | 2/2.0 (-1) | 1,261 (-13%) | 16mo | $69,999 | $56 | 54 |
| 1210 W 8th St | 0.70mi | 3/2.0 | 1,380 (-4%) | 15mo | $15,000 | $11 | 44 |
| 1119 W 7th St | 0.56mi | 2/1.0 (-1) | 1,283 (-11%) | 8mo | $139,000 | $108 | 44 |
| 1401 N Taft Ave | 0.60mi | 3/2.0 | 1,234 (-14%) | 3mo | $159,000 | $129 | 42 |
| 1218 N Oklahoma Ave | 0.45mi | 2/2.0 (-1) | 1,288 (-11%) | 15mo | $20,000 | $16 | 40 |
| 1103 N Alabama Ave | 0.50mi | 3/2.0 | 1,260 (-13%) | 15mo | $141,000 | $112 | 39 |
Match score weights: distance 35% · size 25% · config 20% · recency 20%. Top-matched comps best support the ARV.
Projected returns pro-forma
-3.0% appreciation · 3.0% rent growth · sell at horizon
- IRR
- 25.9%
- Equity multiple
- 2.07×
- Total profit
- $16,486
- Equity at exit
- $8,201
- IRR
- 33.5%
- Equity multiple
- 4.06×
- Total profit
- $47,101
- Equity at exit
- $4,755
Cash invested: $15,400 (down + closing). Projections, not guarantees.
Landlord ↔ Tenant lean methodology
- Overall (STATE)
- 83 Strongly Landlord-Friendly
- State Oklahoma
- 83 Strongly Landlord-Friendly · R+20
- County
- — inherits STATE
- City
- — inherits STATE
ZIP-level market 74447
- Home prices YoY
- -3.6%
- Active inventory
- 147
- Price-to-rent
- 4.7×
Monthly cashflow live
- Estimated rent
- $986 medium interval (Pro) →
- Mortgage (P&I)
- −$288
- Tax est. 1.5%
- −$69 /mo · $825/yr
- Insurance
- −$23
- HOA
- −$0
- Vacancy / Maint / Mgmt
- −$207
- Net cashflow
- $399
Break-even live
Sensitivity live
| Price | -10% $437 | -5% $418 | +0% $399 | +5% $380 | +10% $361 |
|---|---|---|---|---|---|
| Rent | -10% $321 | -5% $360 | +0% $399 | +5% $437 | +10% $476 |
| Rate | -1.0pp $426 | -0.5pp $413 | base $399 | +0.5pp $384 | +1.0pp $370 |
UW: 25.0% down · 7.5% · 30yr · 1.5% tax · 5.0% vac · 8.0% maint · 8.0% mgmt
Financing live
Cash to close
- Down payment
- $13,750
- Closing costs
- $1,650
- Reserves months
- —
- Total cash needed
- —
Loan-product check · same deal, 3 products live
Conventional
25% down · 7.5% · 30yr
- Down + closing
- —
- Monthly P&I
- —
- Monthly cashflow
- —
- DSCR
- —
- Eligible?
- —
Personal DTI + credit; lowest rate.
DSCR
20% down · 8.5% · 30yr
- Down + closing
- —
- Monthly P&I
- —
- Monthly cashflow
- —
- DSCR
- —
- Eligible?
- —
No personal income docs; deal must DSCR.
Hard money
10% down · 12.0% · 12mo
- Down + closing
- —
- Monthly P&I
- —
- Monthly cashflow
- —
- DSCR
- —
- Eligible?
- —
Short-term bridge; refi at stabilization.
Rent comps 3 comps
| Address | Beds | Baths | Sqft | Rent | $/sqft | DOM | Units | Dist |
|---|---|---|---|---|---|---|---|---|
| 118 N Taft Ave Okmulgee, OK | 3.0 | 2.0 | 1212 | $1,000 | $0.83 | 16d | 1 | 0.49mi |
| 1104 W 8th St Okmulgee, OK | 2.0 | 1.0 | 1084 | $850 | $0.78 | 5d | 1 | 0.67mi |
| 324 E 6th St Unit 214 Okmulgee, OK | 2.0 | 1.0 | 891 | $1,200 | $1.35 | 25d | 1 | 1.04mi |
Listing history 7 events
-
2025-06-23status Pending
-
2025-06-17$55,000 Active
-
2025-06-16historical
-
2025-02-10price $45,000
-
2025-01-25price $49,000
-
2024-12-11price $55,000
-
2024-11-03$59,000 Active
ⓘ Source: listings_history table (triggers on properties + properties_extension) + one-shot
backfill from property_details.listing_events for pre-trigger history.
Climate risk First Street
- Flood 1/10 Low FEMA zone X (unshaded) · 0% chance over 30 yrs
- Wildfire 8/10 Severe
- Heat 6/10 Major 7 d/yr ≥111°F today · 19 d/yr by 30 yrs out
- Wind 3/10 Moderate 6% chance of damaging wind over 30 yrs
- Air quality 2/10 Low 1 unhealthy d/yr today · 2 by 30 yrs out
Nearby sold comps map
Loading sold comps map…
Walkable amenities ~0.75 mi
Loading nearby amenities…
Taxation est. · year 1
- Rental income
- $11,827
- − Mortgage interest
- −$3,081
- − Property taxes
- −$825
- − Insurance
- −$275
- − Repairs & maintenance
- −$946
- − Management
- −$946
- − Depreciation
- −$1,600
- Taxable income
- $4,154
- Est. tax owed @ 24.0%
- −$997
- After-tax cash flow
- $3,785/yr
For passive investors: Depreciation is non-cash, so a rental often shows a tax loss while cash-flowing — sheltering income. Rental losses are passive: they offset passive income freely, and up to $25,000/yr can offset ordinary (W-2) income if you actively participate and your MAGI is under $100k (phasing out to $0 by $150k); unused losses carry forward. On sale, claimed depreciation is recaptured at up to 25%, and gains may owe capital-gains tax (a 1031 exchange can defer both). Figures are a year-1 estimate at your 24.0% rate — not tax advice; consult a CPA.
Schools (NCES district)
- District
- Okmulgee
- NCES district ID
- 4022800
- Math proficiency
- 3% ▼ -5.00%
- Reading proficiency
- 7% ▼ -8.00%
- Median HH income
- $31,078
- Composite
- 3.66/100
- National rank
- #10069
- State rank
- #264 of 270 in OK
Livability — Okmulgee
- Score
- 61/100
- State rank
- #300
- US rank
- #17773
Category grades
Schools grade is shown separately in the Schools card above.
Census & demographics
- Census place
- Okmulgee, OK
- Population (ZIP)
- 15,500
Population outlook (Okmulgee County) Hauer SSP2
- Today (2025)
- 37,543 people
- By 2030
- 36,528 · -2.7%
- By 2040
- 34,430 · -8.3%
- By 2050
- 32,498 · -13.4%
- By 2075
- 28,814 · -23.3%
- By 2100
- 25,193 · -32.9%
Race, ethnicity, and origin ACS 2023
- Neighborhood character
- Diverse neighborhood (Simpson 0.69)
- Race & ethnicity
- White 54% Native American 15% Two or more races 15% Black 13% Hispanic / Latino 4%
- Common ancestry
- Slovak 2% Italian 1% Romanian 1%
- Foreign-born
- 1%
- Languages at home
- 97% English-only · Spanish 1%
Political lean MEDSL · Okmulgee
- 2024 margin
- Solid R (+42.7) · D 27.7% · R 70.4% · Other 1.9%
- 2008→2024 swing
- -25.7pp toward R · 2008: -17.0pp · 2024: -42.7pp
- All cycles
- 2024: R+42.7 2020: R+37.1 2016: R+32.7 2012: R+17.5 2008: R+17.0
Not yet ingested
- Civics
- —
Market trends
- HPI YoY
- ▼ -9.69%
- Current HPI
- 257.2856
- Rent YoY
- —
- Metro
- —
- State GDP YoY
- ▲ 1.55%
- F500 in state
- 6
Industry mix (Fortune 500 HQ in OK)
| Industry | F500 HQs | Revenue |
|---|---|---|
| Energy | 3 | $48B |
|
||
Price history
-6.8% since first listed7 events — show timeline
- 2025-06-23 Pending — MLS Technology, Inc.
- 2025-06-17 Listed $55,000 MLS Technology, Inc.
- 2025-06-16 Listing Removed — MLS Technology, Inc.
- 2025-02-10 Price Changed $45,000 MLS Technology, Inc.
- 2025-01-25 Price Changed $49,000 MLS Technology, Inc.
- 2024-12-11 Price Changed $55,000 MLS Technology, Inc.
- 2024-11-03 Listed $59,000 MLS Technology, Inc.
Property tax history
-2.7%/yrLatest (2025): $61 · +1.7% YoY. Source: county tax records.
Cash-flow waterfall
monthlySold comps — $/sqft
last 12 mo · ≤1 miLoading sold comps…