215 S 7 Th St S · Beasley, TX
Flood risk No data
- FEMA flood zone
- —
- Chance of flooding over 30 yrs
- —
- Est. flood insurance / yr
- —
Fire risk No data
- Est. fire insurance / yr
- —
Heat risk No data
- Hot days now (above threshold)
- —
- Hot days in 30 yrs
- —
Wind risk No data
- Chance of severe wind over 30 yrs
- —
Air-quality risk No data
- Unhealthy air days now
- —
- Unhealthy air days in 30 yrs
- —
Risk factors via First Street. Map © Google.
Why this score? — see what drove the D grade
The composite is a weighted blend of 9 inputs, each scored 0–100. Each bar is that input's sub-score; the figure is the points it added to the 100-point composite (weight × sub-score).
- Cash flow +9.0/30.0
- Appreciation +7.1/10.0
- ARV discount +5.8/15.0
- Schools +4.6/10.0
- Condition / age +4.0/5.0
- Livability +2.9/5.0
- 1% rule +2.8/10.0
- DSCR +2.5/10.0
- Rent growth +2.5/5.0
$275,000
🖨 Deal sheet (PDF) 📄 Offer letter ✓ Due diligence
Listing remarks MLS
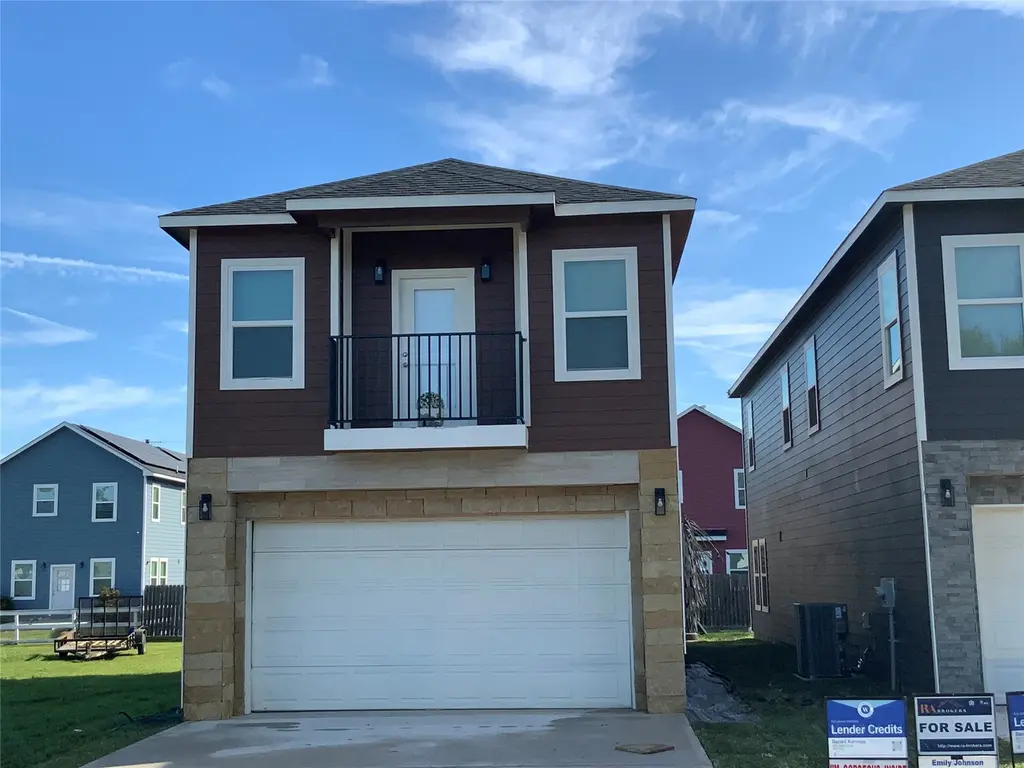
Quiet community found in the city of Beasley, Texas. No HOA, no MUD fees, and a very Low Tax rate. This property has a 10-foot ceiling on the first floor and a 9-foot-ceiling on the second floor, where you can walk out onto the balcony and enjoy the view. It also has a custom-made shower in an oversized primary bedroom. Other specialty features of this home includes a 14-piers (12 x 12 x 36) support system beneath the foundation, granite countertops throughout, walk-in closets, ample cabinet space, and an open floor plan to maximize the living space. 219 S 7th St is a must-see home, 5 minutes from Brazos Town Center and 30 seconds from Hwy I-69/59 S.
Key facts
- 9 foot ceiling
- Custom made shower
- No mud fees
Tags
Neighborhood map
What this means for you Summary
Snapshot
- This is a 3-bed/2.5-bath single-family listed at $275k. Condition is rated good.
Deal economics
- At list price, monthly cash flow is $-214 ($-3k/yr) — negative.
- To cash-flow at today's rent, offer at most $244k (11.3% below list).
- To meet the 1% rule (rent ≥ 1% of price), the offer needs to be $213k (22.4% below list).
- Recommended offer: $213k (22.4% below list) — sets the bar for 1% rule.
Location & tenants
- Location reads 57/100 on livability (#1,273 in TX) — a working-class tenant base; expect higher turnover. Strengths: cost of living A+, crime A; Watch: employment C-, amenities F, commute F.
- Lamar CISD (suburban): math 50% / reading 53% proficiency, ranked #116 of 826 in TX (top 14%) — acceptable for families but not a draw, mixed tenant base, ~2y average lease.
- Zoned schools: Beasley El (math 42% / reading 27%, grade F, #1,995 of 4,322 statewide, top 50%, 366 students, 86% FRL); George J H (math 27% / reading 28%, grade F, #1,156 of 1,662 statewide, top 71%, 1,173 students, 81% FRL); B F Terry H S (math 34% / reading 41%, grade F, #888 of 1,632 statewide, top 55%, 1,739 students, 74% FRL) — zoned schools average 80% FRL vs 43% district-wide (38 pts higher); higher-poverty schools than district average — tighter screening recommended.
- Zoned-school proficiency averages 33% at this address vs 52% district-wide (-18 pts) — the specific schools serving this property underperform the Lamar CISD average; the district grade overstates school quality for this exact location.
- Market conditions: 232 active listings in the ZIP; 2 comparable units currently listed for rent nearby; 12,093 units permitted in Fort Bend County in 2024 (815 in 5+ unit buildings).
Forward outlook
- In year one you build about $13k of equity ($2k loan paydown + $11k appreciation (4.2% local appreciation)).
- Fort Bend County population projected at +75% by 2050 — long-run rental-demand tailwind backs the buy-and-hold thesis.
- By year 3, paydown + projected appreciation supports a ~$33k cash-out refi (75% LTV) — recoverable capital for the next deal without selling this one.
Negotiation context
- It's been on market 74 days — a 6% lower offer ($258k) is reasonable based on typical stale-listing flexibility.
Questions for the listing agent
- What do current leases actually rent for vs. the listed asking? Can we see a recent rent roll and the last 12 months of T-12 income?
- It's been on market 74 days. Have you received any prior offers? Is the seller open to a 22% concession, seller financing, or rate buy-down credit?
- Why hasn't it sold? Are there any deal-killer items the seller is aware of (foundation, flood, title, zoning, code violations)?
- Is there a deadline driving the sale (1031 exchange, divorce, estate, relocation)? That informs how much negotiation room exists.
- Schools are D-rated, which usually means shorter tenancies and higher turnover. Who's the typical renter profile here, and what's been the actual vacancy rate?
- The area grade is low — what's the realistic commute time and amenity access for the typical tenant pool here? Any planned neighborhood developments (good or bad) we should know about?
- What's the average days-on-market for RENTAL listings here right now (not sales)? A rising rental-DOM trend means longer vacancies and softer asking-rent achievability than the comps imply.
- What's the recent tenant-quality profile in this submarket — average credit score on applications, eviction rate, late-payment / NSF rate, and stable-employment percentage? A property-management company in the area should have these aggregated.
- How much new for-sale + rental construction is in the pipeline within 1–3 miles? Heavy new supply typically softens prices + rents 12–24 months out; constrained supply supports both.
Investment metrics
- 1% rule
- 0.78% ✗
- Cap rate
- 5.36%
- Cash-on-cash
- -3.34%
- DSCR
- 0.85
- GRM
- 10.7
CMA / ARV
- ARV (median comp)
- $265,242
- List price
- $275,000
- Delta
- 3.68%
- Verdict
- FAIR
- Comps
- 20 within 1.0 mi
Show comp detail 12 sales within ~0.75 mi
| Address | Dist | Beds/Ba | Sqft | Sold | Price | $/sf | Match |
|---|---|---|---|---|---|---|---|
| 422 Tejas Village Pkwy | 0.41mi | 4/2.5 (+1) | 2,049 (+2%) | 2mo | $304,503 | $149 | 70 |
| 430 Tejas Village Pkwy | 0.42mi | 4/3.0 (+1) | 2,125 (+6%) | 4mo | $343,003 | $161 | 59 |
| 518 Tejas Village Pkwy | 0.47mi | 4/3.0 (+1) | 2,084 (+4%) | 7mo | $346,229 | $166 | 59 |
| 823 Tejas Village Pkwy | 0.68mi | 4/2.5 (+1) | 2,049 (+2%) | 1mo | $324,916 | $159 | 58 |
| 506 Tejas Village Pkwy | 0.45mi | 4/3.0 (+1) | 2,084 (+4%) | 9mo | $340,858 | $164 | 58 |
| 418 N 4th St | 0.36mi | 3/2.5 | 1,700 (-15%) | 2mo | $249,999 | $147 | 56 |
| 422 N 4th St | 0.36mi | 3/2.5 | 1,700 (-15%) | 2mo | $249,999 | $147 | 56 |
| 8011 Alamo Ct | 0.50mi | 4/2.5 (+1) | 2,049 (+2%) | 15mo | $318,266 | $155 | 55 |
| 426 Tejas Village Pkwy | 0.42mi | 4/3.0 (+1) | 2,084 (+4%) | 14mo | $338,064 | $162 | 55 |
| 402 N 4th St | 0.36mi | 3/2.5 | 1,700 (-15%) | 8mo | $269,900 | $159 | 52 |
| 414 N 4th St | 0.36mi | 3/2.5 | 1,700 (-15%) | 8mo | $269,900 | $159 | 52 |
| 723 Tejas Village Pkwy | 0.62mi | 4/3.0 (+1) | 2,084 (+4%) | 8mo | $315,773 | $152 | 51 |
Match score weights: distance 35% · size 25% · config 20% · recency 20%. Top-matched comps best support the ARV.
Projected returns pro-forma
4.15% appreciation · 3.0% rent growth · sell at horizon
- IRR
- 7.8%
- Equity multiple
- 1.48×
- Total profit
- $36,668
- Equity at exit
- $141,899
- IRR
- 9.9%
- Equity multiple
- 2.68×
- Total profit
- $129,589
- Equity at exit
- $234,081
Cash invested: $77,000 (down + closing). Projections, not guarantees.
Landlord ↔ Tenant lean methodology
- Overall (STATE)
- 87 Strongly Landlord-Friendly
- State Texas
- 87 Strongly Landlord-Friendly · R+5
- County
- — inherits STATE
- City
- — inherits STATE
ZIP-level market 77417
- Home prices YoY
- 1.2%
- Active inventory
- 232
- Price-to-rent
- 10.7×
Monthly cashflow live
- Estimated rent
- $2,134 medium interval (Pro) →
- Mortgage (P&I)
- −$1,442
- Tax est. 1.5%
- −$344 /mo · $4,125/yr
- Insurance
- −$115
- HOA
- −$0
- Vacancy / Maint / Mgmt
- −$448
- Net cashflow
- $-214
Break-even live
Sensitivity live
| Price | -10% $-24 | -5% $-119 | +0% $-214 | +5% $-309 | +10% $-404 |
|---|---|---|---|---|---|
| Rent | -10% $-383 | -5% $-299 | +0% $-214 | +5% $-130 | +10% $-46 |
| Rate | -1.0pp $-76 | -0.5pp $-144 | base $-214 | +0.5pp $-285 | +1.0pp $-358 |
UW: 25.0% down · 7.5% · 30yr · 1.5% tax · 5.0% vac · 8.0% maint · 8.0% mgmt
Financing live
Cash to close
- Down payment
- $68,750
- Closing costs
- $8,250
- Reserves months
- —
- Total cash needed
- —
Loan-product check · same deal, 3 products live
Conventional
25% down · 7.5% · 30yr
- Down + closing
- —
- Monthly P&I
- —
- Monthly cashflow
- —
- DSCR
- —
- Eligible?
- —
Personal DTI + credit; lowest rate.
DSCR
20% down · 8.5% · 30yr
- Down + closing
- —
- Monthly P&I
- —
- Monthly cashflow
- —
- DSCR
- —
- Eligible?
- —
No personal income docs; deal must DSCR.
Hard money
10% down · 12.0% · 12mo
- Down + closing
- —
- Monthly P&I
- —
- Monthly cashflow
- —
- DSCR
- —
- Eligible?
- —
Short-term bridge; refi at stabilization.
Rent comps 2 comps
| Address | Beds | Baths | Sqft | Rent | $/sqft | DOM | Units | Dist |
|---|---|---|---|---|---|---|---|---|
| 119 S 8th St Beasley, TX | 3.0 | 2.0 | 1680 | $1,680 | $1.00 | 26d | 1 | 0.09mi |
| 402 N 4th St Beasley, TX | 3.0 | 2.5 | 1700 | $3,750 | $2.21 | 0d | 1 | 0.36mi |
Listing history 16 events
-
2026-06-21days on market $275,000 Active 74 DOM
-
2026-06-18days on market $275,000 Active 71 DOM
-
2026-06-17days on market $275,000 Active 70 DOM
-
2026-06-16days on market $275,000 Active 69 DOM
-
2026-06-15days on market $275,000 Active 68 DOM
-
2026-06-13pricedays on market $275,000 Active 66 DOM
-
2026-06-10days on market $265,000 Active 62 DOM
-
2026-06-08days on market $265,000 Active 61 DOM
-
2026-06-07days on market $265,000 Active 60 DOM
-
2026-06-04days on market $265,000 Active 57 DOM
-
2026-06-03days on market $265,000 Active 56 DOM
-
2026-06-02days on market $265,000 Active 55 DOM
-
2026-06-01days on market $265,000 Active 54 DOM
-
2026-05-31days on market $265,000 Active 53 DOM
-
2026-05-19price $265,000 658-char remark
Show marketing remark (658 chars)
Quiet community found in the city of Beasley, Texas. No HOA, no MUD fees, and a very Low Tax rate. This property has a 10-foot ceiling on the first floor and a 9-foot-ceiling on the second floor, where you can walk out onto the balcony and enjoy the view. It also has a custom-made shower in an oversized primary bedroom. Other specialty features of this home includes a 14-piers (12 x 12 x 36) support system beneath the foundation, granite countertops throughout, walk-in closets, ample cabinet space, and an open floor plan to maximize the living space. 219 S 7th St is a must-see home, 5 minutes from Brazos Town Center and 30 seconds from Hwy I-69/59 S.
-
2026-04-08$275,000 Active 658-char remark
Show marketing remark (658 chars)
Quiet community found in the city of Beasley, Texas. No HOA, no MUD fees, and a very Low Tax rate. This property has a 10-foot ceiling on the first floor and a 9-foot-ceiling on the second floor, where you can walk out onto the balcony and enjoy the view. It also has a custom-made shower in an oversized primary bedroom. Other specialty features of this home includes a 14-piers (12 x 12 x 36) support system beneath the foundation, granite countertops throughout, walk-in closets, ample cabinet space, and an open floor plan to maximize the living space. 219 S 7th St is a must-see home, 5 minutes from Brazos Town Center and 30 seconds from Hwy I-69/59 S.
ⓘ Source: listings_history table (triggers on properties + properties_extension) + one-shot
backfill from property_details.listing_events for pre-trigger history.
Nearby sold comps map
Loading sold comps map…
Walkable amenities ~0.75 mi
Loading nearby amenities…
Taxation est. · year 1
- Rental income
- $25,614
- − Mortgage interest
- −$15,404
- − Property taxes
- −$4,125
- − Insurance
- −$1,375
- − Repairs & maintenance
- −$2,049
- − Management
- −$2,049
- − Depreciation
- −$8,000
- Taxable loss
- −$7,389
- Est. tax savings @ 24.0%
- +$1,773
- After-tax cash flow
- $-798/yr
For passive investors: Depreciation is non-cash, so a rental often shows a tax loss while cash-flowing — sheltering income. Rental losses are passive: they offset passive income freely, and up to $25,000/yr can offset ordinary (W-2) income if you actively participate and your MAGI is under $100k (phasing out to $0 by $150k); unused losses carry forward. On sale, claimed depreciation is recaptured at up to 25%, and gains may owe capital-gains tax (a 1031 exchange can defer both). Figures are a year-1 estimate at your 24.0% rate — not tax advice; consult a CPA.
Condition & rehab AI · 12 photos
This home is in excellent condition with modern finishes and a good curb appeal, making it a great investment.
Value-add opportunities
- Both landscaping — improves curb appeal and adds value
- Both smart home integration — enhances convenience and marketability
Renovation cost estimate screening
Value-add ROI direction
- Both landscaping — improves curb appeal and adds value ↑
- Both smart home integration — enhances convenience and marketability ↑
ⓘ Cost ranges are severity-bucket heuristics (US national rule-of-thumb). Get contractor quotes + a written scope before underwriting a rehab budget.
Schools (NCES district)
- District
- Lamar CISD
- NCES district ID
- 4826580
- Math proficiency
- 50% ▼ -12.00%
- Reading proficiency
- 53% ▼ -4.00%
- Median HH income
- $75,213
- Composite
- 46.43/100
- National rank
- #2452
- State rank
- #116 of 826 in TX
Livability — Beasley
- Score
- 57/100
- State rank
- #1273
- US rank
- #22130
Category grades
Schools grade is shown separately in the Schools card above.
Census & demographics
- Census place
- Beasley, TX
- Population (ZIP)
- 3,232
Population outlook (Fort Bend County) Hauer SSP2
- Today (2025)
- 1,004,526 people
- By 2030
- 1,153,104 · +14.8%
- By 2040
- 1,453,718 · +44.7%
- By 2050
- 1,753,781 · +74.6%
- By 2075
- 2,455,772 · +144.5%
- By 2100
- 2,930,528 · +191.7%
Race, ethnicity, and origin ACS 2023
- Neighborhood character
- Predominantly Hispanic (67%)
- Race & ethnicity
- Hispanic / Latino 67% Two or more races 49% White 22% Black 8%
- Hispanic origin (detail)
- Mexican 54%
- Common ancestry
- Italian 2% Romanian 1%
- Foreign-born
- 3% · Canada
- Languages at home
- 76% English-only · Spanish 24%
Political lean MEDSL · Fort Bend
- 2024 margin
- Toss-up / Even · D 49.5% · R 47.9% · Other 2.6%
- 2008→2024 swing
- +4.0pp toward D · 2008: -2.4pp · 2024: 1.6pp
- All cycles
- 2024: D+1.6 2020: D+10.6 2016: D+6.6 2012: R+6.8 2008: R+2.4
Not yet ingested
- Civics
- —
Market trends
- HPI YoY
- ▲ 4.15%
- Current HPI
- 337.8236
- Rent YoY
- —
- Metro
- —
- State GDP YoY
- ▲ 3.95%
- F500 in state
- 110
Industry mix (Fortune 500 HQ in TX)
| Industry | F500 HQs | Revenue |
|---|---|---|
| Energy | 16 | $1,198B |
|
||
| Technology | 5 | $198B |
|
||
| Engineering / Construction | 4 | $72B |
|
||
| Energy Services | 3 | $60B |
|
||
| Utilities | 3 | $41B |
|
||
| Healthcare | 2 | $330B |
|
||
Price history
-3.6% since first listed2 events — show timeline
- 2026-05-19 Price Changed $265,000 HARMLS
- 2026-04-08 Listed $275,000 HARMLS
Cash-flow waterfall
monthlySold comps — $/sqft
last 12 mo · ≤1 miLoading sold comps…