1829 Princeton St · North Las Vegas, NV
Flood risk 1/10 · Minimal
- FEMA flood zone
- X (unshaded)
- Chance of flooding over 30 yrs
- 0.0%
- Est. flood insurance / yr
- $507 – $1,088
Fire risk 1/10 · Minimal
- Est. fire insurance / yr
- $490 – $910
Heat risk 8/10 · Major
- Hot days now (above 108°F)
- 7 days/yr
- Hot days in 30 yrs
- 19 days/yr
Wind risk 1/10 · Minimal
- Chance of severe wind over 30 yrs
- —
Air-quality risk 4/10 · Minor
- Unhealthy air days now
- 4 days/yr
- Unhealthy air days in 30 yrs
- 5 days/yr
Risk factors via First Street. Map © Google.
Why this score? — see what drove the B- grade
The composite is a weighted blend of 9 inputs, each scored 0–100. Each bar is that input's sub-score; the figure is the points it added to the 100-point composite (weight × sub-score).
- Cash flow +30.0/30.0
- DSCR +10.0/10.0
- 1% rule +7.8/10.0
- ARV discount +7.5/15.0
- Livability +3.7/5.0
- Rent growth +3.3/5.0
- Schools +2.6/10.0
- Condition / age +2.5/5.0
- Appreciation +0.0/10.0
$99,900
🖨 Deal sheet 📄 Offer letter ✓ Due diligence
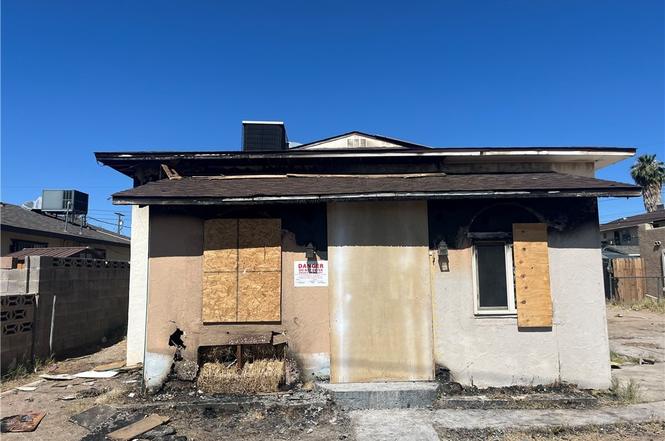
Listing remarks
Barbequed to Perfection! Well, almost. The 1930 built home suffered a minor setback mid-last month when some uninvited guests were unable to successfully navigate the intricacies of a modern stove, and burned the place down. It is now being offered to you, the ambitious investor, and will be sold to the highest bidder next week. This property was previously configured as a house with and additional studio, a guest house and two storage sheds. The main house was split into two units, the front unit suffered most of the damage. The rear studio and guest house appear unaffected by the fire. The power meter has been removed and all utilities are now off. Bring your favorite contractor and your
Key facts
- 5,227 sq ft lot
- Built 1930
- Listed 7 days
Property features AI
Exterior
- Parking: Open parking
- Utilities: Public water; Public sewer; Cable available; No photovoltaics
- Home design: Single-family property; Single-story; Resale condition
- Construction: Composition/Shingle roof; Resale (existing) construction
- Exterior features: Private yard; Back yard block fencing; Faces east; Less than quarter acre lot
Interior
- Kitchen: Kitchen (details available)
- Bedrooms: Space for 2 possible bedrooms
- Flooring: Carpet
- Bathrooms: 2 full bathrooms
- Heating & cooling: Central heating (gas); Central electric cooling
- Interior features: Bedroom on main level; Unfurnished; Carpet flooring; Other interior features: None
- Laundry & utility: Electric dryer hookup
Neighborhood map
What this means for you Summary
Snapshot
- This is a 2-bed/2.0-bath single-family listed at $100k.
Deal economics
- At list price, monthly cash flow is $414 ($5k/yr) — positive.
- The deal already cash-flows at list — no discount required.
- Meets the 1% rule at list price ($1k rent vs $100k).
Location & tenants
- Location reads 74/100 on livability (#14 in NV, #4,471 nationally) — a middle-class / working-renter tenant base. Strengths: commute A+, housing A+, cost of living B; Watch: crime D+, schools F, amenities F.
- Clark County School District (urban): math 21% / reading 39% proficiency, ranked #11 of 17 in NV (top 65%) — families likely to look elsewhere, expect single-tenant / working-renter base with shorter leases.
- Market conditions: Rents rising (+3.0%/yr); 151 active listings in the ZIP; 24 comparable units currently listed for rent nearby; rentals lingering (median 44d on market — plan ~5-8 weeks vacancy on turnover, expect pricing pressure); 71% of comp listings sitting > 30 days — soft ceiling on asking rent; 14,754 units permitted in Clark County in 2024 (2,301 in 5+ unit buildings).
- This rent runs 32% of the median local income ($48k/yr) — at the standard rent-burdened threshold; future hikes will face affordability resistance.
Forward outlook
- Local home prices are declining (-3.0%/yr); year-one equity from $691 of loan paydown is wiped out by about $3k of value loss. Plan a longer hold.
- Clark County population projected at +36% by 2050 — long-run rental-demand tailwind backs the buy-and-hold thesis.
- At projected returns (-3.0% appreciation + 3.0% rent growth), your $28k cash investment doubles in ~7 years — after that, you're playing with house money.
Negotiation context
- Only 7 days on market — expect competitive offers; lowballing is unlikely to land.
Risks & watch-outs
- Watch-outs: built in 1930 — expect roof / HVAC / electrical / plumbing capex.
- Climate carrying-cost: extreme-heat days projected 7→19/yr by 2055 (HVAC capex compounding) — expect insurance premiums to compound above CPI over the hold.
Questions for the listing agent
- Built in 1930 — when were the roof, HVAC, electrical panel, plumbing, and water heater last replaced?
- Is there a deadline driving the sale (1031 exchange, divorce, estate, relocation)? That informs how much negotiation room exists.
- Schools are F-rated, which usually means shorter tenancies and higher turnover. Who's the typical renter profile here, and what's been the actual vacancy rate?
- Crime grade is D in this area — have there been break-ins, vandalism, or insurance claims at this property in the last 3 years? What carrier currently insures it and at what premium?
- What's the average days-on-market for RENTAL listings here right now (not sales)? A rising rental-DOM trend means longer vacancies and softer asking-rent achievability than the comps imply.
- What's the recent tenant-quality profile in this submarket — average credit score on applications, eviction rate, late-payment / NSF rate, and stable-employment percentage? A property-management company in the area should have these aggregated.
- How much new for-sale + rental construction is in the pipeline within 1–3 miles? Heavy new supply typically softens prices + rents 12–24 months out; constrained supply supports both.
Investment metrics
- 1% rule
- 1.28% ✓
- Cap rate
- 11.27%
- Cash-on-cash
- 17.76%
- DSCR
- 1.79
- GRM
- 6.5
CMA / ARV
No comps found within radius.
Projected returns pro-forma
-3.0% appreciation · 3.04% rent growth · sell at horizon
- IRR
- 9.3%
- Equity multiple
- 1.36×
- Total profit
- $10,195
- Equity at exit
- $14,895
- IRR
- 18.4%
- Equity multiple
- 2.53×
- Total profit
- $42,889
- Equity at exit
- $8,638
Cash invested: $27,972 (down + closing). Projections, not guarantees.
Landlord ↔ Tenant lean methodology
- Overall (STATE)
- 71 Landlord-Friendly
- State Nevada
- 71 Landlord-Friendly · R+1
- County
- — inherits STATE
- City
- — inherits STATE
ZIP-level market 89030
- Home prices YoY
- -27.7%
- Rents YoY
- 3.0%
- Active inventory
- 151
- Price-to-rent
- 6.5×
Monthly cashflow live
- Estimated rent
- $1,280 high interval (Pro) →
- Mortgage (P&I)
- −$524
- Tax from tax record
- −$31 /mo · $377/yr
- Insurance
- −$42
- HOA
- −$0
- Vacancy / Maint / Mgmt
- −$269
- Net cashflow
- $414
Break-even live
UW: 25.0% down · 7.5% · 30yr · 1.5% tax · 5.0% vac · 8.0% maint · 8.0% mgmt
Financing live
Cash to close
- Down payment
- $24,975
- Closing costs
- $2,997
- Reserves months
- —
- Total cash needed
- —
Loan-product check · same deal, 3 products live
Conventional
25% down · 7.5% · 30yr
- Down + closing
- —
- Monthly P&I
- —
- Monthly cashflow
- —
- DSCR
- —
- Eligible?
- —
Personal DTI + credit; lowest rate.
DSCR
20% down · 8.5% · 30yr
- Down + closing
- —
- Monthly P&I
- —
- Monthly cashflow
- —
- DSCR
- —
- Eligible?
- —
No personal income docs; deal must DSCR.
Hard money
10% down · 12.0% · 12mo
- Down + closing
- —
- Monthly P&I
- —
- Monthly cashflow
- —
- DSCR
- —
- Eligible?
- —
Short-term bridge; refi at stabilization.
Rent comps 24 comps
| Address | Beds | Baths | Sqft | Rent | $/sqft | DOM | Units | Dist |
|---|---|---|---|---|---|---|---|---|
| 1911 Princeton St Unit C North Las Vegas, NV | 1.0 | 1.0 | 572 | $995 | $1.74 | 43d | 1 | 0.11mi |
| 1834 Jefferson St North Las Vegas, NV | 2.0 | 1.0 | 825 | $1,020 | $1.24 | 43d | 1 | 0.67mi |
| 1011 N 4th St Las Vegas, NV | 1.0 | 1.0 | 750 | $1,250 | $1.67 | 43d | 1 | 0.68mi |
| 2125 Las Vegas Blvd N North Las Vegas, NV | 1.0–3.0 | 1.0–2.0 | 781 | $1,172 | $1.50 | 43d | 15 | 0.74mi |
| 717 Van Ert Ave North Las Vegas, NV | 3.0 | 1.0 | 988 | $1,750 | $1.77 | 43d | 1 | 0.81mi |
| 711 E Nelson Ave North Las Vegas, NV | 1.0–3.0 | 1.0–2.0 | 661 | $1,055 | $1.59 | 43d | 16 | 0.82mi |
| 451 Sand Sage Ave Unit A North Las Vegas, NV | 2.0 | 2.0 | 986 | $1,350 | $1.37 | 43d | 1 | 0.88mi |
| 904 Biltmore Dr Las Vegas, NV | 2.0 | 1.0 | 984 | $1,470 | $1.49 | 43d | 1 | 0.91mi |
| 1209 H St Las Vegas, NV | 3.0 | 2.0 | 1125 | $2,200 | $1.96 | 21d | 1 | 0.99mi |
| 1209 H St Las Vegas, NV | 3.0 | 2.0 | 1125 | $2,200 | $1.96 | 20d | 1 | 0.99mi |
| 611 Bell Dr Las Vegas, NV | 3.0 | 1.0 | 832 | $1,850 | $2.22 | 43d | 1 | 1.11mi |
| 1309 N 22nd St Las Vegas, NV | 1.0 | 1.0 | 701 | $850 | $1.21 | 23d | 1 | 1.14mi |
| 701 N 13th St Las Vegas, NV | 1.0–2.0 | 1.0 | 591 | $1,285 | $2.17 | 43d | 15 | 1.18mi |
| 1309 N 23rd St Las Vegas, NV | 2.0 | 1.0 | 885 | $990 | $1.12 | 43d | 1 | 1.21mi |
| 1420 Putnam Ave Unit 4 North Las Vegas, NV | 3.0 | 1.0 | 900 | $1,295 | $1.44 | 23d | 1 | 1.22mi |
| 1417 E Cartier Ave Unit 18B North Las Vegas, NV | 1.0 | 1.0 | 800 | $945 | $1.18 | 43d | 1 | 1.24mi |
| 2504 Flower Ave North Las Vegas, NV | 3.0 | 2.0 | 958 | $1,650 | $1.72 | 23d | 1 | 1.24mi |
| 625 N 12th St Unit 1 Las Vegas, NV | 2.0 | 2.0 | 874 | $1,195 | $1.37 | 43d | 1 | 1.31mi |
| 2109 Daley St North Las Vegas, NV | 2.0 | 1.0 | 750 | $1,080 | $1.44 | 43d | 1 | 1.39mi |
| 2109 Daley St Unit B North Las Vegas, NV | 2.0 | 1.0 | 700 | $1,080 | $1.54 | 21d | 1 | 1.39mi |
| 2100 Daley St Unit D North Las Vegas, NV | 1.0 | 1.0 | 600 | $900 | $1.50 | 7d | 1 | 1.42mi |
| 2100 Daley St North Las Vegas, NV | 1.0 | 1.0 | 600 | $920 | $1.53 | 43d | 1 | 1.42mi |
| 2605 Tuskegee St North Las Vegas, NV | 3.0 | 2.0 | 1034 | $1,695 | $1.64 | 43d | 1 | 1.42mi |
| 2106 Daley St Unit B North Las Vegas, NV | 2.0 | 1.0 | 670 | $1,020 | $1.52 | 43d | 1 | 1.42mi |
Listing history 6 events
-
2026-06-18days on market $99,900 Active 7 DOM
-
2026-06-17days on market $99,900 Active 6 DOM
-
2026-06-16days on market $99,900 Active 5 DOM
-
2026-06-15days on market $99,900 Active 4 DOM
-
2026-06-13remarks 699-char remark
-
2026-06-13$99,900 Active 2 DOM
ⓘ Source: listings_history table (triggers on properties + properties_extension) + one-shot
backfill from property_details.listing_events for pre-trigger history.
Tax reassessment forecast NV · Resets to sale price
- Current annual tax
- $377 · $31/mo
- Projected year-2 tax
- $589 · $49/mo
- Expected delta
- +$212/yr (+$18/mo · 56.4%)
ⓘ Screening estimate from a state-policy table — verify with the county assessor before closing.
Climate risk First Street
- Flood 1/10 Low FEMA zone X (unshaded) · 0% chance over 30 yrs
- Wildfire 1/10 Low
- Heat 8/10 Severe 7 d/yr ≥108°F today · 19 d/yr by 30 yrs out
- Wind 1/10 Low
- Air quality 4/10 Moderate 4 unhealthy d/yr today · 5 by 30 yrs out
Nearby sold comps map
Loading sold comps map…
Walkable amenities ~0.75 mi
Loading nearby amenities…
Taxation est. · year 1
- Rental income
- $15,356
- − Mortgage interest
- −$5,596
- − Property taxes
- −$377
- − Insurance
- −$500
- − Repairs & maintenance
- −$1,228
- − Management
- −$1,228
- − Depreciation
- −$2,906
- Taxable income
- $3,521
- Est. tax owed @ 24.0%
- −$845
- After-tax cash flow
- $4,123/yr
For passive investors: Depreciation is non-cash, so a rental often shows a tax loss while cash-flowing — sheltering income. Rental losses are passive: they offset passive income freely, and up to $25,000/yr can offset ordinary (W-2) income if you actively participate and your MAGI is under $100k (phasing out to $0 by $150k); unused losses carry forward. On sale, claimed depreciation is recaptured at up to 25%, and gains may owe capital-gains tax (a 1031 exchange can defer both). Figures are a year-1 estimate at your 24.0% rate — not tax advice; consult a CPA.
Schools (NCES district)
- District
- Clark County School District
- NCES district ID
- 3200060
- Math proficiency
- 21% ▼ -13.00%
- Reading proficiency
- 39% ▼ -8.00%
- Median HH income
- $53,611
- Composite
- 26.48/100
- National rank
- #7211
- State rank
- #11 of 17 in NV
Livability — North Las Vegas
- Score
- 74/100
- State rank
- #14
- US rank
- #4471
Category grades
Schools grade is shown separately in the Schools card above.
Census & demographics
- Census place
- North Las Vegas, NV
- County
- Clark County · 2,306,105 people
- City population
- 274,675
- Metro
- Las Vegas-Henderson-Paradise, NV
- Population (ZIP)
- 51,341
- Household income
- $47,937
- Rent vs Own
- Severe rent burden
- 2821.0
Population outlook (Clark County) Hauer SSP2
- Today (2025)
- 2,504,101 people
- By 2030
- 2,693,770 · +7.6%
- By 2040
- 3,061,208 · +22.2%
- By 2050
- 3,400,072 · +35.8%
- By 2075
- 4,139,522 · +65.3%
- By 2100
- 4,596,916 · +83.6%
Race, ethnicity, and origin ACS 2023
- Neighborhood character
- Predominantly Hispanic (73%)
- Race & ethnicity
- Hispanic / Latino 73% Two or more races 26% Black 14% White 8% Native American 2% Asian 1%
- Hispanic origin (detail)
- Mexican 65%
- Foreign-born
- 33% · Canada
- Languages at home
- 34% English-only · Spanish 64% Other Asian/Pacific 1%
Political lean MEDSL · Clark
- 2024 margin
- Toss-up / Even · D 50.4% · R 47.8% · Other 1.7%
- 2008→2024 swing
- -16.5pp toward R · 2008: 19.1pp · 2024: 2.6pp
- All cycles
- 2024: D+2.6 2020: D+9.3 2016: D+10.7 2012: D+14.5 2008: D+19.1
Not yet ingested
- Civics
- —
Market trends
- HPI YoY
- ▼ -117.09%
- Current HPI
- 305.5742
- Rent YoY
- ▲ 3.04%
- Metro
- Las Vegas-Henderson-Paradise, NV
- State GDP YoY
- ▲ 3.08%
- F500 in state
- 6
Industry mix (Fortune 500 HQ in NV)
| Industry | F500 HQs | Revenue |
|---|---|---|
| Hotels / Casinos | 3 | $36B |
|
||
Price history
+185.4% since first listed4 events — show timeline
- 2026-06-11 Listed $99,900 GLVAR
- 2023-06-29 Sold (Public Records) $179,900 Public Records
- 1987-09-03 Sold (Public Records) $35,000 Public Records
- 1980-05-07 Sold (Public Records) $35,000 Public Records
Property tax history
-1.7%/yrLatest (2025): $377 · +7.2% YoY. Source: county tax records.
Cash-flow waterfall
monthlySold comps — $/sqft
last 12 mo · ≤1 miLoading sold comps…