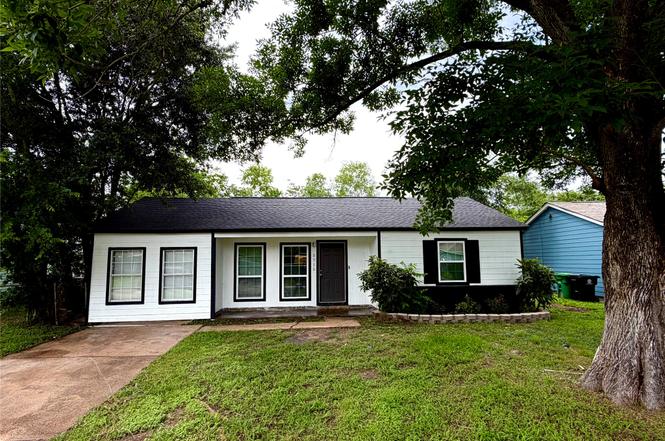
5715 Lakefield Dr · Houston, TX
Flood risk 3/10 · Minor
- FEMA flood zone
- X (unshaded)
- Chance of flooding over 30 yrs
- 0.1%
- Est. flood insurance / yr
- $507 – $1,088
Fire risk 1/10 · Minimal
- Est. fire insurance / yr
- $1,222 – $2,270
Heat risk 9/10 · Severe
- Hot days now (above 108°F)
- 7 days/yr
- Hot days in 30 yrs
- 24 days/yr
Wind risk 9/10 · Severe
- Chance of severe wind over 30 yrs
- 99.0%
Air-quality risk 2/10 · Minimal
- Unhealthy air days now
- 1 days/yr
- Unhealthy air days in 30 yrs
- 2 days/yr
Risk factors via First Street. Map © Google.
Why this score? — see what drove the D grade
The composite is a weighted blend of 9 inputs, each scored 0–100. Each bar is that input's sub-score; the figure is the points it added to the 100-point composite (weight × sub-score).
- Cash flow +14.7/30.0
- ARV discount +6.4/15.0
- DSCR +4.5/10.0
- 1% rule +3.9/10.0
- Rent growth +3.9/5.0
- Livability +3.7/5.0
- Schools +2.7/10.0
- Condition / age +2.5/5.0
- Appreciation +0.0/10.0
$188,000
🖨 Deal sheet (PDF) 📄 Offer letter ✓ Due diligence
Listing remarks
Welcome to this beautifully remodeled three bedroom, one bath gem! Featuring a new roof, completely updated kitchen and bathroom with level 5 granite. All new flooring throughout with a large bonus living room. This is a great starter house that is perfect for the first time home buyer. Move in ready that includes a large utility room. HURRY THIS HOUSE WON'T LAST!
Key facts
- Updated kitchen
- New roof
- Updated bathroom
Tags
Property features AI
Finance
- Other: Listing agent is owner
- Financial info: Lease not considered
- HOA & community: Curbs in the community
Exterior
- Parking: No designated parking
- Security: Smoke detectors
- Utilities: Public water; Public sewer
- Home design: Residential property; Built in 1952; Slab foundation
- Construction: Wood siding construction; Shingle and wood roof
- Exterior features: Fenced private yard; Back yard fencing; Subdivision setting; Concrete road access
Interior
- Kitchen: Electric oven; Pantry
- Bedrooms: Three bedrooms total; Primary bedroom on the first floor (12 x 13); Two additional first-floor bedrooms (each 11 x 12)
- Flooring: Carpet; Laminate; Tile
- Bathrooms: One full bathroom
- Heating & cooling: Central heating (gas); Central electric air conditioning
- Interior features: Pantry; Tub with shower; Window treatments; Ceiling fans; Window coverings
- Laundry & utility: No laundry information provided
Neighborhood map
What this means for you Summary
Snapshot
- This is a 3-bed/1.0-bath single-family listed at $188k.
Deal economics
- At list price, monthly cash flow is $49 ($591/yr) — positive.
- The deal already cash-flows at list — no discount required.
- To meet the 1% rule (rent ≥ 1% of price), the offer needs to be $167k (11.0% below list).
- Recommended offer: $167k (11.0% below list) — sets the bar for 1% rule.
- Cap rate 6.6% vs local median 3.1% in Houston — top-decile yield for the area; either an underpriced asset or a hidden risk that comps aren't pricing in. Stress-test before assuming the spread holds.
Location & tenants
- Location reads 74/100 on livability (#184 in TX, #4,771 nationally) — a middle-class / working-renter tenant base. Strengths: amenities A+, cost of living A+, housing A+; Watch: crime F.
- Houston ISD (urban): math 27% / reading 35% proficiency, ranked #593 of 826 in TX (top 72%) — families likely to look elsewhere, expect single-tenant / working-renter base with shorter leases; 71% free/reduced lunch — lower-income household profile, screen leases tightly.
- Zoned schools: Mading El (math 22% / reading 27%, grade F, #3,052 of 4,322 statewide, top 74%, 339 students, 96% FRL); Thomas Middle (math 3% / reading 13%, grade F, #1,654 of 1,662 statewide, top 100%, 526 students, 98% FRL); Sterling H S (math 16% / reading 27%, grade F, #1,377 of 1,632 statewide, top 85%, 1,421 students, 92% FRL) — zoned schools average 96% FRL vs 71% district-wide (24 pts higher); higher-poverty schools than district average — tighter screening recommended.
- Zoned-school proficiency averages 18% at this address vs 31% district-wide (-13 pts) — the specific schools serving this property underperform the Houston ISD average; the district grade overstates school quality for this exact location.
- Market conditions: Rents rising fast (+5.5%/yr); 345 active listings in the ZIP; 29 comparable units currently listed for rent nearby; rentals at typical pace (median 15d on market — plan ~3-4 weeks tenant-placement turnaround); lower-income renter base — watch delinquency; 29,883 units permitted in Harris County in 2024 (8,621 in 5+ unit buildings).
Forward outlook
- Local home prices are declining (-3.0%/yr); year-one equity from $1k of loan paydown is wiped out by about $6k of value loss. Plan a longer hold.
- Harris County population projected at +47% by 2050 — long-run rental-demand tailwind backs the buy-and-hold thesis.
Negotiation context
- Only 11 days on market — expect competitive offers; lowballing is unlikely to land.
- 4 sale attempts since 18y ago with the ask held roughly flat each time — persistent listings suggest the price (not the market) is what's stuck; bring a comps-based counter.
- Current owner paid $14k; list at $188k implies a 1197% gain — meaningful room to come down on a strong offer.
Risks & watch-outs
- Watch-outs: built in 1952 — expect roof / HVAC / electrical / plumbing capex.
- Climate carrying-cost: severe wind risk, 99% chance of damaging wind over 30y; extreme-heat days projected 7→24/yr by 2055 (HVAC capex compounding) — expect insurance premiums to compound above CPI over the hold.
Questions for the listing agent
- Built in 1952 — when were the roof, HVAC, electrical panel, plumbing, and water heater last replaced?
- Is there a deadline driving the sale (1031 exchange, divorce, estate, relocation)? That informs how much negotiation room exists.
- Schools are D-rated, which usually means shorter tenancies and higher turnover. Who's the typical renter profile here, and what's been the actual vacancy rate?
- Crime grade is F in this area — have there been break-ins, vandalism, or insurance claims at this property in the last 3 years? What carrier currently insures it and at what premium?
- The area grade is low — what's the realistic commute time and amenity access for the typical tenant pool here? Any planned neighborhood developments (good or bad) we should know about?
- What's the average days-on-market for RENTAL listings here right now (not sales)? A rising rental-DOM trend means longer vacancies and softer asking-rent achievability than the comps imply.
- What's the recent tenant-quality profile in this submarket — average credit score on applications, eviction rate, late-payment / NSF rate, and stable-employment percentage? A property-management company in the area should have these aggregated.
- How much new for-sale + rental construction is in the pipeline within 1–3 miles? Heavy new supply typically softens prices + rents 12–24 months out; constrained supply supports both.
Investment metrics
- 1% rule
- 0.89% ✗
- Cap rate
- 6.61%
- Cash-on-cash
- 1.12%
- DSCR
- 1.05
- GRM
- 9.4
CMA / ARV
- ARV (on-the-fly)
- $183,668
- Comps found
- 12
Show comp detail 12 sales within ~0.75 mi
| Address | Dist | Beds/Ba | Sqft | Sold | Price | $/sf | Match |
|---|---|---|---|---|---|---|---|
| 5746 Groveton St | 0.09mi | 3/1.0 | 1,200 (-5%) | 4mo | $129,900 | $108 | 84 |
| 9211 Vinearbor St | 0.16mi | 3/1.0 | 1,192 (-5%) | 1mo | $179,900 | $151 | 83 |
| 5746 Lakefield Dr | 0.09mi | 4/2.0 (+1) | 1,313 (+4%) | 8mo | $165,000 | $126 | 72 |
| 9215 Vinearbor St | 0.15mi | 3/1.0 | 1,165 (-7%) | 11mo | $169,900 | $146 | 72 |
| 5606 Elmlawn Dr | 0.21mi | 3/2.0 | 1,341 (+7%) | 8mo | $155,000 | $116 | 68 |
| 5234 Wilmington St | 0.61mi | 3/1.0 | 1,230 (-2%) | 1mo | $76,500 | $62 | 67 |
| 5503 Ricky St | 0.31mi | 3/1.0 | 1,102 (-12%) | 5mo | $110,000 | $100 | 61 |
| 5502 Elm Tree Dr | 0.57mi | 3/2.0 | 1,216 (-3%) | 7mo | $175,000 | $144 | 58 |
| 5527 Lakefield Dr | 0.24mi | 4/2.5 (+1) | 1,400 (+11%) | 2mo | $240,000 | $171 | 58 |
| 5531 Elm Tree Dr | 0.60mi | 3/2.0 | 1,318 (+5%) | 3mo | $197,500 | $150 | 58 |
| 5217 Pederson St | 0.56mi | 3/2.0 | 1,158 (-8%) | 7mo | $179,000 | $155 | 51 |
| 8918 Vinearbor St | 0.37mi | 4/3.0 (+1) | 1,400 (+11%) | 3mo | $239,900 | $171 | 49 |
Match score weights: distance 35% · size 25% · config 20% · recency 20%. Top-matched comps best support the ARV.
Projected returns pro-forma
-3.0% appreciation · 5.45% rent growth · sell at horizon
- IRR
- -11.8%
- Equity multiple
- 0.56×
- Total profit
- $-23,095
- Equity at exit
- $28,031
- IRR
- 0.5%
- Equity multiple
- 1.04×
- Total profit
- $2,189
- Equity at exit
- $16,255
Cash invested: $52,640 (down + closing). Projections, not guarantees.
Landlord ↔ Tenant lean methodology
- Overall (STATE)
- 87 Strongly Landlord-Friendly
- State Texas
- 87 Strongly Landlord-Friendly · R+5
- County
- — inherits STATE
- City
- — inherits STATE
ZIP-level market 77033
- Home prices YoY
- -16.3%
- Rents YoY
- 5.5%
- Active inventory
- 345
- Price-to-rent
- 9.4×
Monthly cashflow live
- Estimated rent
- $1,673 high interval (Pro) →
- Mortgage (P&I)
- −$986
- Tax from tax record
- −$208 /mo · $2,495/yr
- Insurance
- −$78
- HOA
- −$0
- Vacancy / Maint / Mgmt
- −$351
- Net cashflow
- $49
Break-even live
Sensitivity live
| Price | -10% $156 | -5% $102 | +0% $49 | +5% $-4 | +10% $-57 |
|---|---|---|---|---|---|
| Rent | -10% $-83 | -5% $-17 | +0% $49 | +5% $115 | +10% $181 |
| Rate | -1.0pp $144 | -0.5pp $97 | base $49 | +0.5pp $1 | +1.0pp $-49 |
UW: 25.0% down · 7.5% · 30yr · 1.5% tax · 5.0% vac · 8.0% maint · 8.0% mgmt
Financing live
Cash to close
- Down payment
- $47,000
- Closing costs
- $5,640
- Reserves months
- —
- Total cash needed
- —
Loan-product check · same deal, 3 products live
Conventional
25% down · 7.5% · 30yr
- Down + closing
- —
- Monthly P&I
- —
- Monthly cashflow
- —
- DSCR
- —
- Eligible?
- —
Personal DTI + credit; lowest rate.
DSCR
20% down · 8.5% · 30yr
- Down + closing
- —
- Monthly P&I
- —
- Monthly cashflow
- —
- DSCR
- —
- Eligible?
- —
No personal income docs; deal must DSCR.
Hard money
10% down · 12.0% · 12mo
- Down + closing
- —
- Monthly P&I
- —
- Monthly cashflow
- —
- DSCR
- —
- Eligible?
- —
Short-term bridge; refi at stabilization.
Rent comps 29 comps
| Address | Beds | Baths | Sqft | Rent | $/sqft | DOM | Units | Dist |
|---|---|---|---|---|---|---|---|---|
| 5458 Osprey Dr Houston, TX | 3.0 | 2.0 | 1614 | $1,595 | $0.99 | 23d | 1 | 0.37mi |
| 9509 Merle St Unit 9509A Houston, TX | 4.0 | 2.5 | 1404 | $1,500 | $1.07 | 46d | 1 | 0.41mi |
| 10902 Faircroft Dr Houston, TX | 3.0 | 1.0 | 1308 | $1,455 | $1.11 | 1d | 1 | 0.46mi |
| 5408 Groveton St Houston, TX | 4.0 | 2.0 | 1472 | $1,983 | $1.35 | 1d | 1 | 0.46mi |
| 5426 Greylog Dr Houston, TX | 3.0 | 2.0 | 1205 | $1,750 | $1.45 | 26d | 1 | 0.62mi |
| 5012 Higgins St Unit B Houston, TX | 3.0 | 2.5 | 1611 | $1,650 | $1.02 | 26d | 1 | 0.84mi |
| 5602 Selinsky Rd Unit 2047 Houston, TX | 2.0 | 2.0 | 1062 | $1,113 | $1.05 | 5d | 1 | 0.90mi |
| 5602 Selinsky Rd Unit 3047 Houston, TX | 3.0 | 2.0 | 1167 | $1,324 | $1.13 | 13d | 1 | 0.90mi |
| 5602 Selinsky Rd Unit 2047 Houston, TX | 2.0 | 2.0 | 1062 | $1,114 | $1.05 | 1d | 1 | 0.90mi |
| 5602 Selinsky Rd Unit 2187 Houston, TX | 2.0 | 2.0 | 1062 | $1,124 | $1.06 | 0d | 1 | 0.90mi |
| 5602 Selinsky Rd Unit 3187 Houston, TX | 3.0 | 2.0 | 1167 | $1,324 | $1.13 | 0d | 1 | 0.90mi |
| 5602 Selinsky Rd Unit 510 Houston, TX | 3.0 | 2.0 | 1167 | $1,313 | $1.13 | 13d | 1 | 0.90mi |
| 5602 Selinsky Rd Unit 421 Houston, TX | 2.0 | 2.0 | 1062 | $1,089 | $1.03 | 7d | 1 | 0.90mi |
| 5602 Selinsky Rd Unit 5659 Houston, TX | 2.0 | 2.0 | 1062 | $1,113 | $1.05 | 13d | 1 | 0.90mi |
| 5602 Selinsky Rd Unit 422 Houston, TX | 2.0 | 2.0 | 1062 | $1,089 | $1.03 | 10d | 1 | 0.90mi |
| 4921a Pederson St Unit A Houston, TX | 3.0 | 2.0 | 1765 | $2,150 | $1.22 | 15d | 1 | 0.91mi |
| 5407 Thrush Dr Houston, TX | 4.0 | 1.0 | 1407 | $1,495 | $1.06 | 16d | 1 | 0.93mi |
| 4918 Wilmington St Unit A Houston, TX | 3.0 | 3.0 | 1300 | $2,100 | $1.62 | 46d | 1 | 0.99mi |
| 6103 El Granate Dr Houston, TX | 3.0 | 3.0 | 1755 | $1,585 | $0.90 | 26d | 1 | 1.00mi |
| 6107 El Granate Dr Houston, TX | 3.0 | 2.0 | 1192 | $1,000 | $0.84 | 7d | 1 | 1.01mi |
| 5036 Mallow St Houston, TX | 3.0 | 3.0 | 1472 | $2,050 | $1.39 | 46d | 1 | 1.05mi |
| 4810 Wilmington St Unit A Houston, TX | 3.0 | 2.0 | 1165 | $1,650 | $1.42 | 46d | 1 | 1.10mi |
| 11319 Murr Way Houston, TX | 3.0 | 1.5 | 1213 | $1,699 | $1.40 | 21d | 1 | 1.10mi |
| 5767 Belcrest St Houston, TX | 4.0 | 2.0 | 1480 | $1,790 | $1.21 | 46d | 1 | 1.17mi |
| 5623 Bellfort St Houston, TX | 4.0 | 1.0 | 1320 | $1,700 | $1.29 | 17d | 1 | 1.30mi |
| 6160 Madden Ln Houston, TX | 1.0–2.0 | 1.0–2.0 | 911 | $1,209 | $1.33 | 1d | 266 | 1.30mi |
| 4723 Mallow St Houston, TX | 3.0 | 2.5 | 1472 | $1,850 | $1.26 | 7d | 1 | 1.36mi |
| 6505 Wide Meadow Dr Houston, TX | 3.0–4.0 | 2.0–2.5 | 1696 | $2,185 | $1.29 | 17d | 1 | 1.45mi |
| 5942 Ridgeway Dr Houston, TX | 4.0 | 2.0 | 1490 | $2,250 | $1.51 | 46d | 1 | 1.46mi |
Listing history 7 events
-
2026-06-21pricedays on market $188,000 Active 11 DOM
-
2026-06-18days on market $192,400 Active 8 DOM
-
2026-06-17days on market $192,400 Active 7 DOM
-
2026-06-16days on market $192,400 Active 6 DOM
-
2026-06-15days on market $192,400 Active 5 DOM
-
2026-06-13remarks 366-char remark
-
2026-06-13$192,400 Active 3 DOM
ⓘ Source: listings_history table (triggers on properties + properties_extension) + one-shot
backfill from property_details.listing_events for pre-trigger history.
Tax reassessment forecast TX · Resets to sale price
- Current annual tax
- $2,495 · $208/mo
- Projected year-2 tax
- $3,440 · $287/mo
- Expected delta
- +$945/yr (+$79/mo · 37.9%)
ⓘ Screening estimate from a state-policy table — verify with the county assessor before closing.
Climate risk First Street
- Flood 3/10 Moderate FEMA zone X (unshaded) · 10% chance over 30 yrs
- Wildfire 1/10 Low
- Heat 9/10 Extreme 7 d/yr ≥108°F today · 24 d/yr by 30 yrs out
- Wind 9/10 Extreme 99% chance of damaging wind over 30 yrs
- Air quality 2/10 Low 1 unhealthy d/yr today · 2 by 30 yrs out
Nearby sold comps map
Loading sold comps map…
Walkable amenities ~0.75 mi
Loading nearby amenities…
Taxation est. · year 1
- Rental income
- $20,072
- − Mortgage interest
- −$10,531
- − Property taxes
- −$2,495
- − Insurance
- −$940
- − Repairs & maintenance
- −$1,606
- − Management
- −$1,606
- − Depreciation
- −$5,469
- Taxable loss
- −$2,575
- Est. tax savings @ 24.0%
- +$618
- After-tax cash flow
- $1,209/yr
For passive investors: Depreciation is non-cash, so a rental often shows a tax loss while cash-flowing — sheltering income. Rental losses are passive: they offset passive income freely, and up to $25,000/yr can offset ordinary (W-2) income if you actively participate and your MAGI is under $100k (phasing out to $0 by $150k); unused losses carry forward. On sale, claimed depreciation is recaptured at up to 25%, and gains may owe capital-gains tax (a 1031 exchange can defer both). Figures are a year-1 estimate at your 24.0% rate — not tax advice; consult a CPA.
Schools (NCES district)
- District
- Houston ISD
- NCES district ID
- 4823640
- Math proficiency
- 27% ▼ -18.00%
- Reading proficiency
- 35% ▼ -6.00%
- Median HH income
- $46,054
- Composite
- 26.63/100
- National rank
- #7173
- State rank
- #593 of 826 in TX
Livability — Houston
- Score
- 74/100
- State rank
- #184
- US rank
- #4771
Category grades
Schools grade is shown separately in the Schools card above.
Census & demographics
- Census place
- Houston, TX
- County
- Harris County · 4,702,590 people
- City population
- 3,226,434
- Metro
- Houston-The Woodlands-Sugar Land, TX
- Population (ZIP)
- 29,154
- Household income
- $38,071
- Rent vs Own
- Severe rent burden
- 1728.0
Population outlook (Harris County) Hauer SSP2
- Today (2025)
- 5,571,493 people
- By 2030
- 6,089,821 · +9.3%
- By 2040
- 7,142,806 · +28.2%
- By 2050
- 8,185,864 · +46.9%
- By 2075
- 10,574,329 · +89.8%
- By 2100
- 12,109,958 · +117.4%
Race, ethnicity, and origin ACS 2023
- Neighborhood character
- Majority Black (55%)
- Race & ethnicity
- Black 55% Hispanic / Latino 43% Two or more races 17% Native American 1%
- Hispanic origin (detail)
- Mexican 35%
- Common ancestry
- Lithuanian 1%
- Foreign-born
- 18% · Canada
- Languages at home
- 61% English-only · Spanish 39%
Political lean MEDSL · Harris
- 2024 margin
- Lean D (+5.5) · D 52.0% · R 46.4% · Other 1.6%
- 2008→2024 swing
- +3.9pp toward D · 2008: 1.6pp · 2024: 5.5pp
- All cycles
- 2024: D+5.5 2020: D+13.3 2016: D+12.4 2012: D+0.1 2008: D+1.6
Not yet ingested
- Civics
- —
Market trends
- HPI YoY
- ▼ -41.49%
- Current HPI
- 212.6472
- Rent YoY
- ▲ 5.45%
- Metro
- Houston-The Woodlands-Sugar Land, TX
- State GDP YoY
- ▲ 3.95%
- F500 in state
- 110
Industry mix (Fortune 500 HQ in TX)
| Industry | F500 HQs | Revenue |
|---|---|---|
| Energy | 16 | $1,198B |
|
||
| Technology | 5 | $198B |
|
||
| Engineering / Construction | 4 | $72B |
|
||
| Energy Services | 3 | $60B |
|
||
| Utilities | 3 | $41B |
|
||
| Healthcare | 2 | $330B |
|
||
Price history
+1226.9% since first listed9 events — show timeline
- 2026-06-10 Listed $192,400 HARMLS
- 2024-04-10 Rental Removed $1,450 RENT.
- 2023-11-09 Listed for Rent $1,450 RENT.
- 2009-04-10 Listing Removed — HARMLS
- 2008-09-09 Listed $74,900 HARMLS
- 2008-09-05 Listing Removed — HARMLS
- 2008-02-05 Listed $45,900 HARMLS
- 2003-05-19 Sold (Public Records) — Public Records
- 1997-01-20 Sold (Public Records) $14,500 Public Records
Property tax history
+8.3%/yrLatest (2025): $2,495 · -6.8% YoY. Source: county tax records.
Cash-flow waterfall
monthlySold comps — $/sqft
last 12 mo · ≤1 miLoading sold comps…