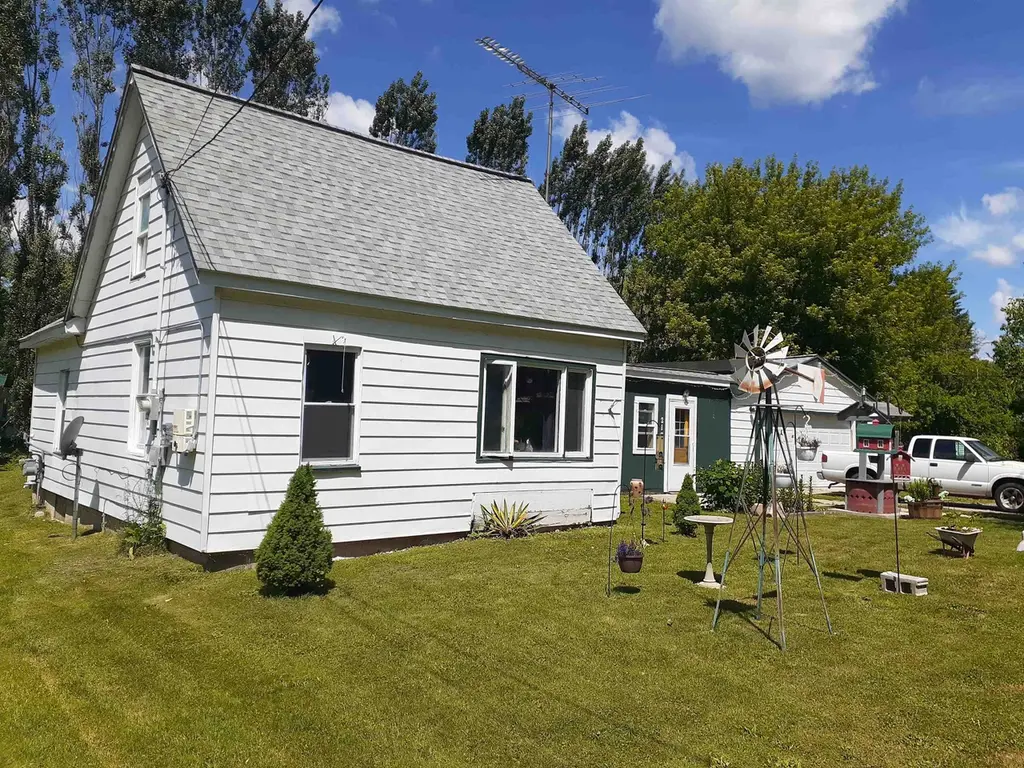
217 Clyde St · Omer, MI
Flood risk 1/10 · Minimal
- FEMA flood zone
- X (unshaded)
- Chance of flooding over 30 yrs
- 0.0%
- Est. flood insurance / yr
- $507 – $1,088
Fire risk 2/10 · Minimal
- Est. fire insurance / yr
- $784 – $1,456
Heat risk 2/10 · Minimal
- Hot days now (above 94°F)
- 7 days/yr
- Hot days in 30 yrs
- 13 days/yr
Wind risk 1/10 · Minimal
- Chance of severe wind over 30 yrs
- —
Air-quality risk 2/10 · Minimal
- Unhealthy air days now
- 1 days/yr
- Unhealthy air days in 30 yrs
- 1 days/yr
Risk factors via First Street. Map © Google.
Why this score? — see what drove the D+ grade
The composite is a weighted blend of 9 inputs, each scored 0–100. Each bar is that input's sub-score; the figure is the points it added to the 100-point composite (weight × sub-score).
- Cash flow +17.1/30.0
- Appreciation +9.2/10.0
- DSCR +5.3/10.0
- 1% rule +4.2/10.0
- Schools +3.7/10.0
- Livability +2.9/5.0
- Rent growth +2.5/5.0
- Condition / age +2.5/5.0
- ARV discount +0.0/15.0
$94,900
🖨 Deal sheet 📄 Offer letter ✓ Due diligence
Listing remarks MLS
With a little imagination, this turn-of-the-century two-bedroom, one-bath home with two bonus rooms, an upstairs loft, and a walk-in attic could be super cute! Farmhouse-style kitchen. Newer furnace and hot water heater. This house sits on a large, nicely landscaped corner lot within the City Limits and has a two-car attached garage. The home also comes with the attached solar panels
Key facts
- 8,712 sq ft lot
- 2 garage spots
- Built 1930
Property features AI
Finance
- Other: Solar feature; Approximately 0.2 acre lot
Exterior
- Parking: Attached 2-car garage
- Utilities: Public water; Septic system; Electric water heater; Electric service
- Home design: Residential property; 1 1/2-story; Built in 1930
- Construction: Aluminum construction; Crawlspace foundation; Roof type not specified
- Exterior features: Aluminum exterior; Subdivision lot; Sloping lot
Interior
- Kitchen: Kitchen (14 x 12); Range/Oven; Refrigerator; Dishwasher not listed
- Bedrooms: Main-level bedroom (10 x 10)
- Bathrooms: 1 full bathroom on the main level
- Heating & cooling: Forced air heating; Electric heat/fuel
- Interior features: Bay window; Window treatments
- Laundry & utility: Washer; Dryer; Main-level laundry
Neighborhood map
What this means for you Summary
Snapshot
- This is a 2-bed/1.0-bath single-family listed at $95k.
Deal economics
- At list price, monthly cash flow is $66 ($787/yr) — positive.
- The deal already cash-flows at list — no discount required.
- To meet the 1% rule (rent ≥ 1% of price), the offer needs to be $87k (8.2% below list).
- Recommended offer: $87k (8.2% below list) — sets the bar for 1% rule.
Location & tenants
- Location reads 58/100 on livability (#629 in MI) — a working-class tenant base; expect higher turnover. Strengths: cost of living A+, housing A+; Watch: health & safety C-, schools F, crime F.
- Standish-Sterling Community Schools (rural): math 37% / reading 51% proficiency, ranked #168 of 540 in MI (top 31%) — families likely to look elsewhere, expect single-tenant / working-renter base with shorter leases.
- Market conditions: 13 active listings in the ZIP; 30 units permitted in Arenac County in 2024 (0 in 5+ unit buildings).
Forward outlook
- In year one you build about $9k of equity ($656 loan paydown + $8k appreciation (8.4% local appreciation)).
- Arenac County population projected at -32% by 2050 — secular population decline; favor cash flow + early exit over multi-decade hold.
- At projected returns (8.4% appreciation + 3.0% rent growth), your $27k cash investment doubles in ~3 years — after that, you're playing with house money.
- By year 4, paydown + projected appreciation supports a ~$30k cash-out refi (75% LTV) — recoverable capital for the next deal without selling this one.
Negotiation context
- Only 2 days on market — expect competitive offers; lowballing is unlikely to land.
- 17 sale attempts since 11y ago with the ask held roughly flat each time — persistent listings suggest the price (not the market) is what's stuck; bring a comps-based counter.
Risks & watch-outs
- Watch-outs: built in 1930 — expect roof / HVAC / electrical / plumbing capex.
Questions for the listing agent
- Built in 1930 — when were the roof, HVAC, electrical panel, plumbing, and water heater last replaced?
- Is there a deadline driving the sale (1031 exchange, divorce, estate, relocation)? That informs how much negotiation room exists.
- Schools are F-rated, which usually means shorter tenancies and higher turnover. Who's the typical renter profile here, and what's been the actual vacancy rate?
- Crime grade is F in this area — have there been break-ins, vandalism, or insurance claims at this property in the last 3 years? What carrier currently insures it and at what premium?
- The area grade is low — what's the realistic commute time and amenity access for the typical tenant pool here? Any planned neighborhood developments (good or bad) we should know about?
- What's the average days-on-market for RENTAL listings here right now (not sales)? A rising rental-DOM trend means longer vacancies and softer asking-rent achievability than the comps imply.
- What's the recent tenant-quality profile in this submarket — average credit score on applications, eviction rate, late-payment / NSF rate, and stable-employment percentage? A property-management company in the area should have these aggregated.
- How much new for-sale + rental construction is in the pipeline within 1–3 miles? Heavy new supply typically softens prices + rents 12–24 months out; constrained supply supports both.
Investment metrics
- 1% rule
- 0.92% ✗
- Cap rate
- 7.12%
- Cash-on-cash
- 2.96%
- DSCR
- 1.13
- GRM
- 9.1
CMA / ARV
- ARV (on-the-fly)
- $68,530
- Comps found
- 1
Show comp detail 1 sale within ~0.75 mi
| Address | Dist | Beds/Ba | Sqft | Sold | Price | $/sf | Match |
|---|---|---|---|---|---|---|---|
| 205 Pine Street St | 0.05mi | 2/1.0 | 700 (-9%) | 18mo | $62,000 | $89 | 67 |
Match score weights: distance 35% · size 25% · config 20% · recency 20%. Top-matched comps best support the ARV.
Projected returns pro-forma
8.44% appreciation · 3.0% rent growth · sell at horizon
- IRR
- 23.2%
- Equity multiple
- 2.73×
- Total profit
- $45,977
- Equity at exit
- $74,985
- IRR
- 21.0%
- Equity multiple
- 5.91×
- Total profit
- $130,460
- Equity at exit
- $151,686
Cash invested: $26,572 (down + closing). Projections, not guarantees.
Landlord ↔ Tenant lean methodology
- Overall (STATE)
- 62 Landlord-Friendly
- State Michigan
- 62 Landlord-Friendly · EVEN
- County
- — inherits STATE
- City
- — inherits STATE
ZIP-level market 48749
- Home prices YoY
- 4.9%
- Active inventory
- 13
- Price-to-rent
- 9.1×
Monthly cashflow live
- Estimated rent
- $871 medium interval (Pro) →
- Mortgage (P&I)
- −$498
- Tax from tax record
- −$85 /mo · $1,022/yr
- Insurance
- −$40
- HOA
- −$0
- Vacancy / Maint / Mgmt
- −$183
- Net cashflow
- $66
Break-even live
UW: 25.0% down · 7.5% · 30yr · 1.5% tax · 5.0% vac · 8.0% maint · 8.0% mgmt
Financing live
Cash to close
- Down payment
- $23,725
- Closing costs
- $2,847
- Reserves months
- —
- Total cash needed
- —
Loan-product check · same deal, 3 products live
Conventional
25% down · 7.5% · 30yr
- Down + closing
- —
- Monthly P&I
- —
- Monthly cashflow
- —
- DSCR
- —
- Eligible?
- —
Personal DTI + credit; lowest rate.
DSCR
20% down · 8.5% · 30yr
- Down + closing
- —
- Monthly P&I
- —
- Monthly cashflow
- —
- DSCR
- —
- Eligible?
- —
No personal income docs; deal must DSCR.
Hard money
10% down · 12.0% · 12mo
- Down + closing
- —
- Monthly P&I
- —
- Monthly cashflow
- —
- DSCR
- —
- Eligible?
- —
Short-term bridge; refi at stabilization.
Listing history 3 events
-
2026-06-18days on market $94,900 Active 2 DOM
-
2026-06-17remarks 386-char remark
-
2026-06-17$94,900 Active 1 DOM
ⓘ Source: listings_history table (triggers on properties + properties_extension) + one-shot
backfill from property_details.listing_events for pre-trigger history.
Tax reassessment forecast MI · Partial reset (capped growth)
- Current annual tax
- $1,022 · $85/mo
- Projected year-2 tax
- $1,242 · $103/mo
- Expected delta
- +$220/yr (+$18/mo · 21.5%)
ⓘ Screening estimate from a state-policy table — verify with the county assessor before closing.
Climate risk First Street
- Flood 1/10 Low FEMA zone X (unshaded) · 0% chance over 30 yrs
- Wildfire 2/10 Low
- Heat 2/10 Low 7 d/yr ≥94°F today · 13 d/yr by 30 yrs out
- Wind 1/10 Low
- Air quality 2/10 Low 1 unhealthy d/yr today · 1 by 30 yrs out
Nearby sold comps map
Loading sold comps map…
Walkable amenities ~0.75 mi
Loading nearby amenities…
Taxation est. · year 1
- Rental income
- $10,449
- − Mortgage interest
- −$5,316
- − Property taxes
- −$1,022
- − Insurance
- −$474
- − Repairs & maintenance
- −$836
- − Management
- −$836
- − Depreciation
- −$2,761
- Taxable loss
- −$795
- Est. tax savings @ 24.0%
- +$191
- After-tax cash flow
- $978/yr
For passive investors: Depreciation is non-cash, so a rental often shows a tax loss while cash-flowing — sheltering income. Rental losses are passive: they offset passive income freely, and up to $25,000/yr can offset ordinary (W-2) income if you actively participate and your MAGI is under $100k (phasing out to $0 by $150k); unused losses carry forward. On sale, claimed depreciation is recaptured at up to 25%, and gains may owe capital-gains tax (a 1031 exchange can defer both). Figures are a year-1 estimate at your 24.0% rate — not tax advice; consult a CPA.
Schools (NCES district)
- District
- Standish-Sterling Community Schools
- NCES district ID
- 2632940
- Math proficiency
- 37% ▼ -6.00%
- Reading proficiency
- 51% ▼ -3.00%
- Median HH income
- $39,526
- Composite
- 36.76/100
- National rank
- #4573
- State rank
- #168 of 540 in MI
Livability — Omer
- Score
- 58/100
- State rank
- #629
- US rank
- #21172
Category grades
Schools grade is shown separately in the Schools card above.
Census & demographics
- Census place
- Omer, MI
- Population (ZIP)
- 1,214
Population outlook (Arenac County) Hauer SSP2
- Today (2025)
- 14,036 people
- By 2030
- 13,189 · -6.0%
- By 2040
- 11,309 · -19.4%
- By 2050
- 9,616 · -31.5%
- By 2075
- 6,776 · -51.7%
- By 2100
- 4,997 · -64.4%
Race, ethnicity, and origin ACS 2023
- Neighborhood character
- Predominantly White (92%)
- Race & ethnicity
- White 92% Black 4% Hispanic / Latino 3%
- Common ancestry
- Romanian 11% Lithuanian 6% Iranian 3%
- Foreign-born
- 1%
- Languages at home
- 96% English-only · Spanish 4%
Political lean MEDSL · Arenac
- 2024 margin
- Solid R (+40.6) · D 29.1% · R 69.7% · Other 1.3%
- 2008→2024 swing
- -44.9pp toward R · 2008: 4.3pp · 2024: -40.6pp
- All cycles
- 2024: R+40.6 2020: R+35.7 2016: R+33.1 2012: R+4.9 2008: D+4.3
Not yet ingested
- Civics
- —
Market trends
- HPI YoY
- ▲ 8.44%
- Current HPI
- 182.1014
- Rent YoY
- —
- Metro
- —
- State GDP YoY
- ▲ 1.37%
- F500 in state
- 28
Industry mix (Fortune 500 HQ in MI)
| Industry | F500 HQs | Revenue |
|---|---|---|
| Automotive Parts | 3 | $48B |
|
||
| Automotive | 2 | $372B |
|
||
| Chemicals | 1 | $45B |
|
||
| Automotive Retail | 1 | $29B |
|
||
| Healthcare / Medical Devices | 1 | $23B |
|
||
| Automotive Technology | 1 | $20B |
|
||
Price history
+954.4% since first listed37 events — show timeline
- 2026-06-16 Listed $94,900 REALCOMP
- 2026-06-16 Listed $94,900 MiRealSource-MiMLS
- 2025-01-21 Sold (Public Records) $86,000 Public Records
- 2025-01-21 Sold (MLS) $86,000 MiRealSource-MiMLS
- 2025-01-21 Sold (MLS) $86,000 REALCOMP
- 2025-01-21 Sold (MLS) $86,000 MiRealSource-MiMLS
- 2025-01-21 Sold (MLS) $86,000 REALCOMP
- 2025-01-20 Listed $89,000 MiRealSource-MiMLS
- 2025-01-11 Pending — MiRealSource-MiMLS
- 2025-01-10 Listed $89,000 REALCOMP
- 2025-01-09 Listed $89,000 MiRealSource-MiMLS
- 2022-12-28 Sold (Public Records) $21,900 Public Records
- 2021-07-16 Sold (Public Records) $21,900 Public Records
- 2018-03-12 Sold (MLS) $6,500 MiRealSource-MiMLS
- 2018-03-12 Sold (MLS) $6,500 MiRealSource-MiMLS
- 2018-03-12 Sold (MLS) $6,500 REALCOMP
- 2018-03-09 Sold (MLS) $6,500 MiRealSource-MiMLS
- 2018-03-09 Sold (MLS) $6,500 REALCOMP
- 2017-10-30 Listed $8,900 MiRealSource-MiMLS
- 2017-10-30 Listed $8,900 REALCOMP
- 2017-10-30 Listed $8,900 MiRealSource-MiMLS
- 2017-10-30 Listed $8,900 MiRealSource-MiMLS
- 2017-10-30 Listed $8,900 REALCOMP
- 2017-06-27 Listing Removed — MiRealSource-MiMLS
- 2017-06-27 Listing Removed — MiRealSource-MiMLS
- 2017-06-27 Listing Removed — REALCOMP
- 2017-03-01 Listed $11,900 MiRealSource-MiMLS
- 2017-03-01 Listed $11,900 MiRealSource-MiMLS
- 2017-03-01 Listed $11,900 REALCOMP
- 2015-11-21 Sold (MLS) $9,000 REALCOMP
- 2015-11-21 Listing Removed — MiRealSource-MiMLS
- 2015-11-21 Sold (MLS) $9,000 MiRealSource-MiMLS
- 2015-11-21 Listing Removed — REALCOMP
- 2015-11-13 Listed $9,000 REALCOMP
- 2015-11-13 Listed $9,000 MiRealSource-MiMLS
- 2015-09-09 Listed $9,000 MiRealSource-MiMLS
- 2015-09-09 Listed $9,000 REALCOMP
Property tax history
+2.1%/yrLatest (2025): $1,022 · -0.7% YoY. Source: county tax records.
Cash-flow waterfall
monthlySold comps — $/sqft
last 12 mo · ≤1 miLoading sold comps…