117 S Main St · Elkader, IA
Flood risk No data
- FEMA flood zone
- —
- Chance of flooding over 30 yrs
- —
- Est. flood insurance / yr
- —
Fire risk No data
- Est. fire insurance / yr
- —
Heat risk No data
- Hot days now (above threshold)
- —
- Hot days in 30 yrs
- —
Wind risk No data
- Chance of severe wind over 30 yrs
- —
Air-quality risk No data
- Unhealthy air days now
- —
- Unhealthy air days in 30 yrs
- —
Risk factors via First Street. Map © Google.
Why this score? — see what drove the C- grade
The composite is a weighted blend of 9 inputs, each scored 0–100. Each bar is that input's sub-score; the figure is the points it added to the 100-point composite (weight × sub-score).
- ARV discount +15.0/15.0
- Cash flow +9.7/30.0
- Appreciation +8.3/10.0
- Schools +5.3/10.0
- Livability +4.0/5.0
- DSCR +2.7/10.0
- Rent growth +2.5/5.0
- Condition / age +2.5/5.0
- 1% rule +1.9/10.0
$175,000
🖨 Deal sheet 📄 Offer letter ✓ Due diligence
Listing remarks MLS
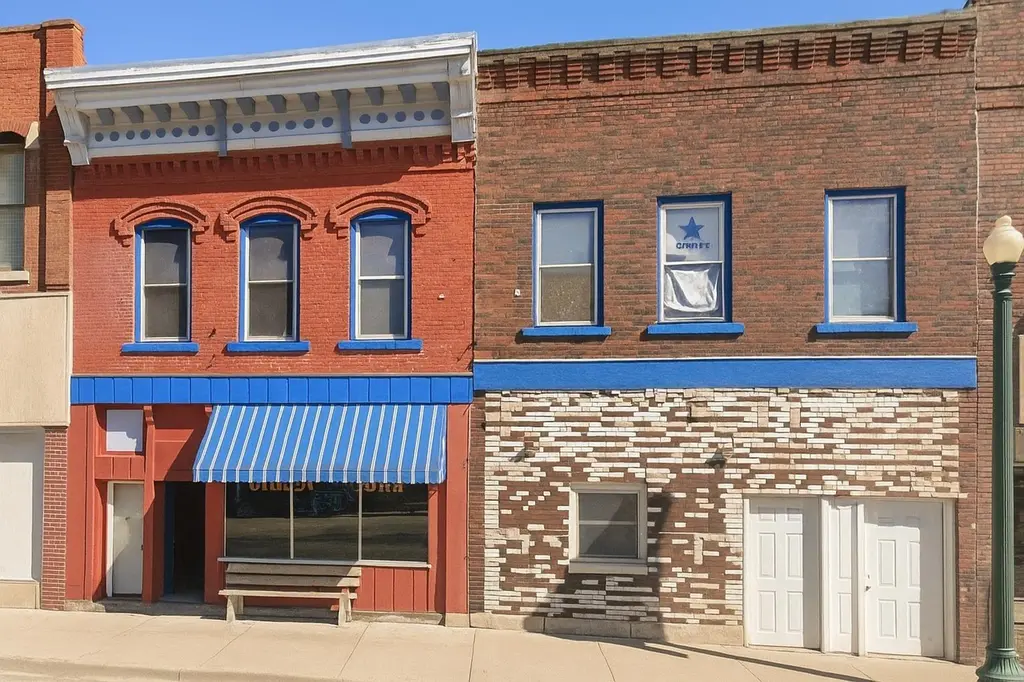
Historic apartment - style home for sale on Main Street in Elkader Iowa near the Keystone Bridge. The owner of this parcel is use the entire building for their living quarters. 2 bedroom, 2 bath. Both buildings are being sold AS-IS. Cherished by three local families over the past 60 years and by the current owner for 32 years. This package offers both commercial and residential income potential. Offered at $87,500. per building.
Key facts
- Near keystone bridge
- 2,360 sq ft lot
- Built 1900
Tags
Neighborhood map
What this means for you Summary
Snapshot
- This is a 3-bed/4.5-bath single-family listed at $175k.
Deal economics
- At list price, monthly cash flow is $-117 ($-1k/yr) — negative.
- To cash-flow at today's rent, offer at most $154k (11.8% below list).
- To meet the 1% rule (rent ≥ 1% of price), the offer needs to be $120k (31.4% below list).
- Recommended offer: $120k (31.4% below list) — sets the bar for 1% rule.
Location & tenants
- Location reads 80/100 on livability (#77 in IA, #1,634 nationally) — a professional / high-income tenant draw. Strengths: crime A+, cost of living A+, housing A+; Watch: amenities F, commute F.
- Central Community School District (rural): math 56% / reading 70% proficiency, ranked #214 of 289 in IA (top 74%) — acceptable for families but not a draw, mixed tenant base, ~2y average lease.
- Market conditions: 14 active listings in the ZIP; 48 units permitted in Clayton County in 2024 (0 in 5+ unit buildings).
Forward outlook
- In year one you build about $13k of equity ($1k loan paydown + $12k appreciation (6.6% local appreciation)).
- Clayton County population projected at -21% by 2050 — secular population decline; favor cash flow + early exit over multi-decade hold.
- By year 3, paydown + projected appreciation supports a ~$32k cash-out refi (75% LTV) — recoverable capital for the next deal without selling this one.
Negotiation context
- It's been on market 358 days — a 12% lower offer ($154k) is reasonable based on typical stale-listing flexibility.
Risks & watch-outs
- Watch-outs: built in 1900 — expect roof / HVAC / electrical / plumbing capex.
Questions for the listing agent
- What do current leases actually rent for vs. the listed asking? Can we see a recent rent roll and the last 12 months of T-12 income?
- It's been on market 358 days. Have you received any prior offers? Is the seller open to a 31% concession, seller financing, or rate buy-down credit?
- Built in 1900 — when were the roof, HVAC, electrical panel, plumbing, and water heater last replaced?
- Why hasn't it sold? Are there any deal-killer items the seller is aware of (foundation, flood, title, zoning, code violations)?
- Is there a deadline driving the sale (1031 exchange, divorce, estate, relocation)? That informs how much negotiation room exists.
- Schools are B-rated — typically a magnet for longer-tenancy family renters. What's the average tenant stay here, and is there a school-zone premium baked into asking?
- What's the average days-on-market for RENTAL listings here right now (not sales)? A rising rental-DOM trend means longer vacancies and softer asking-rent achievability than the comps imply.
- What's the recent tenant-quality profile in this submarket — average credit score on applications, eviction rate, late-payment / NSF rate, and stable-employment percentage? A property-management company in the area should have these aggregated.
- How much new for-sale + rental construction is in the pipeline within 1–3 miles? Heavy new supply typically softens prices + rents 12–24 months out; constrained supply supports both.
Investment metrics
- 1% rule
- 0.69% ✗
- Cap rate
- 5.49%
- Cash-on-cash
- -2.86%
- DSCR
- 0.87
- GRM
- 12.1
CMA / ARV
- ARV (median comp)
- $237,847
- List price
- $175,000
- Delta
- -26.42%
- Verdict
- UNDERPRICED
- Comps
- 5 within 1.0 mi
Show comp detail 4 sales within ~0.75 mi
| Address | Dist | Beds/Ba | Sqft | Sold | Price | $/sf | Match |
|---|---|---|---|---|---|---|---|
| 200 NE 2nd St | 0.21mi | 3/1.5 | 1,812 (+3%) | 13mo | $115,000 | $63 | 63 |
| 311 NE Second St. St | 0.25mi | 3/1.0 | 1,602 (-9%) | 0mo | $134,000 | $84 | 60 |
| 714 Davidson St | 0.57mi | 2/1.5 (-1) | 1,824 (+4%) | 11mo | $115,000 | $63 | 41 |
| 304 NW Spruce St | 0.23mi | 2/1.0 (-1) | 1,980 (+12%) | 22mo | $103,000 | $52 | 31 |
Match score weights: distance 35% · size 25% · config 20% · recency 20%. Top-matched comps best support the ARV.
Projected returns pro-forma
6.63% appreciation · 3.0% rent growth · sell at horizon
- IRR
- 14.6%
- Equity multiple
- 2.01×
- Total profit
- $49,634
- Equity at exit
- $117,047
- IRR
- 14.7%
- Equity multiple
- 4.07×
- Total profit
- $150,186
- Equity at exit
- $218,613
Cash invested: $49,000 (down + closing). Projections, not guarantees.
Landlord ↔ Tenant lean methodology
- Overall (STATE)
- 83 Strongly Landlord-Friendly
- State Iowa
- 83 Strongly Landlord-Friendly · R+6
- County
- — inherits STATE
- City
- — inherits STATE
ZIP-level market 52043
- Home prices YoY
- 4.8%
- Active inventory
- 14
- Price-to-rent
- 12.1×
Monthly cashflow live
- Estimated rent
- $1,201 medium interval (Pro) →
- Mortgage (P&I)
- −$918
- Tax from tax record
- −$75 /mo · $896/yr
- Insurance
- −$73
- HOA
- −$0
- Vacancy / Maint / Mgmt
- −$252
- Net cashflow
- $-117
Break-even live
UW: 25.0% down · 7.5% · 30yr · 1.5% tax · 5.0% vac · 8.0% maint · 8.0% mgmt
Financing live
Cash to close
- Down payment
- $43,750
- Closing costs
- $5,250
- Reserves months
- —
- Total cash needed
- —
Loan-product check · same deal, 3 products live
Conventional
25% down · 7.5% · 30yr
- Down + closing
- —
- Monthly P&I
- —
- Monthly cashflow
- —
- DSCR
- —
- Eligible?
- —
Personal DTI + credit; lowest rate.
DSCR
20% down · 8.5% · 30yr
- Down + closing
- —
- Monthly P&I
- —
- Monthly cashflow
- —
- DSCR
- —
- Eligible?
- —
No personal income docs; deal must DSCR.
Hard money
10% down · 12.0% · 12mo
- Down + closing
- —
- Monthly P&I
- —
- Monthly cashflow
- —
- DSCR
- —
- Eligible?
- —
Short-term bridge; refi at stabilization.
Listing history 16 events
-
2026-06-18days on market $175,000 Active 358 DOM
-
2026-06-17days on market $175,000 Active 357 DOM
-
2026-06-16days on market $175,000 Active 356 DOM
-
2026-06-15days on market $175,000 Active 355 DOM
-
2026-06-13days on market $175,000 Active 353 DOM
-
2026-06-12days on market $175,000 Active 352 DOM
-
2026-06-09days on market $175,000 Active 349 DOM
-
2026-06-08days on market $175,000 Active 348 DOM
-
2026-06-07days on market $175,000 Active 347 DOM
-
2026-06-05days on market $175,000 Active 345 DOM
-
2026-06-04days on market $175,000 Active 343 DOM
-
2026-06-02days on market $175,000 Active 342 DOM
-
2026-06-01days on market $175,000 Active 341 DOM
-
2026-05-31days on market $175,000 Active 340 DOM
-
2026-05-31days on market $175,000 Active 339 DOM
-
2025-06-25$175,000 Active 432-char remark
Show marketing remark (432 chars)
Historic apartment - style home for sale on Main Street in Elkader Iowa near the Keystone Bridge. The owner of this parcel is use the entire building for their living quarters. 2 bedroom, 2 bath. Both buildings are being sold AS-IS. Cherished by three local families over the past 60 years and by the current owner for 32 years. This package offers both commercial and residential income potential. Offered at $87,500. per building.
ⓘ Source: listings_history table (triggers on properties + properties_extension) + one-shot
backfill from property_details.listing_events for pre-trigger history.
Tax reassessment forecast IA · Partial reset (capped growth)
- Current annual tax
- $896 · $75/mo
- Projected year-2 tax
- $1,822 · $152/mo
- Expected delta
- +$926/yr (+$77/mo · 103.3%)
ⓘ Screening estimate from a state-policy table — verify with the county assessor before closing.
Nearby sold comps map
Loading sold comps map…
Walkable amenities ~0.75 mi
Loading nearby amenities…
Taxation est. · year 1
- Rental income
- $14,409
- − Mortgage interest
- −$9,803
- − Property taxes
- −$896
- − Insurance
- −$875
- − Repairs & maintenance
- −$1,153
- − Management
- −$1,153
- − Depreciation
- −$5,091
- Taxable loss
- −$4,561
- Est. tax savings @ 24.0%
- +$1,095
- After-tax cash flow
- $-306/yr
For passive investors: Depreciation is non-cash, so a rental often shows a tax loss while cash-flowing — sheltering income. Rental losses are passive: they offset passive income freely, and up to $25,000/yr can offset ordinary (W-2) income if you actively participate and your MAGI is under $100k (phasing out to $0 by $150k); unused losses carry forward. On sale, claimed depreciation is recaptured at up to 25%, and gains may owe capital-gains tax (a 1031 exchange can defer both). Figures are a year-1 estimate at your 24.0% rate — not tax advice; consult a CPA.
Schools (NCES district)
- District
- Central Community School District
- NCES district ID
- 1906840
- Math proficiency
- 56% ▼ -4.00%
- Reading proficiency
- 70% ▲ 7.00%
- Median HH income
- $49,750
- Composite
- 53.48/100
- National rank
- #1456
- State rank
- #214 of 289 in IA
Livability — Elkader
- Score
- 80/100
- State rank
- #77
- US rank
- #1634
Category grades
Schools grade is shown separately in the Schools card above.
Census & demographics
- Census place
- Elkader, IA
- Population (ZIP)
- 1,853
Population outlook (Clayton County) Hauer SSP2
- Today (2025)
- 16,656 people
- By 2030
- 15,986 · -4.0%
- By 2040
- 14,554 · -12.6%
- By 2050
- 13,187 · -20.8%
- By 2075
- 11,131 · -33.2%
- By 2100
- 9,733 · -41.6%
Race, ethnicity, and origin ACS 2023
- Neighborhood character
- Predominantly White (96%)
- Race & ethnicity
- White 96% Two or more races 4% Hispanic / Latino 3%
- Common ancestry
- Portuguese 11% Romanian 2% Iranian 1%
- Foreign-born
- 2% · Canada
- Languages at home
- 98% English-only · Spanish 2%
Political lean MEDSL · Clayton
- 2024 margin
- Solid R (+34.5) · D 32.2% · R 66.7% · Other 1.2%
- 2008→2024 swing
- -51.7pp toward R · 2008: 17.2pp · 2024: -34.5pp
- All cycles
- 2024: R+34.5 2020: R+28.8 2016: R+22.8 2012: D+6.9 2008: D+17.2
Not yet ingested
- Civics
- —
Market trends
- HPI YoY
- ▲ 6.63%
- Current HPI
- 143.93
- Rent YoY
- —
- Metro
- —
- State GDP YoY
- ▲ 2.48%
- F500 in state
- 4
Industry mix (Fortune 500 HQ in IA)
| Industry | F500 HQs | Revenue |
|---|---|---|
| Financial Services | 1 | $16B |
|
||
| Retail / Convenience | 1 | $15B |
|
||
Price history
1 event — show timeline
- 2025-06-25 Listed $175,000 NEIRBR as distributed by MLS GRID
Property tax history
+2.1%/yrLatest (2025): $896 · -19.7% YoY. Source: county tax records.
Cash-flow waterfall
monthlySold comps — $/sqft
last 12 mo · ≤1 miLoading sold comps…