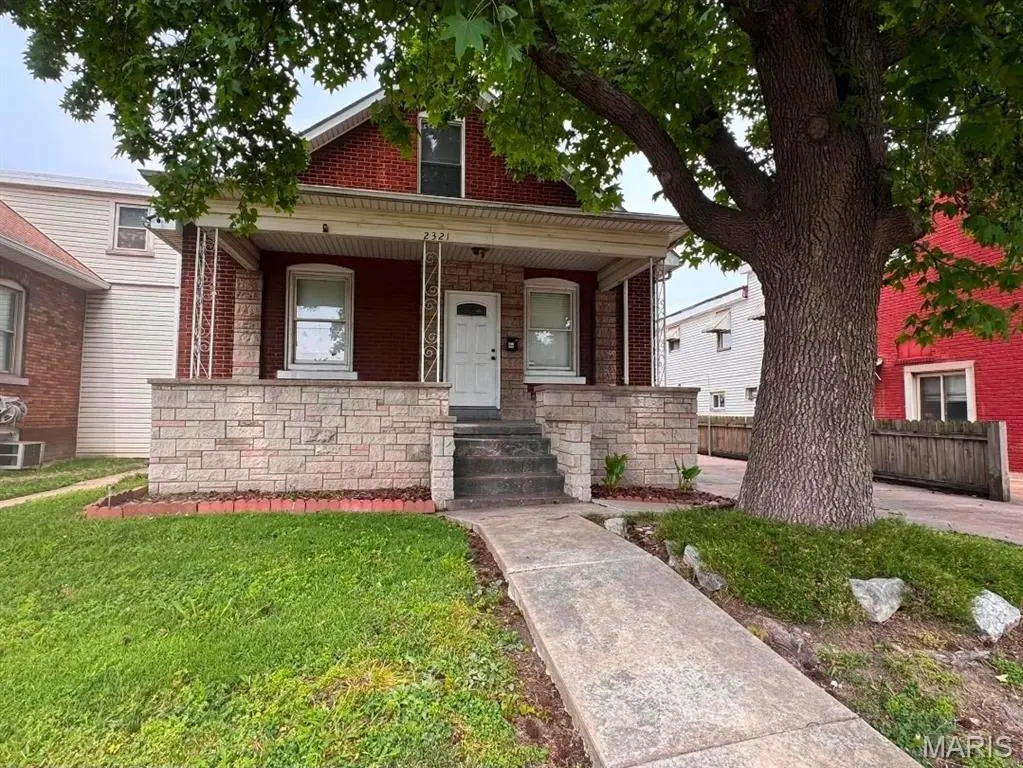
2321 Washington Ave · Granite City, IL
Flood risk 1/10 · Minimal
- FEMA flood zone
- X
- Chance of flooding over 30 yrs
- 0.0%
- Est. flood insurance / yr
- $473 – $860
Fire risk 1/10 · Minimal
- Est. fire insurance / yr
- $804 – $1,492
Heat risk 6/10 · Moderate
- Hot days now (above 108°F)
- 7 days/yr
- Hot days in 30 yrs
- 21 days/yr
Wind risk 2/10 · Minimal
- Chance of severe wind over 30 yrs
- 1.0%
Air-quality risk 4/10 · Minor
- Unhealthy air days now
- 4 days/yr
- Unhealthy air days in 30 yrs
- 5 days/yr
Risk factors via First Street. Map © Google.
Why this score? — see what drove the F grade
The composite is a weighted blend of 9 inputs, each scored 0–100. Each bar is that input's sub-score; the figure is the points it added to the 100-point composite (weight × sub-score).
- ARV discount +7.5/15.0
- Cash flow +4.6/30.0
- Livability +3.2/5.0
- Rent growth +2.9/5.0
- Condition / age +2.5/5.0
- Schools +0.9/10.0
- 1% rule +0.3/10.0
- DSCR +0.0/10.0
- Appreciation +0.0/10.0
$140,000
🖨 Deal sheet 📄 Offer letter ✓ Due diligence
Listing remarks
Unique opportunity in Granite City! Currently configured as four income-producing units, this versatile property offers multiple possibilities for investors, owner-occupants, or those seeking a multi-generational living arrangement. The main residence features a spacious 2-bedroom, 2-bath layout with a living room, kitchen, and full basement. The upper level offers a separate 1-bedroom, 1-bath living space complete with its own kitchen, breakfast nook, and living area. A detached two-story garage building includes a one-car garage and two additional efficiency-style living spaces, each with a private bath. Currently utilized as four separate rental units, the property generates multiple str
Key facts
- 4,791 sq ft lot
- Garage
- Built 1918
Property features AI
Finance
- Other: No pool; Lease not considered
Exterior
- Parking: Garage faces front; 1-car garage
- Utilities: Public water; Public sewer; Electric service by Ameren; Cable available; Electricity connected; Water connected; Sewer connected
- Home design: Single family residence (quadruplex structure); One and one-half levels; Residential property
- Construction: Brick construction; Architectural shingle roof; Concrete perimeter foundation; Built information sourced from public records
- Exterior features: Patio; Porch; Privacy fencing; Level lot; Concrete road frontage on a city street
Interior
- Kitchen: Oven, Range, Free-Standing Refrigerator
- Bedrooms: 10 total bedrooms (2 on main level, 3 upper level, 5 lower level; 5 combined main and upper)
- Flooring: Carpet; Vinyl
- Bathrooms: 4 full bathrooms, 1 half bathroom (main level has 1 full and 1 half; upper level has 3 full)
- Heating & cooling: Forced air heating; Ceiling fans for cooling
- Interior features: Oven, Range, Free-Standing Refrigerator; Basement with walk-out access; No fireplace
- Laundry & utility: Laundry located in bathroom
Neighborhood map
What this means for you Summary
Snapshot
- This is a 1-bed/2.0-bath single-family listed at $140k.
Deal economics
- At list price, monthly cash flow is $-358 ($-4k/yr) — negative.
- To cash-flow at today's rent, offer at most $77k (45.1% below list).
- To meet the 1% rule (rent ≥ 1% of price), the offer needs to be $74k (47.2% below list).
- Recommended offer: $74k (47.2% below list) — sets the bar for 1% rule.
- Cap rate 3.2% vs local median 7.0% in Granite City — below-typical yield; the buyer is paying a premium for something (appreciation thesis, condition, location) that the cap rate doesn't capture.
Location & tenants
- Location reads 65/100 on livability (#623 in IL) — a middle-class / working-renter tenant base. Strengths: cost of living A+, housing A+; Watch: crime F, amenities F, commute F.
- Granite City CUSD 9 (suburban): math 9% / reading 11% proficiency, ranked #570 of 620 in IL (top 92%) — low school quality limits family demand, transient renter base, plan for 1-2y turnover.
- Zoned schools: Granite City High School (math 10% / reading 12%, grade F, #522 of 693 statewide, top 76%, 1,805 students, 0% FRL) — zoned schools average 0% FRL vs 59% district-wide (59 pts lower); this property's tenant base skews higher-income than the district average.
- Market conditions: Rents rising (+1.7%/yr); 194 active listings in the ZIP; 6 comparable units currently listed for rent nearby; rentals at typical pace (median 22d on market — plan ~3-4 weeks tenant-placement turnaround); 336 units permitted in Madison County in 2024 (0 in 5+ unit buildings).
- This rent is only 15% of the median local income ($60k/yr) — well below the 30% rent-burden line; pricing power to push rent on renewal without tenant pushback.
Forward outlook
- Local home prices are declining (-3.0%/yr); year-one equity from $968 of loan paydown is wiped out by about $4k of value loss. Plan a longer hold.
- Madison County population projected at -18% by 2050 — secular population decline; favor cash flow + early exit over multi-decade hold.
Negotiation context
- Only 8 days on market — expect competitive offers; lowballing is unlikely to land.
Risks & watch-outs
- Watch-outs: built in 1918 — expect roof / HVAC / electrical / plumbing capex.
- Climate carrying-cost: extreme-heat days projected 7→21/yr by 2055 (HVAC capex compounding) — expect insurance premiums to compound above CPI over the hold.
Questions for the listing agent
- What do current leases actually rent for vs. the listed asking? Can we see a recent rent roll and the last 12 months of T-12 income?
- Built in 1918 — when were the roof, HVAC, electrical panel, plumbing, and water heater last replaced?
- Is there a deadline driving the sale (1031 exchange, divorce, estate, relocation)? That informs how much negotiation room exists.
- Schools are F-rated, which usually means shorter tenancies and higher turnover. Who's the typical renter profile here, and what's been the actual vacancy rate?
- Crime grade is F in this area — have there been break-ins, vandalism, or insurance claims at this property in the last 3 years? What carrier currently insures it and at what premium?
- The area grade is low — what's the realistic commute time and amenity access for the typical tenant pool here? Any planned neighborhood developments (good or bad) we should know about?
- What's the average days-on-market for RENTAL listings here right now (not sales)? A rising rental-DOM trend means longer vacancies and softer asking-rent achievability than the comps imply.
- What's the recent tenant-quality profile in this submarket — average credit score on applications, eviction rate, late-payment / NSF rate, and stable-employment percentage? A property-management company in the area should have these aggregated.
- How much new for-sale + rental construction is in the pipeline within 1–3 miles? Heavy new supply typically softens prices + rents 12–24 months out; constrained supply supports both.
Investment metrics
- 1% rule
- 0.53% ✗
- Cap rate
- 3.23%
- Cash-on-cash
- -10.95%
- DSCR
- 0.51
- GRM
- 15.8
CMA / ARV
- ARV (on-the-fly)
- $39,000
- Comps found
- 3
Show comp detail 3 sales within ~0.75 mi
| Address | Dist | Beds/Ba | Sqft | Sold | Price | $/sf | Match |
|---|---|---|---|---|---|---|---|
| 2412 Bromley Ave | 0.13mi | 2/1.0 (+1) | 616 (+3%) | 18mo | $40,000 | $65 | 66 |
| 2625 Hodges Ave | 0.68mi | 1/1.0 | 640 (+7%) | 17mo | $24,900 | $39 | 39 |
| 2622 Lincoln Ave | 0.65mi | 2/1.0 (+1) | 656 (+9%) | 13mo | $50,000 | $76 | 34 |
Match score weights: distance 35% · size 25% · config 20% · recency 20%. Top-matched comps best support the ARV.
Projected returns pro-forma
-3.0% appreciation · 1.67% rent growth · sell at horizon
- IRR
- -37.6%
- Equity multiple
- -0.18×
- Total profit
- $-46,441
- Equity at exit
- $20,874
- IRR
- -64.6%
- Equity multiple
- -0.88×
- Total profit
- $-73,685
- Equity at exit
- $12,105
Cash invested: $39,200 (down + closing). Projections, not guarantees.
Landlord ↔ Tenant lean methodology
- Overall (STATE)
- 43 Moderately Tenant-Leaning
- State Illinois
- 43 Moderately Tenant-Leaning · D+7
- County
- — inherits STATE
- City
- — inherits STATE
ZIP-level market 62040
- Home prices YoY
- -21.8%
- Rents YoY
- 1.7%
- Active inventory
- 194
- Price-to-rent
- 15.8×
Monthly cashflow live
- Estimated rent
- $739 high interval (Pro) →
- Mortgage (P&I)
- −$734
- Tax from tax record
- −$149 /mo · $1,791/yr
- Insurance
- −$58
- HOA
- −$0
- Vacancy / Maint / Mgmt
- −$155
- Net cashflow
- $-358
Break-even live
UW: 25.0% down · 7.5% · 30yr · 1.5% tax · 5.0% vac · 8.0% maint · 8.0% mgmt
Financing live
Cash to close
- Down payment
- $35,000
- Closing costs
- $4,200
- Reserves months
- —
- Total cash needed
- —
Loan-product check · same deal, 3 products live
Conventional
25% down · 7.5% · 30yr
- Down + closing
- —
- Monthly P&I
- —
- Monthly cashflow
- —
- DSCR
- —
- Eligible?
- —
Personal DTI + credit; lowest rate.
DSCR
20% down · 8.5% · 30yr
- Down + closing
- —
- Monthly P&I
- —
- Monthly cashflow
- —
- DSCR
- —
- Eligible?
- —
No personal income docs; deal must DSCR.
Hard money
10% down · 12.0% · 12mo
- Down + closing
- —
- Monthly P&I
- —
- Monthly cashflow
- —
- DSCR
- —
- Eligible?
- —
Short-term bridge; refi at stabilization.
Rent comps 6 comps
| Address | Beds | Baths | Sqft | Rent | $/sqft | DOM | Units | Dist |
|---|---|---|---|---|---|---|---|---|
| 1215 22nd St Unit 1223 Granite City, IL | 1.0 | 1.0 | 600 | $550 | $0.92 | 21d | 1 | 0.40mi |
| 1215 22nd St Unit 1227 Granite City, IL | 1.0 | 1.0 | 600 | $600 | $1.00 | 43d | 1 | 0.40mi |
| 1709 Edison Ave Unit 1709 Granite City, IL | 1.0 | 1.0 | 700 | $800 | $1.14 | 14d | 1 | 0.94mi |
| 2734 Center St Unit D Granite City, IL | 1.0 | 1.0 | 680 | $1,025 | $1.51 | 12d | 1 | 0.95mi |
| 2512 W 24th St Granite City, IL | 1.0 | 1.0 | 650 | $495 | $0.76 | 23d | 1 | 1.30mi |
| 2000 Meridian Ave Granite City, IL | 1.0 | 1.0 | 488 | $950 | $1.95 | 14d | 1 | 1.33mi |
Listing history 14 events
-
2026-06-18days on market $140,000 Active 8 DOM
-
2026-06-17days on market $140,000 Active 7 DOM
-
2026-06-16days on market $140,000 Active 6 DOM
-
2026-06-15days on market $140,000 Active 5 DOM
-
2026-06-13days on market $140,000 Active 3 DOM
-
2026-06-13statusdays on market $140,000 Active 2 DOM
-
2026-06-09days on market $140,000 Coming Soon 11 DOM
-
2026-06-08days on market $140,000 Coming Soon 10 DOM
-
2026-06-07days on market $140,000 Coming Soon 9 DOM
-
2026-06-05days on market $140,000 Coming Soon 6 DOM
-
2026-06-03days on market $140,000 Coming Soon 5 DOM
-
2026-06-02days on market $140,000 Coming Soon 4 DOM
-
2026-06-01days on market $140,000 Coming Soon 3 DOM
-
2026-05-31days on market $140,000 Coming Soon 2 DOM
ⓘ Source: listings_history table (triggers on properties + properties_extension) + one-shot
backfill from property_details.listing_events for pre-trigger history.
Tax reassessment forecast IL · Partial reset (capped growth)
- Current annual tax
- $1,791 · $149/mo
- Projected year-2 tax
- $2,484 · $207/mo
- Expected delta
- +$694/yr (+$58/mo · 38.7%)
ⓘ Screening estimate from a state-policy table — verify with the county assessor before closing.
Climate risk First Street
- Flood 1/10 Low FEMA zone X · 0% chance over 30 yrs
- Wildfire 1/10 Low
- Heat 6/10 Major 7 d/yr ≥108°F today · 21 d/yr by 30 yrs out
- Wind 2/10 Low 100% chance of damaging wind over 30 yrs
- Air quality 4/10 Moderate 4 unhealthy d/yr today · 5 by 30 yrs out
Nearby sold comps map
Loading sold comps map…
Walkable amenities ~0.75 mi
Loading nearby amenities…
Taxation est. · year 1
- Rental income
- $8,874
- − Mortgage interest
- −$7,842
- − Property taxes
- −$1,791
- − Insurance
- −$700
- − Repairs & maintenance
- −$710
- − Management
- −$710
- − Depreciation
- −$4,073
- Taxable loss
- −$6,952
- Est. tax savings @ 24.0%
- +$1,668
- After-tax cash flow
- $-2,622/yr
For passive investors: Depreciation is non-cash, so a rental often shows a tax loss while cash-flowing — sheltering income. Rental losses are passive: they offset passive income freely, and up to $25,000/yr can offset ordinary (W-2) income if you actively participate and your MAGI is under $100k (phasing out to $0 by $150k); unused losses carry forward. On sale, claimed depreciation is recaptured at up to 25%, and gains may owe capital-gains tax (a 1031 exchange can defer both). Figures are a year-1 estimate at your 24.0% rate — not tax advice; consult a CPA.
Schools (NCES district)
- District
- Granite City CUSD 9
- NCES district ID
- 1717280
- Math proficiency
- 9% ▼ -4.00%
- Reading proficiency
- 11% ▼ -7.00%
- Median HH income
- $45,082
- Composite
- 9.15/100
- National rank
- #9864
- State rank
- #570 of 620 in IL
Livability — Granite City
- Score
- 65/100
- State rank
- #623
- US rank
- #12751
Category grades
Schools grade is shown separately in the Schools card above.
Census & demographics
- Census place
- Granite City, IL
- County
- Madison County · 189,064 people
- City population
- 40,404
- Metro
- St. Louis, MO-IL
- Population (ZIP)
- 40,404
- Household income
- $60,031
- Rent vs Own
- Severe rent burden
- 923.0
Population outlook (Madison County) Hauer SSP2
- Today (2025)
- 258,371 people
- By 2030
- 251,523 · -2.7%
- By 2040
- 233,640 · -9.6%
- By 2050
- 213,042 · -17.5%
- By 2075
- 165,255 · -36.0%
- By 2100
- 123,953 · -52.0%
Race, ethnicity, and origin ACS 2023
- Neighborhood character
- Predominantly White (76%)
- Race & ethnicity
- White 76% Hispanic / Latino 9% Black 9% Two or more races 7% Asian 1%
- Hispanic origin (detail)
- Mexican 7%
- Common ancestry
- Romanian 2% Lithuanian 2% Serbian 2%
- Foreign-born
- 3% · Canada, Vietnam
- Languages at home
- 93% English-only · Spanish 5%
Political lean MEDSL · Madison
- 2024 margin
- R (+13.3) · D 42.5% · R 55.8% · Other 1.8%
- 2008→2024 swing
- -22.5pp toward R · 2008: 9.2pp · 2024: -13.3pp
- All cycles
- 2024: R+13.3 2020: R+13.2 2016: R+15.6 2012: R+1.4 2008: D+9.2
Not yet ingested
- Civics
- —
Market trends
- HPI YoY
- ▼ -56.88%
- Current HPI
- 204.4612
- Rent YoY
- ▲ 1.67%
- Metro
- St. Louis, MO-IL
- State GDP YoY
- ▲ 1.59%
- F500 in state
- 60
Industry mix (Fortune 500 HQ in IL)
| Industry | F500 HQs | Revenue |
|---|---|---|
| Insurance | 4 | $201B |
|
||
| Consumer Goods | 4 | $87B |
|
||
| Industrial Machinery | 3 | $64B |
|
||
| Healthcare | 2 | $55B |
|
||
| Retail / Pharmacy | 1 | $148B |
|
||
| Agriculture / Food | 1 | $86B |
|
||
Price history
1 event — show timeline
- 2026-05-29 Coming Soon $140,000 MARIS as Distributed by MLS Grid
Property tax history
+1.4%/yrLatest (2024): $1,791 · +1.6% YoY. Source: county tax records.
Cash-flow waterfall
monthlySold comps — $/sqft
last 12 mo · ≤1 miLoading sold comps…