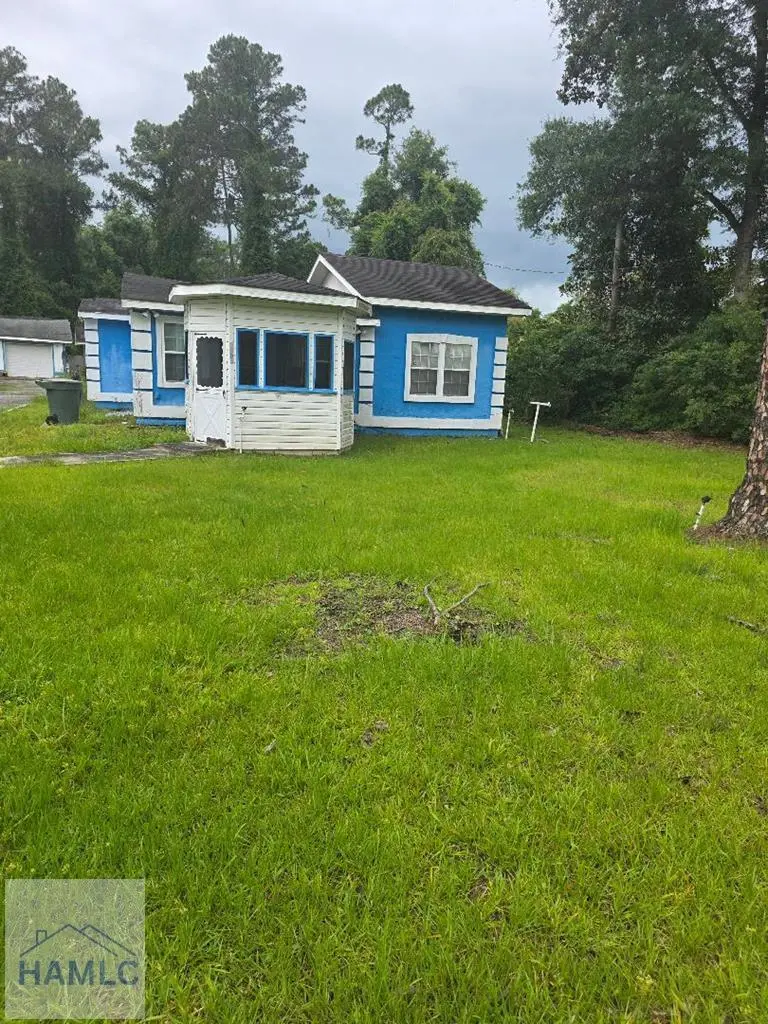
1305 4th Street Ext · Jesup, GA
Flood risk 7/10 · Major
- FEMA flood zone
- A
- Chance of flooding over 30 yrs
- 0.99%
- Est. flood insurance / yr
- $1,009 – $1,996
Fire risk 5/10 · Moderate
- Est. fire insurance / yr
- $963 – $1,789
Heat risk 8/10 · Major
- Hot days now (above 109°F)
- 7 days/yr
- Hot days in 30 yrs
- 17 days/yr
Wind risk 8/10 · Major
- Chance of severe wind over 30 yrs
- 98.0%
Air-quality risk 2/10 · Minimal
- Unhealthy air days now
- 2 days/yr
- Unhealthy air days in 30 yrs
- 2 days/yr
Risk factors via First Street. Map © Google.
Why this score? — see what drove the B- grade
The composite is a weighted blend of 9 inputs, each scored 0–100. Each bar is that input's sub-score; the figure is the points it added to the 100-point composite (weight × sub-score).
- Cash flow +30.0/30.0
- 1% rule +10.0/10.0
- DSCR +10.0/10.0
- ARV discount +7.5/15.0
- Livability +3.5/5.0
- Schools +2.9/10.0
- Rent growth +2.5/5.0
- Condition / age +2.5/5.0
- Appreciation +0.0/10.0
$100,000
🖨 Deal sheet 📄 Offer letter ✓ Due diligence
Listing remarks
Spacious 2,540-square-foot home on a 0.75-acre lot in Jesup, GA. Originally built in the 1940s and rebuilt in the 1970s, this home has great bones and plenty of potential. Features include: 3 bedrooms, 2 bathrooms Large master suite with fireplace, built-in shelves, and sitting area Two additional bedrooms with a full bath Multiple living/sitting areas 0.75-acre lot Great opportunity to update and make it your own. Vacant, price to sale$
Key facts
- 0.75 acre lot
- Garage
- Built 1970
Property features AI
Finance
- HOA & community: Community features: Other
Exterior
- Parking: 2 total parking spaces (2 covered); 1 garage space; Carport; Open parking; Driveway; Workshop in garage
- Security: Smoke detectors
- Utilities: Public water; Public sewer; Electricity available and connected; Phone service available
- Home design: Single family residence; Residential property
- Construction: Stucco, frame, and wood siding construction; Slab foundation; Other roof type; Built area approximately 2,540 (square feet)
- Exterior features: Storm doors; Privacy fencing; Outbuilding; Has a view
Interior
- Kitchen: Electric range; Refrigerator
- Bedrooms: Total of 7 rooms (bedroom count not specified)
- Flooring: Tile
- Bathrooms: 2 full bathrooms
- Heating & cooling: Central heating; Central air; Ceiling fans
- Interior features: Built-in features; Ceiling fans; Crown molding; Furnished; Fireplace in the master bedroom
- Laundry & utility: Washer hookup; Electric water heater
Neighborhood map
What this means for you Summary
Snapshot
- This is a 3-bed/2.0-bath single-family listed at $100k.
Deal economics
- At list price, monthly cash flow is $504 ($6k/yr) — positive.
- The deal already cash-flows at list — no discount required.
- Meets the 1% rule at list price ($2k rent vs $100k).
- Recommended offer: $98k (1.5% below list) — sets the bar for market timing.
- Cap rate 13.8% vs local median 4.5% in Jesup — top-decile yield for the area; either an underpriced asset or a hidden risk that comps aren't pricing in. Stress-test before assuming the spread holds.
Location & tenants
- Location reads 69/100 on livability (#112 in GA) — a middle-class / working-renter tenant base. Strengths: cost of living A+, housing A+, health & safety A+; Watch: amenities F, commute F, employment D-.
- Wayne County (rural): math 35% / reading 35% proficiency, ranked #68 of 174 in GA (top 39%) — families likely to look elsewhere, expect single-tenant / working-renter base with shorter leases; 60% free/reduced lunch — lower-income household profile, screen leases tightly.
- Zoned schools: Jesup Elementary School (math 32% / reading 22%, grade F, #689 of 1,228 statewide, top 58%, 680 students, 75% FRL); Wayne County High School (math 32% / reading 40%, grade F, #74 of 424 statewide, top 18%, 1,467 students, 75% FRL) — zoned schools average 75% FRL vs 60% district-wide (15 pts higher); higher-poverty schools than district average — tighter screening recommended.
- Market conditions: 172 active listings in the ZIP; 163 units permitted in Wayne County in 2024 (0 in 5+ unit buildings).
Forward outlook
- Local home prices are declining (-3.0%/yr); year-one equity from $691 of loan paydown is wiped out by about $3k of value loss. Plan a longer hold.
- Wayne County population projected to shrink 10% by 2050 — rents likely to lag national; underwrite the cash flow, not the appreciation.
- At projected returns (-3.0% appreciation + 3.0% rent growth), your $28k cash investment doubles in ~6 years — after that, you're playing with house money.
Negotiation context
- It's been on market 19 days — a 2% lower offer ($98k) is reasonable based on typical stale-listing flexibility.
Risks & watch-outs
- Watch-outs: flood insurance adds $125/mo.
- Climate carrying-cost: in FEMA flood zone A (mandatory federal flood insurance); severe wind risk, 98% chance of damaging wind over 30y; moderate wildfire risk; extreme-heat days projected 7→17/yr by 2055 (HVAC capex compounding) — expect insurance premiums to compound above CPI over the hold.
Questions for the listing agent
- Built in 1970 — when were the roof, HVAC, electrical panel, plumbing, and water heater last replaced?
- What's the actual annual flood-insurance premium (NFIP or private), and is the property in a SFHA with mandatory coverage?
- Is there a deadline driving the sale (1031 exchange, divorce, estate, relocation)? That informs how much negotiation room exists.
- Schools are F-rated, which usually means shorter tenancies and higher turnover. Who's the typical renter profile here, and what's been the actual vacancy rate?
- What's the average days-on-market for RENTAL listings here right now (not sales)? A rising rental-DOM trend means longer vacancies and softer asking-rent achievability than the comps imply.
- What's the recent tenant-quality profile in this submarket — average credit score on applications, eviction rate, late-payment / NSF rate, and stable-employment percentage? A property-management company in the area should have these aggregated.
- How much new for-sale + rental construction is in the pipeline within 1–3 miles? Heavy new supply typically softens prices + rents 12–24 months out; constrained supply supports both.
Investment metrics
- 1% rule
- 1.69% ✓
- Cap rate
- 13.84%
- Cash-on-cash
- 26.97%
- DSCR
- 2.20
- GRM
- 4.9
CMA / ARV
No comps found within radius.
Projected returns pro-forma
-3.0% appreciation · 3.0% rent growth · sell at horizon
- IRR
- 14.3%
- Equity multiple
- 1.57×
- Total profit
- $16,014
- Equity at exit
- $14,910
- IRR
- 23.1%
- Equity multiple
- 2.99×
- Total profit
- $55,739
- Equity at exit
- $8,646
Cash invested: $28,000 (down + closing). Projections, not guarantees.
Landlord ↔ Tenant lean methodology
- Overall (STATE)
- 90 Strongly Landlord-Friendly
- State Georgia
- 90 Strongly Landlord-Friendly · R+3
- County
- — inherits STATE
- City
- — inherits STATE
ZIP-level market 31545
- Home prices YoY
- -6.4%
- Active inventory
- 172
- Price-to-rent
- 4.9×
Monthly cashflow live
- Estimated rent
- $1,689 medium interval (Pro) →
- Mortgage (P&I)
- −$524
- Tax from tax record
- −$139 /mo · $1,663/yr
- Insurance
- −$42
- Flood insurance flood zone
- −$125 /mo · $1,502/yr
- HOA
- −$0
- Vacancy / Maint / Mgmt
- −$355
- Net cashflow
- $504
Break-even live
UW: 25.0% down · 7.5% · 30yr · 1.5% tax · 5.0% vac · 8.0% maint · 8.0% mgmt
Financing live
Cash to close
- Down payment
- $25,000
- Closing costs
- $3,000
- Reserves months
- —
- Total cash needed
- —
Loan-product check · same deal, 3 products live
Conventional
25% down · 7.5% · 30yr
- Down + closing
- —
- Monthly P&I
- —
- Monthly cashflow
- —
- DSCR
- —
- Eligible?
- —
Personal DTI + credit; lowest rate.
DSCR
20% down · 8.5% · 30yr
- Down + closing
- —
- Monthly P&I
- —
- Monthly cashflow
- —
- DSCR
- —
- Eligible?
- —
No personal income docs; deal must DSCR.
Hard money
10% down · 12.0% · 12mo
- Down + closing
- —
- Monthly P&I
- —
- Monthly cashflow
- —
- DSCR
- —
- Eligible?
- —
Short-term bridge; refi at stabilization.
Listing history 15 events
-
2026-06-19days on market $100,000 Active 19 DOM
-
2026-06-18days on market $100,000 Active 18 DOM
-
2026-06-17pricedays on market $100,000 Active 17 DOM
-
2026-06-16days on market $115,500 Active 16 DOM
-
2026-06-15days on market $115,500 Active 15 DOM
-
2026-06-14days on market $115,500 Active 13 DOM
-
2026-06-13days on market $115,500 Active 12 DOM
-
2026-06-10days on market $115,500 Active 10 DOM
-
2026-06-09days on market $115,500 Active 9 DOM
-
2026-06-08days on market $115,500 Active 8 DOM
-
2026-06-07days on market $115,500 Active 7 DOM
-
2026-06-05days on market $115,500 Active 4 DOM
-
2026-06-02days on market $115,500 Active 2 DOM
-
2026-06-01remarks 447-char remark
-
2026-06-01$115,500 Active 1 DOM
ⓘ Source: listings_history table (triggers on properties + properties_extension) + one-shot
backfill from property_details.listing_events for pre-trigger history.
Tax reassessment forecast GA · Resets to sale price
- Current annual tax
- $1,663 · $139/mo
- Projected year-2 tax
- $1,663 · $139/mo
- Expected delta
- $0/yr ($0/mo · 0.0%)
ⓘ Screening estimate from a state-policy table — verify with the county assessor before closing.
Climate risk First Street
- Flood 7/10 Severe FEMA zone A · 99% chance over 30 yrs
- Wildfire 5/10 Major
- Heat 8/10 Severe 7 d/yr ≥109°F today · 17 d/yr by 30 yrs out
- Wind 8/10 Severe 98% chance of damaging wind over 30 yrs
- Air quality 2/10 Low 2 unhealthy d/yr today · 2 by 30 yrs out
Nearby sold comps map
Loading sold comps map…
Walkable amenities ~0.75 mi
Loading nearby amenities…
Taxation est. · year 1
- Rental income
- $20,263
- − Mortgage interest
- −$5,602
- − Property taxes
- −$1,663
- − Insurance
- −$2,002
- − Repairs & maintenance
- −$1,621
- − Management
- −$1,621
- − Depreciation
- −$2,909
- Taxable income
- $4,845
- Est. tax owed @ 24.0%
- −$1,163
- After-tax cash flow
- $4,887/yr
For passive investors: Depreciation is non-cash, so a rental often shows a tax loss while cash-flowing — sheltering income. Rental losses are passive: they offset passive income freely, and up to $25,000/yr can offset ordinary (W-2) income if you actively participate and your MAGI is under $100k (phasing out to $0 by $150k); unused losses carry forward. On sale, claimed depreciation is recaptured at up to 25%, and gains may owe capital-gains tax (a 1031 exchange can defer both). Figures are a year-1 estimate at your 24.0% rate — not tax advice; consult a CPA.
Schools (NCES district)
- District
- Wayne County
- NCES district ID
- 1305550
- Math proficiency
- 35% ▼ -4.00%
- Reading proficiency
- 35% ▼ -3.00%
- Median HH income
- $38,918
- Composite
- 29.3/100
- National rank
- #6554
- State rank
- #68 of 174 in GA
Livability — Jesup
- Score
- 69/100
- State rank
- #112
- US rank
- #8442
Category grades
Schools grade is shown separately in the Schools card above.
Census & demographics
- Census place
- Jesup, GA
- City population
- 1,050
- Population (ZIP)
- 16,057
Population outlook (Wayne County) Hauer SSP2
- Today (2025)
- 28,891 people
- By 2030
- 28,388 · -1.7%
- By 2040
- 27,396 · -5.2%
- By 2050
- 26,135 · -9.5%
- By 2075
- 23,253 · -19.5%
- By 2100
- 19,481 · -32.6%
Race, ethnicity, and origin ACS 2023
- Neighborhood character
- Predominantly White (67%)
- Race & ethnicity
- White 67% Black 20% Hispanic / Latino 7% Two or more races 4% Asian 2%
- Hispanic origin (detail)
- Mexican 5% Puerto Rican 1%
- Common ancestry
- Romanian 2% Lithuanian 1% Italian 1%
- Foreign-born
- 3% · Canada, Philippines
- Languages at home
- 94% English-only · Spanish 4% Other Asian/Pacific 2%
Political lean MEDSL · Wayne
- 2024 margin
- Solid R (+59.8) · D 20.0% · R 79.7%
- 2008→2024 swing
- -14.8pp toward R · 2008: -44.9pp · 2024: -59.8pp
- All cycles
- 2024: R+59.8 2020: R+57.1 2016: R+58.9 2012: R+48.3 2008: R+44.9
Not yet ingested
- Civics
- —
Market trends
- HPI YoY
- ▼ -17.10%
- Current HPI
- 249.3504
- Rent YoY
- —
- Metro
- —
- State GDP YoY
- ▲ 2.66%
- F500 in state
- 28
Industry mix (Fortune 500 HQ in GA)
| Industry | F500 HQs | Revenue |
|---|---|---|
| Paper / Packaging | 2 | $29B |
|
||
| Retail | 1 | $160B |
|
||
| Transportation / Logistics | 1 | $91B |
|
||
| Airlines | 1 | $62B |
|
||
| Consumer Goods | 1 | $47B |
|
||
| Utilities | 1 | $25B |
|
||
Price history
1 event — show timeline
- 2026-05-30 Listed $115,500 HABR
Property tax history
+7.9%/yrLatest (2025): $1,663 · +4.2% YoY. Source: county tax records.
Cash-flow waterfall
monthlySold comps — $/sqft
last 12 mo · ≤1 miLoading sold comps…