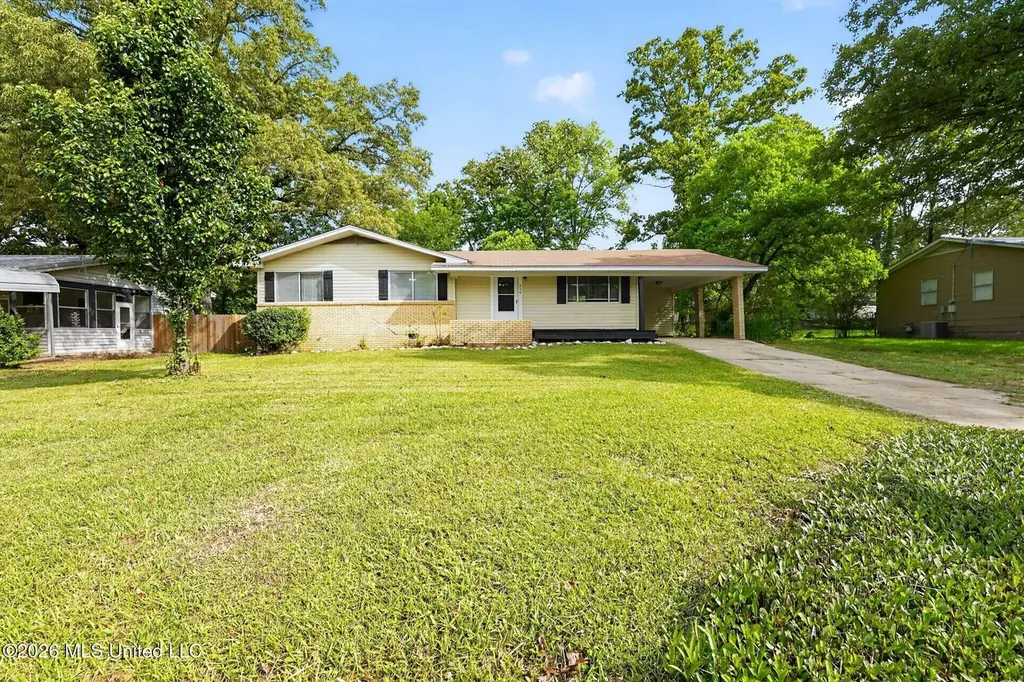
330 Mary Ann Dr · Pearl, MS
Flood risk 1/10 · Minimal
- FEMA flood zone
- X (unshaded)
- Chance of flooding over 30 yrs
- 0.0%
- Est. flood insurance / yr
- $507 – $1,088
Fire risk 2/10 · Minimal
- Est. fire insurance / yr
- $1,241 – $2,305
Heat risk 7/10 · Major
- Hot days now (above 108°F)
- 7 days/yr
- Hot days in 30 yrs
- 20 days/yr
Wind risk 8/10 · Major
- Chance of severe wind over 30 yrs
- 80.0%
Air-quality risk 2/10 · Minimal
- Unhealthy air days now
- 0 days/yr
- Unhealthy air days in 30 yrs
- 1 days/yr
Risk factors via First Street. Map © Google.
Why this score? — see what drove the B- grade
The composite is a weighted blend of 9 inputs, each scored 0–100. Each bar is that input's sub-score; the figure is the points it added to the 100-point composite (weight × sub-score).
- Cash flow +25.6/30.0
- ARV discount +13.3/15.0
- DSCR +8.5/10.0
- 1% rule +6.2/10.0
- Rent growth +4.1/5.0
- Livability +3.7/5.0
- Schools +3.6/10.0
- Condition / age +2.5/5.0
- Appreciation +0.0/10.0
$154,900
🖨 Deal sheet 📄 Offer letter ✓ Due diligence
Listing remarks MLS
Great investor opportunity! Great Pearl location! Call your agent to see today!
Key facts
- 0.24 acre lot
- Parking
- Built 1960
Property features AI
Exterior
- Parking: Carport (1 space, total 1 parking space)
- Utilities: Public water; Public sewer; Electricity available; Natural gas available
- Home design: Single family residence; House; One story
- Construction: Siding construction; Asphalt shingle roof; Built information from assessor
- Exterior features: Chain link fence
Interior
- Kitchen: Kitchen on main level (11x13); Refrigerator
- Bedrooms: Primary bedroom on main level (10x12); Bedroom on main level (10x12); Bedroom on main level (10x12)
- Bathrooms: One full bathroom
- Heating & cooling: Central heating (natural gas); Central air conditioning
- Interior features: Six total rooms; Deck; Front porch
Neighborhood map
What this means for you Summary
Snapshot
- This is a 3-bed/1.0-bath single-family listed at $155k.
Deal economics
- At list price, monthly cash flow is $367 ($4k/yr) — positive.
- The deal already cash-flows at list — no discount required.
- Meets the 1% rule at list price ($2k rent vs $155k).
- Recommended offer: $150k (3.0% below list) — sets the bar for market timing.
- Cap rate 9.1% vs local median 5.5% in Pearl — top-decile yield for the area; either an underpriced asset or a hidden risk that comps aren't pricing in. Stress-test before assuming the spread holds.
Location & tenants
- Location reads 73/100 on livability (#19 in MS) — a middle-class / working-renter tenant base. Strengths: cost of living A+, housing A+, health & safety A+; Watch: amenities F, commute F, employment D-.
- Pearl Public School District (suburban): math 44% / reading 42% proficiency, ranked #32 of 130 in MS (top 25%) — families likely to look elsewhere, expect single-tenant / working-renter base with shorter leases.
- Zoned schools: Pearl Lower Elementary School (782 students, 100% FRL); Pearl Junior High School (math 46% / reading 40%, grade D-, #47 of 179 statewide, top 26%, 1,001 students, 100% FRL); Pearl High School (math 46% / reading 49%, grade D, #28 of 197 statewide, top 14%, 1,262 students, 100% FRL) — zoned schools average 100% FRL vs 57% district-wide (42 pts higher); higher-poverty schools than district average — tighter screening recommended.
- Market conditions: Rents rising fast (+6.3%/yr); 265 active listings in the ZIP; 2 comparable units currently listed for rent nearby; 343 units permitted in Rankin County in 2024 (0 in 5+ unit buildings).
- This rent runs 32% of the median local income ($65k/yr) — at the standard rent-burdened threshold; future hikes will face affordability resistance.
Forward outlook
- Local home prices are declining (-3.0%/yr); year-one equity from $1k of loan paydown is wiped out by about $5k of value loss. Plan a longer hold.
- Rankin County population projected at +17% by 2050 — long-run rental-demand tailwind backs the buy-and-hold thesis.
- At projected returns (-3.0% appreciation + 6.3% rent growth), your $43k cash investment doubles in ~8 years — after that, you're playing with house money.
Negotiation context
- It's been on market 41 days — a 3% lower offer ($150k) is reasonable based on typical stale-listing flexibility.
- 5 sale attempts since 22y ago with the ask held roughly flat each time — persistent listings suggest the price (not the market) is what's stuck; bring a comps-based counter.
Risks & watch-outs
- Climate carrying-cost: severe wind risk, 80% chance of damaging wind over 30y; extreme-heat days projected 7→20/yr by 2055 (HVAC capex compounding) — expect insurance premiums to compound above CPI over the hold.
Questions for the listing agent
- It's been on market 41 days. Have you received any prior offers? Is the seller open to a 3% concession, seller financing, or rate buy-down credit?
- Built in 1960 — when were the roof, HVAC, electrical panel, plumbing, and water heater last replaced?
- Is there a deadline driving the sale (1031 exchange, divorce, estate, relocation)? That informs how much negotiation room exists.
- Schools are D-rated, which usually means shorter tenancies and higher turnover. Who's the typical renter profile here, and what's been the actual vacancy rate?
- What's the average days-on-market for RENTAL listings here right now (not sales)? A rising rental-DOM trend means longer vacancies and softer asking-rent achievability than the comps imply.
- What's the recent tenant-quality profile in this submarket — average credit score on applications, eviction rate, late-payment / NSF rate, and stable-employment percentage? A property-management company in the area should have these aggregated.
- How much new for-sale + rental construction is in the pipeline within 1–3 miles? Heavy new supply typically softens prices + rents 12–24 months out; constrained supply supports both.
Investment metrics
- 1% rule
- 1.12% ✓
- Cap rate
- 9.13%
- Cash-on-cash
- 10.14%
- DSCR
- 1.45
- GRM
- 7.4
CMA / ARV
- ARV (median comp)
- $177,938
- List price
- $154,900
- Delta
- -12.95%
- Verdict
- UNDERPRICED
- Comps
- 20 within 1.0 mi
Show comp detail 12 sales within ~0.75 mi
| Address | Dist | Beds/Ba | Sqft | Sold | Price | $/sf | Match |
|---|---|---|---|---|---|---|---|
| 3217 E Lisa Dr | 0.11mi | 3/1.5 | 1,255 (+2%) | 7mo | $166,900 | $133 | 83 |
| 524 Sardis St | 0.31mi | 3/2.0 | 1,206 (-2%) | 3mo | $212,000 | $176 | 76 |
| 118 Hill Cir | 0.59mi | 3/2.0 | 1,216 (-1%) | 2mo | $179,900 | $148 | 66 |
| 180 Pemberton Dr | 0.22mi | 3/2.0 | 1,367 (+12%) | 3mo | $145,000 | $106 | 64 |
| 3420 Lanell Ln | 0.45mi | 3/2.0 | 1,276 (+4%) | 6mo | $199,900 | $157 | 63 |
| 143 Pemberton Dr | 0.34mi | 3/1.0 | 1,075 (-12%) | 1mo | $150,000 | $140 | 63 |
| 119 Hill Cir | 0.60mi | 3/2.0 | 1,291 (+6%) | 1mo | $205,000 | $159 | 58 |
| 3314 Dawn Dr | 0.47mi | 3/1.5 | 1,080 (-12%) | 1mo | $175,000 | $162 | 56 |
| 3454 Janet St | 0.68mi | 3/1.0 | 1,125 (-8%) | 1mo | $172,500 | $153 | 54 |
| 503 Bruin Ave | 0.50mi | 3/2.0 | 1,400 (+14%) | 1mo | $214,999 | $154 | 48 |
| 3461 Beaumont Dr | 0.67mi | 3/2.0 | 1,339 (+9%) | 7mo | $175,000 | $131 | 43 |
| 356 Saint Paul St | 0.75mi | 3/1.0 | 1,071 (-12%) | 4mo | $164,900 | $154 | 41 |
Match score weights: distance 35% · size 25% · config 20% · recency 20%. Top-matched comps best support the ARV.
Projected returns pro-forma
-3.0% appreciation · 6.34% rent growth · sell at horizon
- IRR
- 2.5%
- Equity multiple
- 1.10×
- Total profit
- $4,273
- Equity at exit
- $23,096
- IRR
- 14.9%
- Equity multiple
- 2.39×
- Total profit
- $60,271
- Equity at exit
- $13,393
Cash invested: $43,372 (down + closing). Projections, not guarantees.
Landlord ↔ Tenant lean methodology
- Overall (STATE)
- 90 Strongly Landlord-Friendly
- State Mississippi
- 90 Strongly Landlord-Friendly · R+11
- County
- — inherits STATE
- City
- — inherits STATE
ZIP-level market 39208
- Home prices YoY
- -20.3%
- Rents YoY
- 6.3%
- Active inventory
- 265
- Price-to-rent
- 7.4×
Monthly cashflow live
- Estimated rent
- $1,738 medium interval (Pro) →
- Mortgage (P&I)
- −$812
- Tax from tax record
- −$130 /mo · $1,559/yr
- Insurance
- −$65
- HOA
- −$0
- Vacancy / Maint / Mgmt
- −$365
- Net cashflow
- $367
Break-even live
UW: 25.0% down · 7.5% · 30yr · 1.5% tax · 5.0% vac · 8.0% maint · 8.0% mgmt
Financing live
Cash to close
- Down payment
- $38,725
- Closing costs
- $4,647
- Reserves months
- —
- Total cash needed
- —
Loan-product check · same deal, 3 products live
Conventional
25% down · 7.5% · 30yr
- Down + closing
- —
- Monthly P&I
- —
- Monthly cashflow
- —
- DSCR
- —
- Eligible?
- —
Personal DTI + credit; lowest rate.
DSCR
20% down · 8.5% · 30yr
- Down + closing
- —
- Monthly P&I
- —
- Monthly cashflow
- —
- DSCR
- —
- Eligible?
- —
No personal income docs; deal must DSCR.
Hard money
10% down · 12.0% · 12mo
- Down + closing
- —
- Monthly P&I
- —
- Monthly cashflow
- —
- DSCR
- —
- Eligible?
- —
Short-term bridge; refi at stabilization.
Rent comps 2 comps
| Address | Beds | Baths | Sqft | Rent | $/sqft | DOM | Units | Dist |
|---|---|---|---|---|---|---|---|---|
| 180 Pemberton Dr Pearl, MS | 3.0 | 2.0 | 1367 | $1,700 | $1.24 | 44d | 1 | 0.20mi |
| 3569 Old Brandon Rd Pearl, MS | 2.0 | 1.0 | 800 | $1,135 | $1.42 | 44d | 1 | 0.88mi |
Listing history 25 events
-
2026-06-18days on market $154,900 Active 41 DOM
-
2026-06-17days on market $154,900 Active 40 DOM
-
2026-06-16days on market $154,900 Active 39 DOM
-
2026-06-15days on market $154,900 Active 38 DOM
-
2026-06-14days on market $154,900 Active 36 DOM
-
2026-06-10days on market $154,900 Active 33 DOM
-
2026-06-09days on market $154,900 Active 32 DOM
-
2026-06-08days on market $154,900 Active 31 DOM
-
2026-06-07days on market $154,900 Active 30 DOM
-
2026-06-03days on market $154,900 Active 26 DOM
-
2026-06-02days on market $154,900 Active 25 DOM
-
2026-06-01days on market $154,900 Active 24 DOM
-
2026-05-31days on market $154,900 Active 23 DOM
-
2026-05-30days on market $154,900 Active 22 DOM
-
2026-05-08$154,900 Active 365-char remark
-
2021-10-01historical
-
2020-09-29soldstatus
-
2020-09-03soldstatus
-
2020-08-27soldstatus
Show marketing remark (79 chars)
Great investor opportunity! Great Pearl location! Call your agent to see today!
-
2020-08-01$80,000
Show marketing remark (79 chars)
Great investor opportunity! Great Pearl location! Call your agent to see today!
-
2009-12-18soldstatus
-
2009-09-14$79,900
-
2005-06-02historical
-
2005-04-13$69,900
-
2004-04-01$74,500
ⓘ Source: listings_history table (triggers on properties + properties_extension) + one-shot
backfill from property_details.listing_events for pre-trigger history.
Tax reassessment forecast MS · Resets to sale price
- Current annual tax
- $1,559 · $130/mo
- Projected year-2 tax
- $1,559 · $130/mo
- Expected delta
- $0/yr ($0/mo · 0.0%)
ⓘ Screening estimate from a state-policy table — verify with the county assessor before closing.
Climate risk First Street
- Flood 1/10 Low FEMA zone X (unshaded) · 0% chance over 30 yrs
- Wildfire 2/10 Low
- Heat 7/10 Severe 7 d/yr ≥108°F today · 20 d/yr by 30 yrs out
- Wind 8/10 Severe 80% chance of damaging wind over 30 yrs
- Air quality 2/10 Low 0 unhealthy d/yr today · 1 by 30 yrs out
Nearby sold comps map
Loading sold comps map…
Walkable amenities ~0.75 mi
Loading nearby amenities…
Taxation est. · year 1
- Rental income
- $20,861
- − Mortgage interest
- −$8,677
- − Property taxes
- −$1,559
- − Insurance
- −$774
- − Repairs & maintenance
- −$1,669
- − Management
- −$1,669
- − Depreciation
- −$4,506
- Taxable income
- $2,007
- Est. tax owed @ 24.0%
- −$482
- After-tax cash flow
- $3,918/yr
For passive investors: Depreciation is non-cash, so a rental often shows a tax loss while cash-flowing — sheltering income. Rental losses are passive: they offset passive income freely, and up to $25,000/yr can offset ordinary (W-2) income if you actively participate and your MAGI is under $100k (phasing out to $0 by $150k); unused losses carry forward. On sale, claimed depreciation is recaptured at up to 25%, and gains may owe capital-gains tax (a 1031 exchange can defer both). Figures are a year-1 estimate at your 24.0% rate — not tax advice; consult a CPA.
Schools (NCES district)
- District
- Pearl Public School District
- NCES district ID
- 2803520
- Math proficiency
- 44% ▼ -9.00%
- Reading proficiency
- 42% ▼ -9.00%
- Median HH income
- $42,525
- Composite
- 36.29/100
- National rank
- #4699
- State rank
- #32 of 130 in MS
Livability — Pearl
- Score
- 73/100
- State rank
- #19
- US rank
- #5662
Category grades
Schools grade is shown separately in the Schools card above.
Census & demographics
- Census place
- Pearl, MS
- County
- Rankin County · 123,614 people
- City population
- 34,442
- Metro
- Jackson, MS
- Population (ZIP)
- 34,442
- Household income
- $65,480
- Rent vs Own
- Severe rent burden
- 1235.0
Population outlook (Rankin County) Hauer SSP2
- Today (2025)
- 164,317 people
- By 2030
- 171,013 · +4.1%
- By 2040
- 182,723 · +11.2%
- By 2050
- 192,376 · +17.1%
- By 2075
- 209,535 · +27.5%
- By 2100
- 209,534 · +27.5%
Race, ethnicity, and origin ACS 2023
- Neighborhood character
- Majority White (60%)
- Race & ethnicity
- White 60% Black 31% Hispanic / Latino 5% Two or more races 3% Asian 2%
- Common ancestry
- Italian 5% Slovak 1% Serbian 1%
- Foreign-born
- 3% · Canada, China
- Languages at home
- 93% English-only · Spanish 4% Other Indo-European 1% Other Asian/Pacific 1%
Political lean MEDSL · Rankin
- 2024 margin
- Solid R (+47.1) · D 25.9% · R 73.0% · Other 1.0%
- 2008→2024 swing
- +6.4pp toward D · 2008: -53.5pp · 2024: -47.1pp
- All cycles
- 2024: R+47.1 2020: R+45.4 2016: R+52.9 2012: R+51.9 2008: R+53.5
Not yet ingested
- Civics
- —
Market trends
- HPI YoY
- ▼ -49.11%
- Current HPI
- 193.0609
- Rent YoY
- ▲ 6.34%
- Metro
- Jackson, MS
- State GDP YoY
- —
- F500 in state
- 0
Price history
+107.9% since first listed11 events — show timeline
- 2026-05-08 Listed $154,900 MLSU
- 2021-10-01 Listing Removed — MLSU
- 2020-09-29 Sold (Public Records) — Public Records
- 2020-09-03 Sold (Public Records) — Public Records
- 2020-08-27 Sold (MLS) — MLSU
- 2020-08-01 Listed $80,000 MLSU
- 2009-12-18 Sold (MLS) — MLSU
- 2009-09-14 Listed $79,900 MLSU
- 2005-06-02 Listing Removed — MLSU
- 2005-04-13 Listed $69,900 MLSU
- 2004-04-01 Listed $74,500 MLSU
Property tax history
+13.2%/yrLatest (2025): $1,559 · +0.0% YoY. Source: county tax records.
Cash-flow waterfall
monthlySold comps — $/sqft
last 12 mo · ≤1 miLoading sold comps…