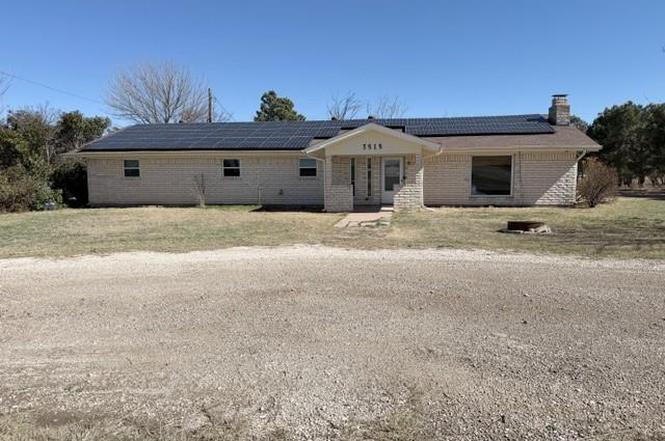
3515 FM 1750 · Abilene, TX
Flood risk 1/10 · Minimal
- FEMA flood zone
- X (unshaded)
- Chance of flooding over 30 yrs
- 0.0%
- Est. flood insurance / yr
- $507 – $1,088
Fire risk 5/10 · Moderate
- Est. fire insurance / yr
- $1,222 – $2,270
Heat risk 7/10 · Major
- Hot days now (above 103°F)
- 7 days/yr
- Hot days in 30 yrs
- 23 days/yr
Wind risk 4/10 · Minor
- Chance of severe wind over 30 yrs
- 17.0%
Air-quality risk 1/10 · Minimal
- Unhealthy air days now
- 0 days/yr
- Unhealthy air days in 30 yrs
- 0 days/yr
Risk factors via First Street. Map © Google.
Why this score? — see what drove the A- grade
The composite is a weighted blend of 9 inputs, each scored 0–100. Each bar is that input's sub-score; the figure is the points it added to the 100-point composite (weight × sub-score).
- Cash flow +30.0/30.0
- ARV discount +14.6/15.0
- DSCR +10.0/10.0
- 1% rule +9.2/10.0
- Schools +5.6/10.0
- Rent growth +5.0/5.0
- Livability +3.8/5.0
- Condition / age +2.5/5.0
- Appreciation +0.0/10.0
$218,500
🖨 Deal sheet 📄 Offer letter ✓ Due diligence
Listing remarks
GREAT OPPORTUNITY TO OWN A HOME WITH SO MUCH POTENTIAL. THIS HOME HAS 3 BEDROOMS BUT COULD BE MORE AND 2 FULL BATHS, A ENCLOSED SUNROOM, 3 CAR GARAGE, STORAGE AND IS IN THE WYLIE EAST SCHOOL DISTRICT. PROPERTY SOLD AS IS, NO SURVEY, NO HOME WARRANTY.
Key facts
- 0.75 acre lot
- 3 garage spots
- Built 1978
Property features AI
Finance
- Other: Property type: Residential, Single Family Residence; Parcel number 16645; Subdivision: W; County: Taylor, United States
- Financial info: Listing accepts Cash and Conventional financing; Special listing condition: Real Estate Owned
- HOA & community: No association
Exterior
- Parking: Attached 3-car garage; 3 covered parking spaces; Garage faces side
- Utilities: No municipal utility district; Utilities listed as none
- Home design: Single-family residence; One-story
- Construction: Brick construction; Built in 1978
- Exterior features: Approximately 0.75-acre lot; Directions: LOOP 322 to FM 1750 South
Interior
- Kitchen: Dishwasher; Electric cooktop; Electric oven; Microwave; Refrigerator
- Bedrooms: 3 bedrooms (primary bedroom on main level, approx. 13 x 18)
- Bathrooms: 2 full bathrooms
- Heating & cooling: Other heating
- Interior features: Open living areas (2 living areas); Separate dining area
Neighborhood map
What this means for you Summary
Snapshot
- This is a 4-bed/1.0-bath single-family listed at $218k.
Deal economics
- At list price, monthly cash flow is $1k ($14k/yr) — positive.
- The deal already cash-flows at list — no discount required.
- Meets the 1% rule at list price ($3k rent vs $218k).
- Recommended offer: $205k (6.0% below list) — sets the bar for market timing.
- Cap rate 12.6% vs local median 6.7% in Abilene — top-decile yield for the area; either an underpriced asset or a hidden risk that comps aren't pricing in. Stress-test before assuming the spread holds.
Location & tenants
- Location reads 75/100 on livability (#142 in TX, #4,037 nationally) — a middle-class / working-renter tenant base. Strengths: cost of living A+, housing A+, health & safety A+; Watch: crime D, commute F.
- Wylie ISD (rural): math 63% / reading 62% proficiency, ranked #32 of 826 in TX (top 4%) — acceptable for families but not a draw, mixed tenant base, ~2y average lease; only 17% free/reduced lunch — higher-income household profile.
- Zoned schools: Wylie East El (math 58% / reading 58%, grade C+, #480 of 4,322 statewide, top 11%, 789 students, 30% FRL).
- Market conditions: Rents rising fast (+33.5%/yr); 370 active listings in the ZIP; 16 comparable units currently listed for rent nearby; rentals leasing fast (median 14d on market — plan ~1-2 weeks tenant-placement turnaround); solid renter incomes; 508 units permitted in Taylor County in 2024 (0 in 5+ unit buildings).
- This rent runs 42% of the median local income ($90k/yr) — at the standard rent-burdened threshold; future hikes will face affordability resistance.
Forward outlook
- Local home prices are declining (-3.0%/yr); year-one equity from $2k of loan paydown is wiped out by about $7k of value loss. Plan a longer hold.
- Taylor County population projected at +16% by 2050 — long-run rental-demand tailwind backs the buy-and-hold thesis.
- At projected returns (-3.0% appreciation + 8.0% rent growth), your $61k cash investment doubles in ~5 years — after that, you're playing with house money.
Negotiation context
- It's been on market 87 days — a 6% lower offer ($205k) is reasonable based on typical stale-listing flexibility.
Risks & watch-outs
- Climate carrying-cost: moderate wildfire risk; extreme-heat days projected 7→23/yr by 2055 (HVAC capex compounding) — expect insurance premiums to compound above CPI over the hold.
Questions for the listing agent
- It's been on market 87 days. Have you received any prior offers? Is the seller open to a 6% concession, seller financing, or rate buy-down credit?
- Built in 1978 — when were the roof, HVAC, electrical panel, plumbing, and water heater last replaced?
- Why hasn't it sold? Are there any deal-killer items the seller is aware of (foundation, flood, title, zoning, code violations)?
- Is there a deadline driving the sale (1031 exchange, divorce, estate, relocation)? That informs how much negotiation room exists.
- Schools are D-rated, which usually means shorter tenancies and higher turnover. Who's the typical renter profile here, and what's been the actual vacancy rate?
- Crime grade is D in this area — have there been break-ins, vandalism, or insurance claims at this property in the last 3 years? What carrier currently insures it and at what premium?
- What's the average days-on-market for RENTAL listings here right now (not sales)? A rising rental-DOM trend means longer vacancies and softer asking-rent achievability than the comps imply.
- What's the recent tenant-quality profile in this submarket — average credit score on applications, eviction rate, late-payment / NSF rate, and stable-employment percentage? A property-management company in the area should have these aggregated.
- How much new for-sale + rental construction is in the pipeline within 1–3 miles? Heavy new supply typically softens prices + rents 12–24 months out; constrained supply supports both.
Investment metrics
- 1% rule
- 1.42% ✓
- Cap rate
- 12.61%
- Cash-on-cash
- 22.57%
- DSCR
- 2.00
- GRM
- 5.9
CMA / ARV
- ARV (on-the-fly)
- $259,714
- Comps found
- 12
Show comp detail 12 sales within ~0.75 mi
| Address | Dist | Beds/Ba | Sqft | Sold | Price | $/sf | Match |
|---|---|---|---|---|---|---|---|
| 950 Swift Water Dr | 0.61mi | 3/2.0 (-1) | 1,415 (-1%) | 1mo | $287,500 | $203 | 60 |
| 4725 Many Waters Dr | 0.56mi | 3/2.0 (-1) | 1,461 (+2%) | 3mo | $289,000 | $198 | 58 |
| 817 Swift Water Dr | 0.61mi | 3/2.0 (-1) | 1,496 (+5%) | 0mo | $289,000 | $193 | 54 |
| 818 Running Water Trl | 0.48mi | 4/2.0 | 1,581 (+11%) | 7mo | $275,000 | $174 | 50 |
| 334 Lollipop Trl | 0.73mi | 3/2.0 (-1) | 1,456 (+2%) | 6mo | $265,000 | $182 | 49 |
| 818 Great Waters Dr | 0.40mi | 3/2.0 (-1) | 1,631 (+14%) | 1mo | $307,000 | $188 | 48 |
| 4910 Coyote Run | 0.57mi | 3/2.0 (-1) | 1,552 (+9%) | 5mo | $268,000 | $173 | 46 |
| 349 Lollipop Trl | 0.71mi | 4/2.0 | 1,569 (+10%) | 1mo | $285,000 | $182 | 45 |
| 5141 Yellowstone Trl | 0.51mi | 3/2.0 (-1) | 1,600 (+12%) | 4mo | $299,900 | $187 | 44 |
| 5125 Spring Creek Rd | 0.48mi | 3/2.0 (-1) | 1,604 (+12%) | 7mo | $289,900 | $181 | 42 |
| 365 Lollipop Trl | 0.69mi | 3/2.0 (-1) | 1,595 (+12%) | 4mo | $280,000 | $176 | 36 |
| 841 Swift Water Dr | 0.60mi | 3/2.0 (-1) | 1,618 (+13%) | 6mo | $279,000 | $172 | 36 |
Match score weights: distance 35% · size 25% · config 20% · recency 20%. Top-matched comps best support the ARV.
Projected returns pro-forma
-3.0% appreciation · 8.0% rent growth · sell at horizon
- IRR
- 20.5%
- Equity multiple
- 1.89×
- Total profit
- $54,204
- Equity at exit
- $32,579
- IRR
- 31.7%
- Equity multiple
- 4.53×
- Total profit
- $215,868
- Equity at exit
- $18,892
Cash invested: $61,180 (down + closing). Projections, not guarantees.
Landlord ↔ Tenant lean methodology
- Overall (STATE)
- 87 Strongly Landlord-Friendly
- State Texas
- 87 Strongly Landlord-Friendly · R+5
- County
- — inherits STATE
- City
- — inherits STATE
ZIP-level market 79602
- Home prices YoY
- -19.6%
- Rents YoY
- 33.5%
- Active inventory
- 370
- Price-to-rent
- 5.9×
Monthly cashflow live
- Estimated rent
- $3,102 high interval (Pro) →
- Mortgage (P&I)
- −$1,146
- Tax from tax record
- −$63 /mo · $757/yr
- Insurance
- −$91
- HOA
- −$0
- Vacancy / Maint / Mgmt
- −$651
- Net cashflow
- $1,151
Break-even live
UW: 25.0% down · 7.5% · 30yr · 1.5% tax · 5.0% vac · 8.0% maint · 8.0% mgmt
Financing live
Cash to close
- Down payment
- $54,625
- Closing costs
- $6,555
- Reserves months
- —
- Total cash needed
- —
Loan-product check · same deal, 3 products live
Conventional
25% down · 7.5% · 30yr
- Down + closing
- —
- Monthly P&I
- —
- Monthly cashflow
- —
- DSCR
- —
- Eligible?
- —
Personal DTI + credit; lowest rate.
DSCR
20% down · 8.5% · 30yr
- Down + closing
- —
- Monthly P&I
- —
- Monthly cashflow
- —
- DSCR
- —
- Eligible?
- —
No personal income docs; deal must DSCR.
Hard money
10% down · 12.0% · 12mo
- Down + closing
- —
- Monthly P&I
- —
- Monthly cashflow
- —
- DSCR
- —
- Eligible?
- —
Short-term bridge; refi at stabilization.
Rent comps 16 comps
| Address | Beds | Baths | Sqft | Rent | $/sqft | DOM | Units | Dist |
|---|---|---|---|---|---|---|---|---|
| 801 Big Water Trl Abilene, TX | 3.0 | 2.0 | 1537 | $2,800 | $1.82 | 13d | 1 | 0.49mi |
| 350 Miss Ellie Ln Abilene, TX | 3.0 | 2.0 | 1414 | $2,600 | $1.84 | 7d | 1 | 0.71mi |
| 350 Miss Ellie Ln Abilene, TX | 3.0 | 2.0 | 1414 | $2,600 | $1.84 | 3d | 1 | 0.71mi |
| 349 Whiterock Dr Abilene, TX | 4.0 | 2.0 | 1809 | $6,000 | $3.32 | 18d | 1 | 0.87mi |
| 7309 Wildflower Way Abilene, TX | 3.0 | 2.0 | 1578 | $3,195 | $2.02 | 24d | 1 | 1.03mi |
| 1341 Briar Cliff Path Abilene, TX | 4.0 | 2.0 | 1712 | $3,100 | $1.81 | 13d | 1 | 1.05mi |
| 331 Sophia Ln Abilene, TX | 3.0 | 2.0 | 1632 | $3,195 | $1.96 | 4d | 1 | 1.11mi |
| 1342 Lewis and Clark Trl Abilene, TX | 3.0 | 2.0 | 1572 | $6,900 | $4.39 | 13d | 1 | 1.12mi |
| 273 Martis Way Abilene, TX | 4.0 | 2.0 | 1660 | $3,200 | $1.93 | 13d | 1 | 1.20mi |
| 7319 Mountain View Rd Abilene, TX | 3.0 | 2.0 | 1502 | $4,000 | $2.66 | 44d | 1 | 1.22mi |
| 3933 Wake Forest Ln Abilene, TX | 3.0 | 2.0 | 1320 | $2,495 | $1.89 | 22d | 1 | 1.25mi |
| 3933 Wake Forest Ln Abilene, TX | 3.0 | 2.0 | 1320 | $2,495 | $1.89 | 21d | 1 | 1.25mi |
| 7326 Mountain View Rd Unit 7328 Abilene, TX | 3.0 | 2.0 | 1481 | $2,995 | $2.02 | 12d | 1 | 1.26mi |
| 7328 Mountain View Rd Abilene, TX | 3.0 | 2.0 | 1481 | $2,995 | $2.02 | 12d | 1 | 1.26mi |
| 3926 Duke Ln Abilene, TX | 3.0 | 2.0 | 1612 | $2,250 | $1.40 | 7d | 1 | 1.28mi |
| 3873 Purdue Ln Abilene, TX | 3.0 | 1.0 | 1027 | $2,100 | $2.04 | 13d | 1 | 1.34mi |
Listing history 15 events
-
2026-06-15statusdays on market $218,500 Pending 87 DOM
-
2026-06-14days on market $218,500 Active Option Contract 86 DOM
-
2026-06-13days on market $218,500 Active Option Contract 85 DOM
-
2026-06-10days on market $218,500 Active Option Contract 83 DOM
-
2026-06-09days on market $218,500 Active Option Contract 82 DOM
-
2026-06-08days on market $218,500 Active Option Contract 81 DOM
-
2026-06-07days on market $218,500 Active Option Contract 80 DOM
-
2026-06-05days on market $218,500 Active Option Contract 77 DOM
-
2026-06-02days on market $218,500 Active Option Contract 75 DOM
-
2026-06-01days on market $218,500 Active Option Contract 74 DOM
-
2026-05-31days on market $218,500 Active Option Contract 73 DOM
-
2026-05-30days on market $218,500 Active Option Contract 72 DOM
-
2026-04-21price $218,500
-
2026-03-18$230,000 Active
-
2024-03-18soldstatus
ⓘ Source: listings_history table (triggers on properties + properties_extension) + one-shot
backfill from property_details.listing_events for pre-trigger history.
Tax reassessment forecast TX · Resets to sale price
- Current annual tax
- $757 · $63/mo
- Projected year-2 tax
- $3,999 · $333/mo
- Expected delta
- +$3,242/yr (+$270/mo · 428.5%)
ⓘ Screening estimate from a state-policy table — verify with the county assessor before closing.
Climate risk First Street
- Flood 1/10 Low FEMA zone X (unshaded) · 0% chance over 30 yrs
- Wildfire 5/10 Major
- Heat 7/10 Severe 7 d/yr ≥103°F today · 23 d/yr by 30 yrs out
- Wind 4/10 Moderate 17% chance of damaging wind over 30 yrs
- Air quality 1/10 Low 0 unhealthy d/yr today · 0 by 30 yrs out
Nearby sold comps map
Loading sold comps map…
Walkable amenities ~0.75 mi
Loading nearby amenities…
Taxation est. · year 1
- Rental income
- $37,227
- − Mortgage interest
- −$12,239
- − Property taxes
- −$757
- − Insurance
- −$1,092
- − Repairs & maintenance
- −$2,978
- − Management
- −$2,978
- − Depreciation
- −$6,356
- Taxable income
- $10,826
- Est. tax owed @ 24.0%
- −$2,598
- After-tax cash flow
- $11,212/yr
For passive investors: Depreciation is non-cash, so a rental often shows a tax loss while cash-flowing — sheltering income. Rental losses are passive: they offset passive income freely, and up to $25,000/yr can offset ordinary (W-2) income if you actively participate and your MAGI is under $100k (phasing out to $0 by $150k); unused losses carry forward. On sale, claimed depreciation is recaptured at up to 25%, and gains may owe capital-gains tax (a 1031 exchange can defer both). Figures are a year-1 estimate at your 24.0% rate — not tax advice; consult a CPA.
Schools (NCES district)
- District
- Wylie ISD
- NCES district ID
- 4846500
- Math proficiency
- 63% ▼ -12.00%
- Reading proficiency
- 62% ▼ -4.00%
- Median HH income
- $78,248
- Composite
- 55.86/100
- National rank
- #1206
- State rank
- #32 of 826 in TX
Livability — Abilene
- Score
- 75/100
- State rank
- #142
- US rank
- #4037
Category grades
Schools grade is shown separately in the Schools card above.
Census & demographics
- Census place
- Abilene, TX
- County
- Taylor County · 136,672 people
- City population
- 136,672
- Metro
- Abilene, TX
- Population (ZIP)
- 27,425
- Household income
- $89,551
- Rent vs Own
- Severe rent burden
- 338.0
Population outlook (Taylor County) Hauer SSP2
- Today (2025)
- 145,270 people
- By 2030
- 150,050 · +3.3%
- By 2040
- 159,417 · +9.7%
- By 2050
- 168,883 · +16.3%
- By 2075
- 194,436 · +33.8%
- By 2100
- 203,163 · +39.9%
Race, ethnicity, and origin ACS 2023
- Neighborhood character
- Majority White (64%)
- Race & ethnicity
- White 64% Hispanic / Latino 22% Two or more races 12% Black 10% Asian 2%
- Hispanic origin (detail)
- Mexican 19%
- Common ancestry
- Romanian 2% Italian 2% Portuguese 2%
- Foreign-born
- 6% · Canada, Vietnam, Jamaica
- Languages at home
- 87% English-only · Spanish 9% Other Asian/Pacific 1% French/Haitian/Cajun 1%
Political lean MEDSL · Taylor
- 2024 margin
- Solid R (+49.8) · D 24.6% · R 74.4% · Other 1.0%
- 2008→2024 swing
- -4.2pp toward R · 2008: -45.6pp · 2024: -49.8pp
- All cycles
- 2024: R+49.8 2020: R+45.3 2016: R+51.1 2012: R+53.6 2008: R+45.6
Not yet ingested
- Civics
- —
Market trends
- HPI YoY
- ▼ -46.04%
- Current HPI
- 189.3098
- Rent YoY
- ▲ 33.46%
- Metro
- Abilene, TX
- State GDP YoY
- ▲ 3.95%
- F500 in state
- 110
Industry mix (Fortune 500 HQ in TX)
| Industry | F500 HQs | Revenue |
|---|---|---|
| Energy | 16 | $1,198B |
|
||
| Technology | 5 | $198B |
|
||
| Engineering / Construction | 4 | $72B |
|
||
| Energy Services | 3 | $60B |
|
||
| Utilities | 3 | $41B |
|
||
| Healthcare | 2 | $330B |
|
||
Price history
-5.0% since first listed3 events — show timeline
- 2026-04-21 Price Changed $218,500 NTREIS
- 2026-03-18 Listed $230,000 NTREIS
- 2024-03-18 Sold (Public Records) — Public Records
Property tax history
+2.7%/yrLatest (2025): $757 · -38.0% YoY. Source: county tax records.
Cash-flow waterfall
monthlySold comps — $/sqft
last 12 mo · ≤1 miLoading sold comps…