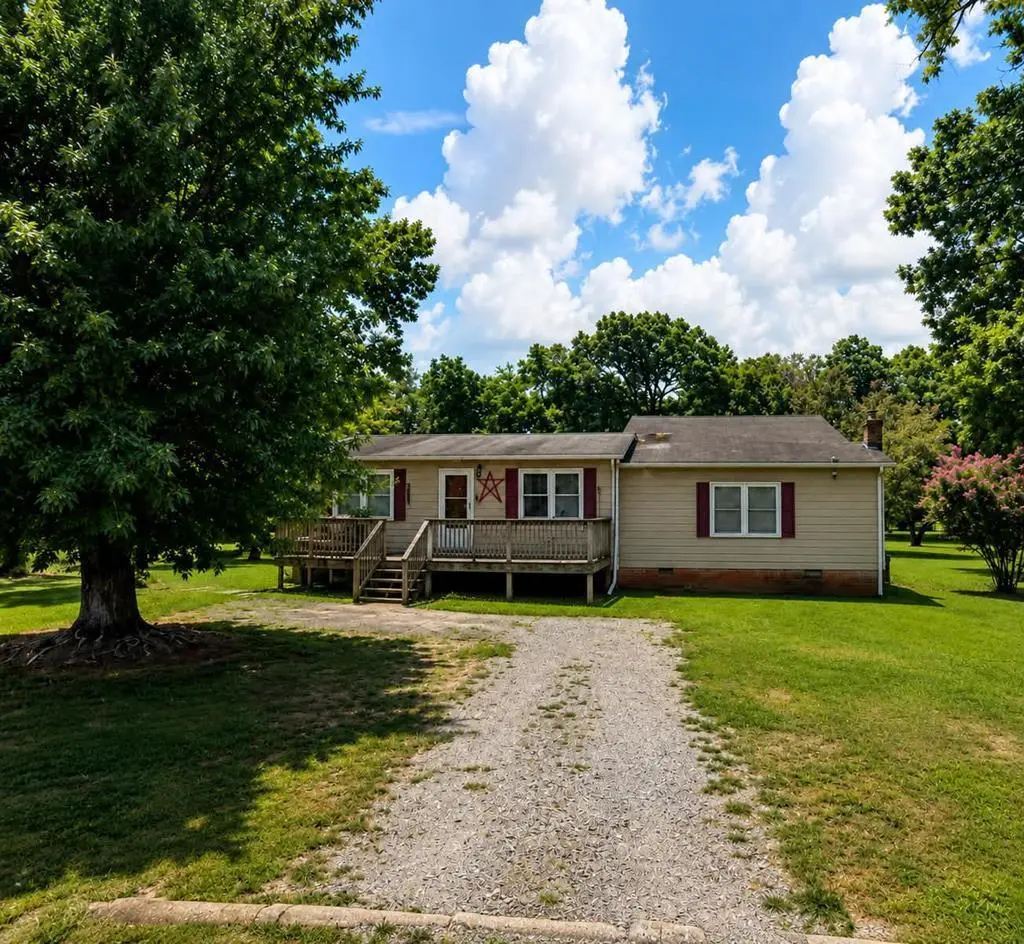
95 Jonbil Rd · Fairview, VA
Flood risk 1/10 · Minimal
- FEMA flood zone
- X (unshaded)
- Chance of flooding over 30 yrs
- 0.0%
- Est. flood insurance / yr
- $507 – $1,088
Fire risk 4/10 · Minor
- Est. fire insurance / yr
- $666 – $1,236
Heat risk 6/10 · Moderate
- Hot days now (above 105°F)
- 7 days/yr
- Hot days in 30 yrs
- 17 days/yr
Wind risk 5/10 · Moderate
- Chance of severe wind over 30 yrs
- 22.0%
Air-quality risk 1/10 · Minimal
- Unhealthy air days now
- 0 days/yr
- Unhealthy air days in 30 yrs
- 0 days/yr
Risk factors via First Street. Map © Google.
Why this score? — see what drove the B+ grade
The composite is a weighted blend of 9 inputs, each scored 0–100. Each bar is that input's sub-score; the figure is the points it added to the 100-point composite (weight × sub-score).
- Cash flow +27.7/30.0
- ARV discount +15.0/15.0
- DSCR +9.7/10.0
- 1% rule +6.3/10.0
- Appreciation +6.0/10.0
- Schools +5.4/10.0
- Rent growth +2.5/5.0
- Condition / age +2.5/5.0
- Livability +1.8/5.0
$160,000
🖨 Deal sheet 📄 Offer letter ✓ Due diligence
Listing remarks
Located on a quiet private setting, this spacious home offers incredible potential for the right buyer! Featuring over 2,100 square feet, this property has great bones and plenty of space to make your own with a little TLC. Inside, you'll find 3 bedrooms, 2 full bathrooms, a bonus room, two separate living areas, and a nice-sized kitchen with plenty of room for gathering and entertaining. The attached 2-car garage adds convenience and extra storage space. There is also an additonal storage shed out back and ample space for parking. Outside, enjoy a nice yard with privacy and room to spread out. The decks could use some attention, but the outdoor space has tons of potential for relaxing or e
Key facts
- Garage
- Built 1975
- Listed 29 days
Property features AI
Finance
- Other: Zoning: R2
Exterior
- Parking: 2 total parking spaces; 2 covered spaces; Attached garage; Carport; Open parking; Gravel driveway/parking
- Utilities: Public water; Public sewer; Cable available and connected
- Home design: Single-family residence (modular on frame); One and one-half stories
- Construction: Aluminum siding; Asbestos shingle roof; Crawl space basement
- Exterior features: Deck; Porch; Storage; Workshop; Has view
Interior
- Kitchen: Range; Oven; Refrigerator; Electric water heater
- Flooring: Hardwood; Laminate; Vinyl
- Bathrooms: 2 full bathrooms
- Heating & cooling: Heat pump; Central air; Ceiling fans
- Interior features: Ceiling fans; High-speed internet; Fireplace (1)
- Laundry & utility: Washer hookup; Electric dryer hookup
Neighborhood map
What this means for you Summary
Snapshot
- This is a 3-bed/2.0-bath single-family listed at $160k.
Deal economics
- At list price, monthly cash flow is $481 ($6k/yr) — positive.
- The deal already cash-flows at list — no discount required.
- Meets the 1% rule at list price ($2k rent vs $160k).
- Recommended offer: $158k (1.5% below list) — sets the bar for market timing.
Location & tenants
- Location reads 36/100 on livability (#589 in VA) — a limited-amenity area; tenant pool skews transient or value-seeking. Strengths: cost of living A+, crime A; Watch: health & safety C-, amenities F, commute F.
- Mecklenburg County Public School District (rural): math 57% / reading 72% proficiency, ranked #49 of 131 in VA (top 37%) — acceptable for families but not a draw, mixed tenant base, ~2y average lease.
- Zoned schools: Chase City Elementary (math 47% / reading 57%, grade C-, #696 of 1,108 statewide, top 66%, 387 students, 89% FRL); Mecklenburg County Middle (874 students, 88% FRL); Mecklenburg County High (1,163 students, 88% FRL) — zoned schools average 88% FRL vs 54% district-wide (35 pts higher); higher-poverty schools than district average — tighter screening recommended.
- Zoned-school proficiency averages 52% at this address vs 64% district-wide (-12 pts) — the specific schools serving this property underperform the Mecklenburg County Public School District average; the district grade overstates school quality for this exact location.
- Market conditions: 41 active listings in the ZIP; 153 units permitted in Mecklenburg County in 2024 (0 in 5+ unit buildings).
Forward outlook
- In year one you build about $4k of equity ($1k loan paydown + $3k appreciation (2.0% local appreciation)).
- Mecklenburg County population projected at -26% by 2050 — secular population decline; favor cash flow + early exit over multi-decade hold.
- At projected returns (2.0% appreciation + 3.0% rent growth), your $45k cash investment doubles in ~5 years — after that, you're playing with house money.
- By year 8, paydown + projected appreciation supports a ~$33k cash-out refi (75% LTV) — recoverable capital for the next deal without selling this one.
Negotiation context
- It's been on market 29 days — a 2% lower offer ($158k) is reasonable based on typical stale-listing flexibility.
Risks & watch-outs
- Climate carrying-cost: moderate wind risk, 22% chance of damaging wind over 30y; extreme-heat days projected 7→17/yr by 2055 (HVAC capex compounding) — expect insurance premiums to compound above CPI over the hold.
Questions for the listing agent
- Built in 1975 — when were the roof, HVAC, electrical panel, plumbing, and water heater last replaced?
- Is there a deadline driving the sale (1031 exchange, divorce, estate, relocation)? That informs how much negotiation room exists.
- Schools are F-rated, which usually means shorter tenancies and higher turnover. Who's the typical renter profile here, and what's been the actual vacancy rate?
- What's the average days-on-market for RENTAL listings here right now (not sales)? A rising rental-DOM trend means longer vacancies and softer asking-rent achievability than the comps imply.
- What's the recent tenant-quality profile in this submarket — average credit score on applications, eviction rate, late-payment / NSF rate, and stable-employment percentage? A property-management company in the area should have these aggregated.
- How much new for-sale + rental construction is in the pipeline within 1–3 miles? Heavy new supply typically softens prices + rents 12–24 months out; constrained supply supports both.
Investment metrics
- 1% rule
- 1.13% ✓
- Cap rate
- 9.90%
- Cash-on-cash
- 12.89%
- DSCR
- 1.57
- GRM
- 7.4
CMA / ARV
- ARV (on-the-fly)
- $255,068
- Comps found
- 1
Show comp detail 1 sale within ~0.75 mi
| Address | Dist | Beds/Ba | Sqft | Sold | Price | $/sf | Match |
|---|---|---|---|---|---|---|---|
| 953 N Main St | 0.74mi | 4/2.0 (+1) | 1,854 (-12%) | 10mo | $225,000 | $121 | 32 |
Match score weights: distance 35% · size 25% · config 20% · recency 20%. Top-matched comps best support the ARV.
Projected returns pro-forma
2.04% appreciation · 3.0% rent growth · sell at horizon
- IRR
- 17.3%
- Equity multiple
- 1.93×
- Total profit
- $41,878
- Equity at exit
- $63,451
- IRR
- 19.5%
- Equity multiple
- 3.60×
- Total profit
- $116,383
- Equity at exit
- $91,634
Cash invested: $44,800 (down + closing). Projections, not guarantees.
Landlord ↔ Tenant lean methodology
- Overall (STATE)
- 55 Moderately Landlord-Leaning
- State Virginia
- 55 Moderately Landlord-Leaning · D+2
- County
- — inherits STATE
- City
- — inherits STATE
ZIP-level market 23924
- Home prices YoY
- 1.3%
- Active inventory
- 41
- Price-to-rent
- 7.4×
Monthly cashflow live
- Estimated rent
- $1,811 medium interval (Pro) →
- Mortgage (P&I)
- −$839
- Tax from tax record
- −$44 /mo · $523/yr
- Insurance
- −$67
- HOA
- −$0
- Vacancy / Maint / Mgmt
- −$380
- Net cashflow
- $481
Break-even live
UW: 25.0% down · 7.5% · 30yr · 1.5% tax · 5.0% vac · 8.0% maint · 8.0% mgmt
Financing live
Cash to close
- Down payment
- $40,000
- Closing costs
- $4,800
- Reserves months
- —
- Total cash needed
- —
Loan-product check · same deal, 3 products live
Conventional
25% down · 7.5% · 30yr
- Down + closing
- —
- Monthly P&I
- —
- Monthly cashflow
- —
- DSCR
- —
- Eligible?
- —
Personal DTI + credit; lowest rate.
DSCR
20% down · 8.5% · 30yr
- Down + closing
- —
- Monthly P&I
- —
- Monthly cashflow
- —
- DSCR
- —
- Eligible?
- —
No personal income docs; deal must DSCR.
Hard money
10% down · 12.0% · 12mo
- Down + closing
- —
- Monthly P&I
- —
- Monthly cashflow
- —
- DSCR
- —
- Eligible?
- —
Short-term bridge; refi at stabilization.
Listing history 17 events
-
2026-06-18days on market $160,000 Active 29 DOM
-
2026-06-17days on market $160,000 Active 28 DOM
-
2026-06-16days on market $160,000 Active 27 DOM
-
2026-06-15days on market $160,000 Active 26 DOM
-
2026-06-14days on market $160,000 Active 24 DOM
-
2026-06-13days on market $160,000 Active 23 DOM
-
2026-06-10days on market $160,000 Active 21 DOM
-
2026-06-09days on market $160,000 Active 20 DOM
-
2026-06-08days on market $160,000 Active 19 DOM
-
2026-06-07days on market $160,000 Active 18 DOM
-
2026-06-05pricedays on market $160,000 Active 15 DOM
-
2026-06-03days on market $165,000 Active 14 DOM
-
2026-06-02days on market $165,000 Active 13 DOM
-
2026-06-01days on market $165,000 Active 12 DOM
-
2026-05-31days on market $165,000 Active 11 DOM
-
2026-05-31days on market $165,000 Active 10 DOM
-
2026-05-21$165,000 Active
ⓘ Source: listings_history table (triggers on properties + properties_extension) + one-shot
backfill from property_details.listing_events for pre-trigger history.
Tax reassessment forecast VA · Resets to sale price
- Current annual tax
- $523 · $44/mo
- Projected year-2 tax
- $1,312 · $109/mo
- Expected delta
- +$789/yr (+$66/mo · 151.0%)
ⓘ Screening estimate from a state-policy table — verify with the county assessor before closing.
Climate risk First Street
- Flood 1/10 Low FEMA zone X (unshaded) · 0% chance over 30 yrs
- Wildfire 4/10 Moderate
- Heat 6/10 Major 7 d/yr ≥105°F today · 17 d/yr by 30 yrs out
- Wind 5/10 Major 22% chance of damaging wind over 30 yrs
- Air quality 1/10 Low 0 unhealthy d/yr today · 0 by 30 yrs out
Nearby sold comps map
Loading sold comps map…
Walkable amenities ~0.75 mi
Loading nearby amenities…
Taxation est. · year 1
- Rental income
- $21,731
- − Mortgage interest
- −$8,962
- − Property taxes
- −$523
- − Insurance
- −$800
- − Repairs & maintenance
- −$1,738
- − Management
- −$1,738
- − Depreciation
- −$4,655
- Taxable income
- $3,314
- Est. tax owed @ 24.0%
- −$795
- After-tax cash flow
- $4,980/yr
For passive investors: Depreciation is non-cash, so a rental often shows a tax loss while cash-flowing — sheltering income. Rental losses are passive: they offset passive income freely, and up to $25,000/yr can offset ordinary (W-2) income if you actively participate and your MAGI is under $100k (phasing out to $0 by $150k); unused losses carry forward. On sale, claimed depreciation is recaptured at up to 25%, and gains may owe capital-gains tax (a 1031 exchange can defer both). Figures are a year-1 estimate at your 24.0% rate — not tax advice; consult a CPA.
Schools (NCES district)
- District
- Mecklenburg County Public School District
- NCES district ID
- 5102460
- Math proficiency
- 57% ▼ -29.00%
- Reading proficiency
- 72% ▼ -7.00%
- Median HH income
- $37,491
- Composite
- 53.55/100
- National rank
- #1446
- State rank
- #49 of 131 in VA
Livability — Fairview
- Score
- 36/100
- State rank
- #589
- US rank
- #27648
Category grades
Schools grade is shown separately in the Schools card above.
Census & demographics
- Census place
- Fairview, VA
- Population (ZIP)
- 5,709
Population outlook (Mecklenburg County) Hauer SSP2
- Today (2025)
- 28,332 people
- By 2030
- 26,742 · -5.6%
- By 2040
- 23,502 · -17.0%
- By 2050
- 20,851 · -26.4%
- By 2075
- 17,525 · -38.1%
- By 2100
- 14,524 · -48.7%
Race, ethnicity, and origin ACS 2023
- Neighborhood character
- Majority White (60%)
- Race & ethnicity
- White 60% Black 36% Hispanic / Latino 3% Two or more races 1%
- Common ancestry
- Slovak 3% Italian 1%
- Foreign-born
- 2% · Canada
- Languages at home
- 98% English-only · Spanish 2%
Political lean MEDSL · Mecklenburg
- 2024 margin
- Strong R (+20.8) · D 39.4% · R 60.2%
- 2008→2024 swing
- -16.2pp toward R · 2008: -4.6pp · 2024: -20.8pp
- All cycles
- 2024: R+20.8 2020: R+15.2 2016: R+11.3 2012: R+7.2 2008: R+4.6
Not yet ingested
- Civics
- —
Market trends
- HPI YoY
- ▲ 2.04%
- Current HPI
- 155.5959
- Rent YoY
- —
- Metro
- —
- State GDP YoY
- ▲ 2.40%
- F500 in state
- 50
Industry mix (Fortune 500 HQ in VA)
| Industry | F500 HQs | Revenue |
|---|---|---|
| Aerospace / Defense | 4 | $236B |
|
||
| Technology / Defense | 3 | $32B |
|
||
| Financial Services | 2 | $176B |
|
||
| Utilities | 2 | $27B |
|
||
| Insurance | 2 | $25B |
|
||
| Technology | 2 | $15B |
|
||
Price history
1 event — show timeline
- 2026-05-21 Listed $165,000 SPLLAR
Property tax history
+2.8%/yrLatest (2025): $523 · +0.0% YoY. Source: county tax records.
Cash-flow waterfall
monthlySold comps — $/sqft
last 12 mo · ≤1 miLoading sold comps…