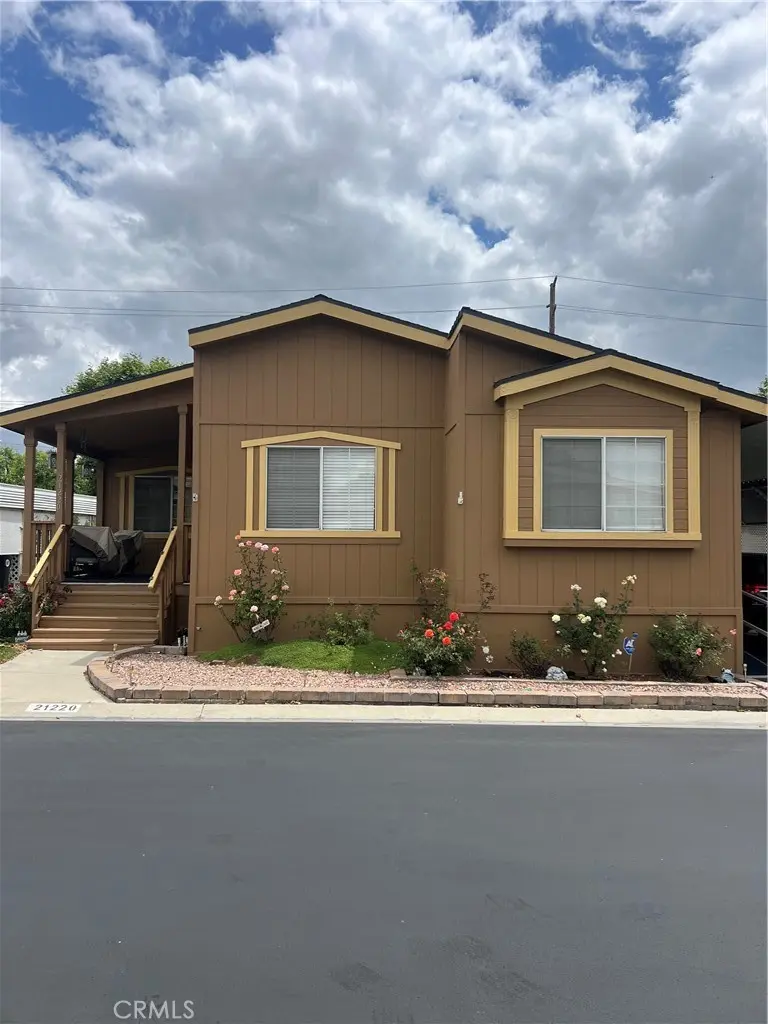
21220 willow weed Way · Santa Clarita, CA
Flood risk 1/10 · Minimal
- FEMA flood zone
- X (shaded)
- Chance of flooding over 30 yrs
- 0.0%
- Est. flood insurance / yr
- $507 – $1,088
Fire risk 8/10 · Major
- Est. fire insurance / yr
- $659 – $1,223
Heat risk 7/10 · Major
- Hot days now (above 99°F)
- 7 days/yr
- Hot days in 30 yrs
- 19 days/yr
Wind risk 1/10 · Minimal
- Chance of severe wind over 30 yrs
- —
Air-quality risk 6/10 · Moderate
- Unhealthy air days now
- 9 days/yr
- Unhealthy air days in 30 yrs
- 13 days/yr
Risk factors via First Street. Map © Google.
Why this score? — see what drove the C grade
The composite is a weighted blend of 9 inputs, each scored 0–100. Each bar is that input's sub-score; the figure is the points it added to the 100-point composite (weight × sub-score).
- Cash flow +24.8/30.0
- DSCR +8.0/10.0
- 1% rule +6.4/10.0
- Schools +5.9/10.0
- Condition / age +3.8/5.0
- Livability +3.5/5.0
- Rent growth +2.9/5.0
- ARV discount +0.0/15.0
- Appreciation +0.0/10.0
$355,000
🖨 Deal sheet 📄 Offer letter ✓ Due diligence
Listing remarks
Come and take a look at this Triple wide mobile home. Located in Greenbrier Mobile home park. This 3 bedroom 2 bath with cathedral ceilings through out the home. Offers 1824 sqft of living Space. The master bedroom has a custom bathroom and a walk in closet. The master bedroom is very spacious. It has enough room for a desk, treadmill and can fit a king size bed and still have room to walk around. The other rooms both very roomy and both have nice sliding closets. The mobile home has had updated changes. Currently working on cleaning the inside and packing. Also the living room is very spacious. Same goes for the dinning room. Must be seeing by appointment only. Seller also extended the rea
Key facts
- Extended rear deck
- Walk in closet
- Fruit trees
Tags
Property features AI
Finance
- Other: Living area source: public records; Located in Custom Canyon Country 1 subdivision; Coordinates: latitude 34.419767, longitude -118.506942; Directions: when entering the park turn right on the first street; home on the right
- Financial info: Land lease of $1,400
- HOA & community: Senior community; Located in the Greenbrier park
Exterior
- Parking: 3 total parking spaces; 3-car garage
- Utilities: Public sewer; District/public water
- Home design: Single-story property; Mobile home remains on site; Mobile dimensions approximately 60 ft by 60 ft
- Construction: Year built per public records; Mobile/manufactured construction (triple body type)
- Exterior features: Community pool; Neighborhood includes dog park, hiking and park areas; Lot characterized as 0–1 unit per acre
Interior
- Bathrooms: 2 full bathrooms
- Heating & cooling: Central furnace heating
- Interior features: Front and rear entry; Single-level home (entry level 1)
- Laundry & utility: Inside laundry in a dedicated room; Washer/dryer hookups available
Neighborhood map
What this means for you Summary
Snapshot
- This is a 3-bed/2.0-bath manufactured listed at $355k. Condition is rated good.
Deal economics
- At list price, monthly cash flow is $753 ($9k/yr) — positive.
- The deal already cash-flows at list — no discount required.
- Meets the 1% rule at list price ($4k rent vs $355k).
- Recommended offer: $350k (1.5% below list) — sets the bar for market timing.
- Cap rate 8.8% vs local median 2.8% in Santa Clarita — top-decile yield for the area; either an underpriced asset or a hidden risk that comps aren't pricing in. Stress-test before assuming the spread holds.
Location & tenants
- Location reads 70/100 on livability (#229 in CA) — a middle-class / working-renter tenant base. Strengths: employment A+, housing A, crime A-; Watch: amenities D+, cost of living F, health & safety F.
- William S. Hart Union High (suburban): math 52% / reading 72% proficiency, ranked #155 of 1,400 in CA (top 11%) — acceptable for families but not a draw, mixed tenant base, ~2y average lease; only 18% free/reduced lunch — higher-income household profile.
- Market conditions: Rents rising (+1.7%/yr); 106 active listings in the ZIP; 2 comparable units currently listed for rent nearby; high-income renter base; 19,697 units permitted in Los Angeles County in 2024 (9,426 in 5+ unit buildings).
- This rent runs 42% of the median local income ($115k/yr) — at the standard rent-burdened threshold; future hikes will face affordability resistance.
Forward outlook
- Local home prices are declining (-3.0%/yr); year-one equity from $2k of loan paydown is wiped out by about $11k of value loss. Plan a longer hold.
- Los Angeles County population projected at +9% by 2050 — modest demand growth; plan on rents tracking national, not racing it.
Negotiation context
- It's been on market 21 days — a 2% lower offer ($350k) is reasonable based on typical stale-listing flexibility.
Risks & watch-outs
- Climate carrying-cost: severe wildfire risk; extreme-heat days projected 7→19/yr by 2055 (HVAC capex compounding) — expect insurance premiums to compound above CPI over the hold.
Questions for the listing agent
- Is there a deadline driving the sale (1031 exchange, divorce, estate, relocation)? That informs how much negotiation room exists.
- Schools are B-rated — typically a magnet for longer-tenancy family renters. What's the average tenant stay here, and is there a school-zone premium baked into asking?
- What's the average days-on-market for RENTAL listings here right now (not sales)? A rising rental-DOM trend means longer vacancies and softer asking-rent achievability than the comps imply.
- What's the recent tenant-quality profile in this submarket — average credit score on applications, eviction rate, late-payment / NSF rate, and stable-employment percentage? A property-management company in the area should have these aggregated.
- How much new for-sale + rental construction is in the pipeline within 1–3 miles? Heavy new supply typically softens prices + rents 12–24 months out; constrained supply supports both.
Investment metrics
- 1% rule
- 1.14% ✓
- Cap rate
- 8.84%
- Cash-on-cash
- 9.09%
- DSCR
- 1.40
- GRM
- 7.3
CMA / ARV
- ARV (on-the-fly)
- $271,776
- Comps found
- 12
Show comp detail 12 sales within ~0.75 mi
| Address | Dist | Beds/Ba | Sqft | Sold | Price | $/sf | Match |
|---|---|---|---|---|---|---|---|
| 21208 Blue Curl Way #0 | 0.05mi | 3/2.0 | 1,848 (+1%) | 17mo | $275,000 | $149 | 82 |
| 21202 Blue Curl Way | 0.05mi | 3/2.0 | 1,620 (-11%) | 3mo | $220,000 | $136 | 76 |
| 21319 Blue Curl Way | 0.15mi | 3/2.0 | 1,740 (-5%) | 14mo | $219,900 | $126 | 74 |
| 21302 Blue Curl Way | 0.12mi | 3/2.0 | 1,560 (-14%) | 1mo | $225,000 | $144 | 70 |
| 26428 Doveweed Way | 0.29mi | 2/2.0 (-1) | 1,750 (-4%) | 6mo | $289,000 | $165 | 70 |
| 26521 Cockleburr Ln | 0.23mi | 3/2.0 | 2,016 (+10%) | 6mo | $305,700 | $152 | 67 |
| 26421 Doveweed Way | 0.30mi | 2/2.0 (-1) | 1,790 (-2%) | 14mo | $315,000 | $176 | 66 |
| 21433 Tumbleweed Way | 0.45mi | 2/2.0 (-1) | 1,896 (+4%) | 3mo | $210,000 | $111 | 65 |
| 21205 Willow Weed Way | 0.02mi | 3/2.0 | 1,561 (-14%) | 13mo | $359,000 | $230 | 64 |
| 21317 Blue Curl Way | 0.15mi | 2/2.0 (-1) | 1,604 (-12%) | 10mo | $225,000 | $140 | 60 |
| 26417 Bentgrass Way #50 | 0.56mi | 2/2.0 (-1) | 1,800 (-1%) | 15mo | $250,000 | $139 | 54 |
| 26411 Bentgrass Way | 0.55mi | 3/2.0 | 1,608 (-12%) | 9mo | $359,000 | $223 | 47 |
Match score weights: distance 35% · size 25% · config 20% · recency 20%. Top-matched comps best support the ARV.
Projected returns pro-forma
-3.0% appreciation · 1.7% rent growth · sell at horizon
- IRR
- -4.0%
- Equity multiple
- 0.85×
- Total profit
- $-14,772
- Equity at exit
- $52,932
- IRR
- 4.1%
- Equity multiple
- 1.28×
- Total profit
- $28,157
- Equity at exit
- $30,694
Cash invested: $99,400 (down + closing). Projections, not guarantees.
Landlord ↔ Tenant lean methodology
- Overall (STATE)
- 18 Strongly Tenant-Friendly
- State California
- 18 Strongly Tenant-Friendly · D+13
- County
- — inherits STATE
- City
- — inherits STATE
ZIP-level market 91351
- Rents YoY
- 1.7%
- Active inventory
- 106
- Price-to-rent
- 7.3×
Monthly cashflow live
- Estimated rent
- $4,058 medium interval (Pro) →
- Mortgage (P&I)
- −$1,862
- Tax est. 1.5%
- −$444 /mo · $5,325/yr
- Insurance
- −$148
- HOA
- −$0
- Vacancy / Maint / Mgmt
- −$852
- Net cashflow
- $753
Break-even live
UW: 25.0% down · 7.5% · 30yr · 1.5% tax · 5.0% vac · 8.0% maint · 8.0% mgmt
Financing live
Cash to close
- Down payment
- $88,750
- Closing costs
- $10,650
- Reserves months
- —
- Total cash needed
- —
Loan-product check · same deal, 3 products live
Conventional
25% down · 7.5% · 30yr
- Down + closing
- —
- Monthly P&I
- —
- Monthly cashflow
- —
- DSCR
- —
- Eligible?
- —
Personal DTI + credit; lowest rate.
DSCR
20% down · 8.5% · 30yr
- Down + closing
- —
- Monthly P&I
- —
- Monthly cashflow
- —
- DSCR
- —
- Eligible?
- —
No personal income docs; deal must DSCR.
Hard money
10% down · 12.0% · 12mo
- Down + closing
- —
- Monthly P&I
- —
- Monthly cashflow
- —
- DSCR
- —
- Eligible?
- —
Short-term bridge; refi at stabilization.
Rent comps 2 comps
| Address | Beds | Baths | Sqft | Rent | $/sqft | DOM | Units | Dist |
|---|---|---|---|---|---|---|---|---|
| 22056 Windham Way Santa Clarita, CA | 4.0 | 3.0 | 2132 | $4,350 | $2.04 | 1d | 1 | 0.61mi |
| 26844 Albion Way Unit 1 Santa Clarita, CA | 3.0 | 2.5 | 1817 | $3,995 | $2.20 | 12d | 1 | 1.46mi |
Listing history 14 events
-
2026-06-18days on market $355,000 Active 21 DOM
-
2026-06-17days on market $355,000 Active 20 DOM
-
2026-06-16days on market $355,000 Active 19 DOM
-
2026-06-15days on market $355,000 Active 18 DOM
-
2026-06-13days on market $355,000 Active 16 DOM
-
2026-06-13days on market $355,000 Active 15 DOM
-
2026-06-09days on market $355,000 Active 12 DOM
-
2026-06-08days on market $355,000 Active 11 DOM
-
2026-06-07days on market $355,000 Active 10 DOM
-
2026-06-04days on market $355,000 Active 7 DOM
-
2026-06-03days on market $355,000 Active 6 DOM
-
2026-06-02days on market $355,000 Active 5 DOM
-
2026-06-01days on market $355,000 Active 4 DOM
-
2026-05-31days on market $355,000 Active 3 DOM
ⓘ Source: listings_history table (triggers on properties + properties_extension) + one-shot
backfill from property_details.listing_events for pre-trigger history.
Climate risk First Street
- Flood 1/10 Low FEMA zone X (shaded) · 0% chance over 30 yrs
- Wildfire 8/10 Severe
- Heat 7/10 Severe 7 d/yr ≥99°F today · 19 d/yr by 30 yrs out
- Wind 1/10 Low
- Air quality 6/10 Major 9 unhealthy d/yr today · 13 by 30 yrs out
Nearby sold comps map
Loading sold comps map…
Walkable amenities ~0.75 mi
Loading nearby amenities…
Taxation est. · year 1
- Rental income
- $48,697
- − Mortgage interest
- −$19,886
- − Property taxes
- −$5,325
- − Insurance
- −$1,775
- − Repairs & maintenance
- −$3,896
- − Management
- −$3,896
- − Depreciation
- −$10,327
- Taxable income
- $3,593
- Est. tax owed @ 24.0%
- −$862
- After-tax cash flow
- $8,169/yr
For passive investors: Depreciation is non-cash, so a rental often shows a tax loss while cash-flowing — sheltering income. Rental losses are passive: they offset passive income freely, and up to $25,000/yr can offset ordinary (W-2) income if you actively participate and your MAGI is under $100k (phasing out to $0 by $150k); unused losses carry forward. On sale, claimed depreciation is recaptured at up to 25%, and gains may owe capital-gains tax (a 1031 exchange can defer both). Figures are a year-1 estimate at your 24.0% rate — not tax advice; consult a CPA.
Condition & rehab AI · 12 photos
This triple-wide mobile home in Greenbrier Mobile Home Park is in good condition with no major repairs needed. It offers a spacious layout and has been updated with new flooring and paint. Potential buyers or renters can appreciate the home's curb appeal and interior condition, making it a good investment.
Value-add opportunities
- Both Painting the exterior siding — Fresh paint can enhance the curb appeal and increase the home's value.
- Both Landscaping improvements — Well-maintained landscaping can increase the home's curb appeal and attract more potential buyers or renters.
- Both Interior cleaning and staging — A clean and staged interior can make the home more appealing to potential buyers or renters.
- Both Updating the HVAC system — A modern and efficient HVAC system can improve comfort and energy efficiency, which can increase the home's value.
- Both Upgrading the kitchen and bathrooms — Modernizing the kitchen and bathrooms can increase the home's appeal and value, especially for potential buyers or renters looking for updated spaces.
Renovation cost estimate screening
Value-add ROI direction
- Both Painting the exterior siding — Fresh paint can enhance the curb appeal and increase the home's value. ↑
- Both Landscaping improvements — Well-maintained landscaping can increase the home's curb appeal and attract more potential buyers or renters. ↑
- Both Interior cleaning and staging — A clean and staged interior can make the home more appealing to potential buyers or renters. ↑
- Both Updating the HVAC system — A modern and efficient HVAC system can improve comfort and energy efficiency, which can increase the home's value. ↑
- Both Upgrading the kitchen and bathrooms — Modernizing the kitchen and bathrooms can increase the home's appeal and value, especially for potential buyers or renters looking for updated spaces. ↑
ⓘ Cost ranges are severity-bucket heuristics (US national rule-of-thumb). Get contractor quotes + a written scope before underwriting a rehab budget.
Schools (NCES district)
- District
- William S. Hart Union High
- NCES district ID
- 0642510
- Math proficiency
- 52% ▬ 0.00%
- Reading proficiency
- 72% ▲ 1.00%
- Median HH income
- $95,844
- Composite
- 58.6/100
- National rank
- #2030
- State rank
- #155 of 1400 in CA
Livability — Santa Clarita
- Score
- 70/100
- State rank
- #229
- US rank
- #7378
Category grades
Schools grade is shown separately in the Schools card above.
Census & demographics
- Census place
- Santa Clarita, CA
- County
- Los Angeles County · 9,444,647 people
- City population
- 219,066
- Metro
- Los Angeles-Long Beach-Anaheim, CA
- Population (ZIP)
- 33,155
- Household income
- $115,364
- Rent vs Own
- Severe rent burden
- 784.0
Population outlook (Los Angeles County) Hauer SSP2
- Today (2025)
- 10,940,515 people
- By 2030
- 11,256,481 · +2.9%
- By 2040
- 11,729,929 · +7.2%
- By 2050
- 11,948,407 · +9.2%
- By 2075
- 11,818,114 · +8.0%
- By 2100
- 10,842,928 · -0.9%
Race, ethnicity, and origin ACS 2023
- Neighborhood character
- Diverse neighborhood (Simpson 0.64)
- Race & ethnicity
- Hispanic / Latino 49% White 34% Two or more races 21% Asian 6% Black 4% Native American 1%
- Hispanic origin (detail)
- Mexican 36%
- Common ancestry
- Romanian 1% Lithuanian 1% Scotch-Irish 1%
- Foreign-born
- 23% · Canada, Jamaica, South Korea
- Languages at home
- 54% English-only · Spanish 35% Other Indo-European 3% Tagalog/Filipino 2%
Political lean MEDSL · Los Angeles
- 2024 margin
- Solid D (+32.9) · D 64.8% · R 31.9% · Other 3.3%
- 2008→2024 swing
- -7.4pp toward R · 2008: 40.4pp · 2024: 32.9pp
- All cycles
- 2024: D+32.9 2020: D+44.2 2016: D+48.0 2012: D+40.0 2008: D+40.4
Not yet ingested
- Civics
- —
Market trends
- HPI YoY
- ▼ -703.16%
- Current HPI
- 360.9901
- Rent YoY
- ▲ 1.70%
- Metro
- Los Angeles-Long Beach-Anaheim, CA
- State GDP YoY
- ▲ 3.21%
- F500 in state
- 116
Industry mix (Fortune 500 HQ in CA)
| Industry | F500 HQs | Revenue |
|---|---|---|
| Technology | 27 | $1,492B |
|
||
| Financial Services | 3 | $174B |
|
||
| Retail | 3 | $44B |
|
||
| Insurance | 3 | $26B |
|
||
| Media / Entertainment | 2 | $115B |
|
||
| Pharmaceuticals / Biotech | 2 | $62B |
|
||
Price history
1 event — show timeline
- 2026-05-28 Listed $355,000 CRMLS
Cash-flow waterfall
monthlySold comps — $/sqft
last 12 mo · ≤1 miLoading sold comps…