 Duplex
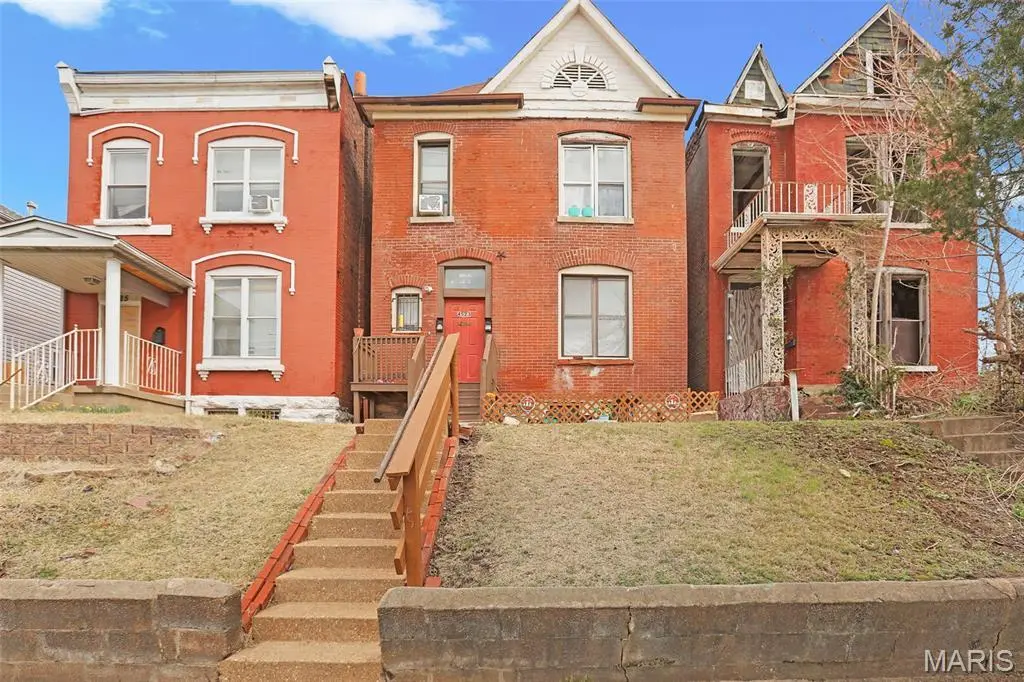
4523 Page Blvd · St. Louis, MO
Flood risk 1/10 · Minimal
- FEMA flood zone
- X (unshaded)
- Chance of flooding over 30 yrs
- 0.0%
- Est. flood insurance / yr
- $473 – $860
Fire risk 1/10 · Minimal
- Est. fire insurance / yr
- $1,054 – $1,958
Heat risk 5/10 · Moderate
- Hot days now (above 107°F)
- 7 days/yr
- Hot days in 30 yrs
- 21 days/yr
Wind risk 2/10 · Minimal
- Chance of severe wind over 30 yrs
- 1.0%
Air-quality risk 4/10 · Minor
- Unhealthy air days now
- 4 days/yr
- Unhealthy air days in 30 yrs
- 5 days/yr
Risk factors via First Street. Map © Google.
Why this score? — see what drove the B grade
The composite is a weighted blend of 9 inputs, each scored 0–100. Each bar is that input's sub-score; the figure is the points it added to the 100-point composite (weight × sub-score).
- Cash flow +30.0/30.0
- 1% rule +10.0/10.0
- DSCR +10.0/10.0
- ARV discount +7.5/15.0
- Appreciation +3.9/10.0
- Rent growth +2.5/5.0
- Livability +2.5/5.0
- Condition / age +2.5/5.0
- Schools +1.2/10.0
$100,000
🖨 Deal sheet 📄 Offer letter ✓ Due diligence
Multi-family units
County records classify this as Multi-Family (2-4 Unit). Listing-text estimate: 2 units. confirmed
Listing remarks MLS
Fully rented duplex with immediate income potential. Both units are currently occupied on month-to-month leases and each brings in $700 per month, making this a great opportunity for an investor looking to add to their portfolio. This brick property offers strong rental appeal with spacious units, charming historic character, and a large backyard. Convenient location with easy access to major roads, public transportation, and city amenities. Keep both tenants in place for steady cash flow or take advantage of the month-to-month terms for added flexibility. Property to be sold as-is.
Key facts
- Fully rented duplex
- Large backyard
- Convenient location
Tags
Neighborhood map
What this means for you Summary
Snapshot
- This is a 2 × 2-bed/1-bath units multifamily listed at $100k.
Deal economics
- At list price, monthly cash flow is $2k ($21k/yr) — positive. Per door: $882/mo.
- The deal already cash-flows at list — no discount required.
- Meets the 1% rule at list price ($3k rent vs $100k).
- Recommended offer: $94k (6.0% below list) — sets the bar for market timing.
- Cap rate 27.5% vs local median 5.0% in St. Louis — top-decile yield for the area; either an underpriced asset or a hidden risk that comps aren't pricing in. Stress-test before assuming the spread holds.
Location & tenants
- Location reads: area grade B — affects rentability + tenant quality, not the cash-flow math above.
- St. Louis City (urban): math 10% / reading 18% proficiency, ranked #312 of 324 in MO (top 96%) — low school quality limits family demand, transient renter base, plan for 1-2y turnover; 80% free/reduced lunch — lower-income household profile, screen leases tightly.
- Market conditions: 58 active listings in the ZIP; 40 comparable units currently listed for rent nearby; rentals at typical pace (median 24d on market — plan ~3-4 weeks tenant-placement turnaround); 294 units permitted in St. Louis city in 2024 (227 in 5+ unit buildings).
Forward outlook
- Local home prices are declining (-2.1%/yr); year-one equity from $691 of loan paydown is wiped out by about $2k of value loss. Plan a longer hold.
- St. Louis County population projected to shrink 6% by 2050 — rents likely to lag national; underwrite the cash flow, not the appreciation.
- At projected returns (-2.1% appreciation + 3.0% rent growth), your $28k cash investment doubles in ~2 years — after that, you're playing with house money.
Negotiation context
- It's been on market 87 days — a 6% lower offer ($94k) is reasonable based on typical stale-listing flexibility.
- 2 sale attempts since 8y ago with the ask held roughly flat each time — persistent listings suggest the price (not the market) is what's stuck; bring a comps-based counter.
- Current owner paid $15k; list at $100k implies a 562% gain — meaningful room to come down on a strong offer.
Risks & watch-outs
- Watch-outs: built in 1890 — expect roof / HVAC / electrical / plumbing capex.
- Climate carrying-cost: extreme-heat days projected 7→21/yr by 2055 (HVAC capex compounding) — expect insurance premiums to compound above CPI over the hold.
Questions for the listing agent
- It's been on market 87 days. Have you received any prior offers? Is the seller open to a 6% concession, seller financing, or rate buy-down credit?
- Can we see the unit-by-unit rent roll, current vacancy, and any below-market leases? What's the average tenancy length?
- What capital expenditures (roof, boiler, parking lot, exteriors) have been made in the last 5 years, and what's planned in the next 2?
- Built in 1890 — when were the roof, HVAC, electrical panel, plumbing, and water heater last replaced?
- Why hasn't it sold? Are there any deal-killer items the seller is aware of (foundation, flood, title, zoning, code violations)?
- Is there a deadline driving the sale (1031 exchange, divorce, estate, relocation)? That informs how much negotiation room exists.
- What's the average days-on-market for RENTAL listings here right now (not sales)? A rising rental-DOM trend means longer vacancies and softer asking-rent achievability than the comps imply.
- What's the recent tenant-quality profile in this submarket — average credit score on applications, eviction rate, late-payment / NSF rate, and stable-employment percentage? A property-management company in the area should have these aggregated.
- How much new apartment / multifamily construction is in the pipeline within 1–3 miles? Heavy new supply (>2% of stock underway) typically softens rents 12–24 months out; light construction supports rent growth.
Investment metrics
- 1% rule
- 2.98% ✓
- Cap rate
- 27.46%
- Cash-on-cash
- 75.60%
- DSCR
- 4.36
- GRM
- 2.8
CMA / ARV
- ARV (median comp)
- $56,950
- List price
- $100,000
- Delta
- 75.59%
- Verdict
- OVERPRICED
- Comps
- 13 within 1.0 mi
Projected returns pro-forma
-2.14% appreciation · 3.0% rent growth · sell at horizon
- IRR
- 76.1%
- Equity multiple
- 4.56×
- Total profit
- $99,758
- Equity at exit
- $18,765
- IRR
- 79.2%
- Equity multiple
- 9.38×
- Total profit
- $234,682
- Equity at exit
- $15,414
Cash invested: $28,000 (down + closing). Projections, not guarantees.
Landlord ↔ Tenant lean methodology
- Overall (STATE)
- 81 Strongly Landlord-Friendly
- State Missouri
- 81 Strongly Landlord-Friendly · R+10
- County
- — inherits STATE
- City
- — inherits STATE
ZIP-level market 63113
- Home prices YoY
- -2.0%
- Active inventory
- 58
- Price-to-rent
- 5.6×
Monthly cashflow live
- Estimated rent
- $2,980 high interval (Pro) →
- Mortgage (P&I)
- −$524
- Tax from tax record
- −$24 /mo · $288/yr
- Insurance
- −$42
- HOA
- −$0
- Vacancy / Maint / Mgmt
- −$626
- Net cashflow
- $1,764
Break-even live
2-unit breakdown (identical units grouped — click to expand)
| Units | Beds | Baths | Est. rent |
|---|---|---|---|
| 2× units | 2 | 1 | $2,980 |
| #1 | 2 | 1 | $1,490 |
| #2 | 2 | 1 | $1,490 |
| Total (2 units) | $2,980 | ||
UW: 25.0% down · 7.5% · 30yr · 1.5% tax · 5.0% vac · 8.0% maint · 8.0% mgmt
Financing live
Cash to close
- Down payment
- $25,000
- Closing costs
- $3,000
- Reserves months
- —
- Total cash needed
- —
Loan-product check · same deal, 3 products live
Conventional
25% down · 7.5% · 30yr
- Down + closing
- —
- Monthly P&I
- —
- Monthly cashflow
- —
- DSCR
- —
- Eligible?
- —
Personal DTI + credit; lowest rate.
DSCR
20% down · 8.5% · 30yr
- Down + closing
- —
- Monthly P&I
- —
- Monthly cashflow
- —
- DSCR
- —
- Eligible?
- —
No personal income docs; deal must DSCR.
Hard money
10% down · 12.0% · 12mo
- Down + closing
- —
- Monthly P&I
- —
- Monthly cashflow
- —
- DSCR
- —
- Eligible?
- —
Short-term bridge; refi at stabilization.
Rent comps 40 comps
| Address | Beds | Baths | Sqft | Rent | $/sqft | DOM | Units | Dist |
|---|---|---|---|---|---|---|---|---|
| 763 Walton Ave Unit 763 St. Louis, MO | 2.0 | 1.0 | 1100 | $1,100 | $1.00 | 43d | 1 | 0.46mi |
| 4400 Delmar Blvd St. Louis, MO | 3.0 | 1.0 | 1450 | $1,600 | $1.10 | 43d | 1 | 0.50mi |
| 4500 Olive St Unit D St. Louis, MO | 2.0 | 2.0 | 1200 | $1,725 | $1.44 | 43d | 1 | 0.61mi |
| 4466 Olive St Saint Louis, MO | 1.0–2.0 | 1.0–2.5 | 1222 | $2,495 | $2.04 | 1d | 7 | 0.63mi |
| 4738 Olive St Saint Louis, MO | 2.0 | 2.0 | 1413 | $1,925 | $1.36 | 23d | 1 | 0.66mi |
| 625 N Euclid Ave St. Louis, MO | 2.0 | 1.0–2.0 | 984 | $3,120 | $3.17 | 1d | 16 | 0.68mi |
| 4901 Washington Blvd Saint Louis, MO | 2.0 | 2.0 | 1620 | $2,500 | $1.54 | 11d | 1 | 0.70mi |
| 4446 McPherson Ave Saint Louis, MO | 2.0 | 1.5 | 1440 | $2,100 | $1.46 | 23d | 1 | 0.77mi |
| 377 N Taylor Ave St. Louis, MO | 2.0 | 2.0 | 1209 | $1,595 | $1.32 | 14d | 1 | 0.78mi |
| 401 N Euclid Ave St. Louis, MO | 3.0 | 1.0 | 1025 | $1,615 | $1.58 | 1d | 4 | 0.79mi |
| 4140 Washington Blvd Saint Louis, MO | 1.0–2.0 | 1.0–2.5 | 907 | $2,035 | $2.24 | 1d | 1 | 0.83mi |
| 4247 Maffitt Ave St. Louis, MO | 3.0 | 1.5 | 1700 | $1,000 | $0.59 | 4d | 1 | 0.86mi |
| 1320 Academy Ave Unit A St. Louis, MO | 2.0 | 1.0 | 1600 | $1,090 | $0.68 | 43d | 1 | 0.93mi |
| 5096 Minerva Ave Unit C St. Louis, MO | 3.0 | 1.0 | 1800 | $1,395 | $0.78 | 43d | 1 | 0.93mi |
| 4127 Westminster Pl St. Louis, MO | 2.0 | 2.5 | 1216 | $2,095 | $1.72 | 7d | 1 | 0.93mi |
| 4322 Maryland Ave St. Louis, MO | 2.0 | 1.5 | 1200 | $1,799 | $1.50 | 23d | 1 | 0.96mi |
| 4256 Maryland Ave Saint Louis, MO | 3.0 | 2.0 | 1400 | $1,800 | $1.29 | 10d | 1 | 0.98mi |
| 4256 Maryland Ave Saint Louis, MO | 3.0 | 2.0 | 1400 | $1,900 | $1.36 | 43d | 1 | 0.98mi |
| 5130 Kensington Ave Unit 1 St. Louis, MO | 3.0 | 2.0 | 1200 | $1,245 | $1.04 | 23d | 1 | 0.99mi |
| 322 N Boyle Ave Unit 3N St. Louis, MO | 2.0 | 2.0 | 1115 | $1,550 | $1.39 | 43d | 1 | 0.99mi |
| 4615 Lindell Blvd Saint Louis, MO | 1.0–2.0 | 1.0–2.5 | 1251 | $2,075 | $1.66 | 7d | 6 | 1.01mi |
| 4605 Lindell Blvd Saint Louis, MO | 2.0 | 2.0–3.0 | 1868 | $2,398 | $1.28 | 7d | 3 | 1.02mi |
| 404 N Sarah St Saint Louis, MO | 3.0 | 2.5 | 1772 | $2,600 | $1.47 | 43d | 1 | 1.03mi |
| 4400 Lindell Blvd Saint Louis, MO | 2.0 | 1.0–2.0 | 950 | $2,540 | $2.67 | 2d | 15 | 1.04mi |
| 232 Kingshighway Blvd St. Louis, MO | 1.0 | 1.5 | 1240 | $4,200 | $3.39 | 43d | 1 | 1.09mi |
| 4359 W Pine Blvd Saint Louis, MO | 2.0 | 1.0 | 1100 | $1,995 | $1.81 | 17d | 1 | 1.10mi |
| 5137 Waterman Blvd Apt 4 St. Louis, MO | 3.0 | 2.0 | 1550 | $1,700 | $1.10 | 43d | 1 | 1.14mi |
| 5137 Waterman Blvd Apt 4 St. Louis, MO | 3.0 | 2.0 | 1550 | $1,700 | $1.10 | 23d | 1 | 1.14mi |
| 4567 W Pine Blvd Saint Louis, MO | 2.0–3.0 | 2.0 | 1326 | $2,575 | $1.94 | 2d | 7 | 1.14mi |
| 4466 W Pine Blvd Unit 7C Saint Louis, MO | 2.0 | 2.0 | 1440 | $1,850 | $1.28 | 43d | 1 | 1.14mi |
| 4225 W Pine Blvd #2 Saint Louis, MO | 2.0 | 2.0 | 1545 | $2,300 | $1.49 | 43d | 1 | 1.14mi |
| 4366 W Pine Blvd Unit B St. Louis, MO | 2.0 | 1.5 | 1134 | $1,850 | $1.63 | 23d | 1 | 1.14mi |
| 1420 Union Blvd Unit 2F St. Louis, MO | 2.0 | 1.0 | 1096 | $995 | $0.91 | 43d | 1 | 1.16mi |
| 4949 W Pine Blvd St. Louis, MO | 1.0–2.0 | 1.0–2.0 | 925 | $2,225 | $2.41 | 4d | 12 | 1.18mi |
| 4065 W Pine Blvd Saint Louis, MO | 1.0–3.0 | 1.0–2.0 | 1075 | $1,900 | $1.77 | 43d | 8 | 1.20mi |
| 100 N Kingshighway Blvd Saint Louis, MO | 3.0 | 1.0–2.0 | 1171 | $5,438 | $4.64 | 2d | 80 | 1.21mi |
| 100 N Kingshighway Blvd Saint Louis, MO | 3.0 | 1.0–2.0 | 1211 | $5,531 | $4.57 | 43d | 84 | 1.21mi |
| 4410 Laclede Ave Unit 4412-2F Laclede St. Louis, MO | 2.0 | 1.0 | 1350 | $1,695 | $1.26 | 20d | 1 | 1.23mi |
| 4909 Laclede Ave Saint Louis, MO | 2.0 | 2.0 | 1405 | $3,800 | $2.70 | 4d | 1 | 1.25mi |
| 4909 Laclede Ave Saint Louis, MO | 2.0 | 2.0 | 1405 | $3,800 | $2.70 | 4d | 1 | 1.25mi |
Listing history 19 events
-
2026-06-18days on market $100,000 Active 87 DOM
-
2026-06-17days on market $100,000 Active 86 DOM
-
2026-06-16days on market $100,000 Active 85 DOM
-
2026-06-15days on market $100,000 Active 84 DOM
-
2026-06-13days on market $100,000 Active 82 DOM
-
2026-06-09days on market $100,000 Active 78 DOM
-
2026-06-08days on market $100,000 Active 77 DOM
-
2026-06-08days on market $100,000 Active 76 DOM
-
2026-06-05days on market $100,000 Active 73 DOM
-
2026-06-03days on market $100,000 Active 72 DOM
-
2026-06-02days on market $100,000 Active 71 DOM
-
2026-06-01days on market $100,000 Active 70 DOM
-
2026-05-31days on market $100,000 Active 69 DOM
-
2026-03-23$100,000 Active 589-char remark
Show marketing remark (589 chars)
Fully rented duplex with immediate income potential. Both units are currently occupied on month-to-month leases and each brings in $700 per month, making this a great opportunity for an investor looking to add to their portfolio. This brick property offers strong rental appeal with spacious units, charming historic character, and a large backyard. Convenient location with easy access to major roads, public transportation, and city amenities. Keep both tenants in place for steady cash flow or take advantage of the month-to-month terms for added flexibility. Property to be sold as-is.
-
2018-07-20soldstatus $15,100
-
2018-07-13soldstatus Closed 223-char remark
Show marketing remark (223 chars)
Steal of a deal. Priced to sell. Don't wait or you'll miss it. As-is with all faults. Seller will make no repairs, grant no discounts or credits for defects. Inspections may be conducted for informational purposes only.
-
2018-06-09status Pending 223-char remark
Show marketing remark (223 chars)
Steal of a deal. Priced to sell. Don't wait or you'll miss it. As-is with all faults. Seller will make no repairs, grant no discounts or credits for defects. Inspections may be conducted for informational purposes only.
-
2018-06-06$12,000 Active 223-char remark
Show marketing remark (223 chars)
Steal of a deal. Priced to sell. Don't wait or you'll miss it. As-is with all faults. Seller will make no repairs, grant no discounts or credits for defects. Inspections may be conducted for informational purposes only.
-
1994-08-05soldstatus
ⓘ Source: listings_history table (triggers on properties + properties_extension) + one-shot
backfill from property_details.listing_events for pre-trigger history.
Tax reassessment forecast MO · Resets to sale price
- Current annual tax
- $288 · $24/mo
- Projected year-2 tax
- $970 · $81/mo
- Expected delta
- +$682/yr (+$57/mo · 236.4%)
ⓘ Screening estimate from a state-policy table — verify with the county assessor before closing.
Climate risk First Street
- Flood 1/10 Low FEMA zone X (unshaded) · 0% chance over 30 yrs
- Wildfire 1/10 Low
- Heat 5/10 Major 7 d/yr ≥107°F today · 21 d/yr by 30 yrs out
- Wind 2/10 Low 100% chance of damaging wind over 30 yrs
- Air quality 4/10 Moderate 4 unhealthy d/yr today · 5 by 30 yrs out
Nearby sold comps map
Loading sold comps map…
Walkable amenities ~0.75 mi
Loading nearby amenities…
Taxation est. · year 1
- Rental income
- $35,760
- − Mortgage interest
- −$5,602
- − Property taxes
- −$288
- − Insurance
- −$500
- − Repairs & maintenance
- −$2,861
- − Management
- −$2,861
- − Depreciation
- −$2,909
- Taxable income
- $20,739
- Est. tax owed @ 24.0%
- −$4,977
- After-tax cash flow
- $16,192/yr
For passive investors: Depreciation is non-cash, so a rental often shows a tax loss while cash-flowing — sheltering income. Rental losses are passive: they offset passive income freely, and up to $25,000/yr can offset ordinary (W-2) income if you actively participate and your MAGI is under $100k (phasing out to $0 by $150k); unused losses carry forward. On sale, claimed depreciation is recaptured at up to 25%, and gains may owe capital-gains tax (a 1031 exchange can defer both). Figures are a year-1 estimate at your 24.0% rate — not tax advice; consult a CPA.
Schools (NCES district)
- District
- St. Louis City
- NCES district ID
- 2929280
- Math proficiency
- 10% ▼ -6.00%
- Reading proficiency
- 18% ▼ -3.00%
- Median HH income
- $35,685
- Composite
- 11.54/100
- National rank
- #9699
- State rank
- #312 of 324 in MO
Livability — St. Louis
No livability data for this city. (Only ~50 U.S. cities are tracked.)
Census & demographics
- Census place
- St. Louis, MO
- City population
- 283,259
- Population (ZIP)
- 11,610
Population outlook (St. Louis County) Hauer SSP2
- Today (2025)
- 315,737 people
- By 2030
- 313,865 · -0.6%
- By 2040
- 305,439 · -3.3%
- By 2050
- 296,529 · -6.1%
- By 2075
- 271,028 · -14.2%
- By 2100
- 255,359 · -19.1%
Race, ethnicity, and origin ACS 2023
- Neighborhood character
- Predominantly Black (91%)
- Race & ethnicity
- Black 91% White 6% Two or more races 2% Hispanic / Latino 1%
- Foreign-born
- 2% · Canada
Political lean MEDSL · St. Louis
- 2024 margin
- Solid D (+64.7) · D 81.4% · R 16.7% · Other 2.0%
- 2008→2024 swing
- -3.5pp toward R · 2008: 68.2pp · 2024: 64.7pp
- All cycles
- 2024: D+64.7 2020: D+66.2 2016: D+63.7 2012: D+66.6 2008: D+68.2
Not yet ingested
- Civics
- —
Market trends
- HPI YoY
- ▼ -2.14%
- Current HPI
- 107.1335
- Rent YoY
- —
- Metro
- —
- State GDP YoY
- ▲ 1.84%
- F500 in state
- 20
Industry mix (Fortune 500 HQ in MO)
| Industry | F500 HQs | Revenue |
|---|---|---|
| Healthcare | 1 | $163B |
|
||
| Insurance | 1 | $21B |
|
||
| Industrial Technology | 1 | $17B |
|
||
| Retail | 1 | $16B |
|
||
| Industrial Distribution | 1 | $10B |
|
||
| Utilities | 1 | $9B |
|
||
Price history
+733.3% since first listed6 events — show timeline
- 2026-03-23 Listed $100,000 MARIS as Distributed by MLS Grid
- 2018-07-20 Sold (Public Records) $15,100 Public Records
- 2018-07-13 Sold (MLS) — MARIS as Distributed by MLS Grid
- 2018-06-09 Pending — MARIS as Distributed by MLS Grid
- 2018-06-06 Listed $12,000 MARIS as Distributed by MLS Grid
- 1994-08-05 Sold (Public Records) — Public Records
Property tax history
+26.3%/yrLatest (2024): $288 · +4.6% YoY. Source: county tax records.
Cash-flow waterfall
monthlySold comps — $/sqft
last 12 mo · ≤1 miLoading sold comps…