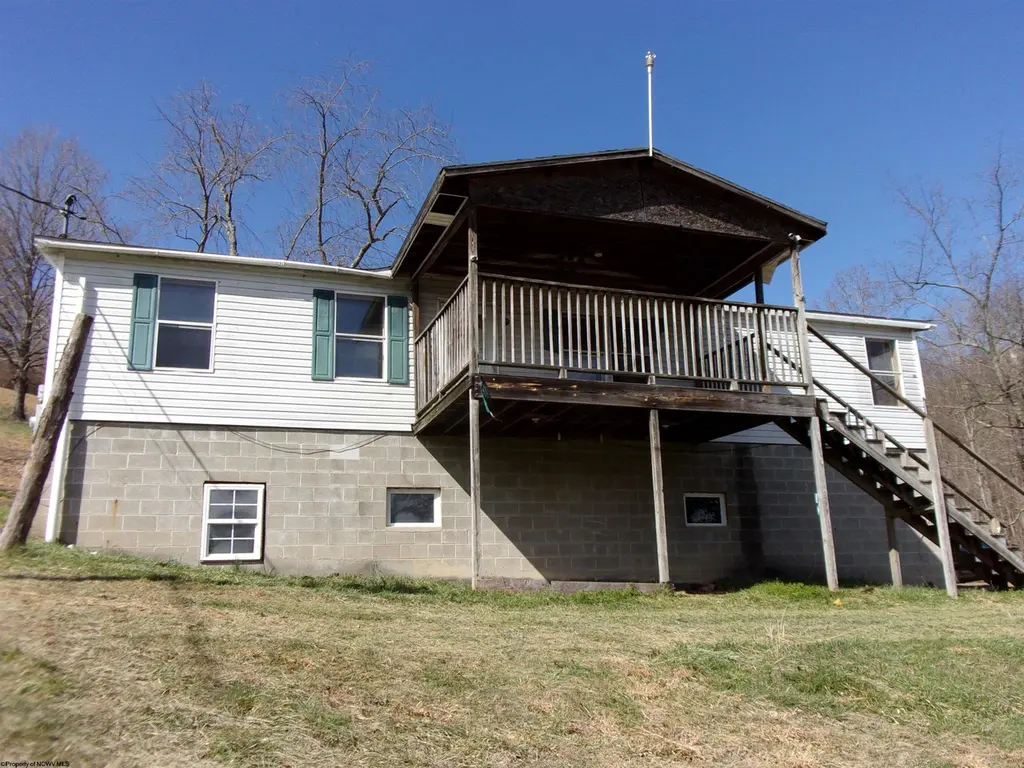
3436 Burns Farm Rd · Grafton, WV
Flood risk 1/10 · Minimal
- FEMA flood zone
- X (unshaded)
- Chance of flooding over 30 yrs
- 0.0%
- Est. flood insurance / yr
- $473 – $860
Fire risk 4/10 · Minor
- Est. fire insurance / yr
- $787 – $1,461
Heat risk 4/10 · Minor
- Hot days now (above 96°F)
- 7 days/yr
- Hot days in 30 yrs
- 20 days/yr
Wind risk 1/10 · Minimal
- Chance of severe wind over 30 yrs
- 0.0%
Air-quality risk 2/10 · Minimal
- Unhealthy air days now
- 1 days/yr
- Unhealthy air days in 30 yrs
- 1 days/yr
Risk factors via First Street. Map © Google.
Why this score? — see what drove the B grade
The composite is a weighted blend of 9 inputs, each scored 0–100. Each bar is that input's sub-score; the figure is the points it added to the 100-point composite (weight × sub-score).
- Cash flow +30.0/30.0
- DSCR +10.0/10.0
- 1% rule +8.6/10.0
- ARV discount +7.5/15.0
- Appreciation +5.7/10.0
- Livability +3.4/5.0
- Schools +2.7/10.0
- Rent growth +2.5/5.0
- Condition / age +2.5/5.0
$84,000
🖨 Deal sheet 📄 Offer letter ✓ Due diligence
Listing remarks
For Sale: View 21 photos for 3436 Burns Farm Rd, this 3-bed, 2-bath, sqft. single-detached home in Grafton, WV, listed at $94,000. MLS #10164141 * See Agent Remarks * * * For all Offers contact Listing Agent * *
Key facts
- Full basement
- Concrete floors
- Interior access
Tags
Property features AI
Exterior
- Parking: Off-street parking; On-street parking
- Utilities: Public water; Septic tank sewer; Cable available
- Home design: Single-family detached residence; One story
- Construction: Vinyl siding; Shingle roof; Built with concrete foundation
- Exterior features: Porch; Sloped lot
Interior
- Kitchen: Dishwasher; Refrigerator; Range
- Flooring: Vinyl flooring
- Bathrooms: 2 full bathrooms
- Heating & cooling: Electric heating
- Interior features: Dishwasher; Refrigerator; Range; Vinyl flooring; Concrete, unfinished basement
Neighborhood map
What this means for you Summary
Snapshot
- This is a 3-bed/2.0-bath manufactured listed at $84k.
Deal economics
- At list price, monthly cash flow is $381 ($5k/yr) — positive.
- The deal already cash-flows at list — no discount required.
- Meets the 1% rule at list price ($1k rent vs $84k).
- Recommended offer: $79k (6.0% below list) — sets the bar for market timing.
- Cap rate 11.7% vs local median 4.1% in Grafton — top-decile yield for the area; either an underpriced asset or a hidden risk that comps aren't pricing in. Stress-test before assuming the spread holds.
Location & tenants
- Location reads 68/100 on livability (#85 in WV) — a middle-class / working-renter tenant base. Strengths: crime A+, cost of living A+, housing A+; Watch: health & safety C-, amenities F, commute F.
- Taylor County Schools (town): math 27% / reading 36% proficiency, ranked #22 of 55 in WV (top 40%) — families likely to look elsewhere, expect single-tenant / working-renter base with shorter leases.
- Zoned schools: Anna Jarvis Elementary School (math 37% / reading 27%, grade F, #191 of 377 statewide, top 56%, 503 students, 0% FRL); Taylor County Middle School (math 22% / reading 34%, grade F, #66 of 109 statewide, top 63%, 685 students, 0% FRL); Grafton High School (math 17% / reading 47%, grade F, #55 of 110 statewide, top 59%, 620 students, 0% FRL) — zoned schools average 0% FRL vs 44% district-wide (44 pts lower); this property's tenant base skews higher-income than the district average.
- Market conditions: 29 active listings in the ZIP.
Forward outlook
- In year one you build about $2k of equity ($581 loan paydown + $1k appreciation (1.4% local appreciation)).
- Taylor County population projected to shrink 7% by 2050 — rents likely to lag national; underwrite the cash flow, not the appreciation.
- At projected returns (1.4% appreciation + 3.0% rent growth), your $24k cash investment doubles in ~4 years — after that, you're playing with house money.
Negotiation context
- It's been on market 72 days — a 6% lower offer ($79k) is reasonable based on typical stale-listing flexibility.
Questions for the listing agent
- It's been on market 72 days. Have you received any prior offers? Is the seller open to a 6% concession, seller financing, or rate buy-down credit?
- Why hasn't it sold? Are there any deal-killer items the seller is aware of (foundation, flood, title, zoning, code violations)?
- Is there a deadline driving the sale (1031 exchange, divorce, estate, relocation)? That informs how much negotiation room exists.
- Schools are F-rated, which usually means shorter tenancies and higher turnover. Who's the typical renter profile here, and what's been the actual vacancy rate?
- What's the average days-on-market for RENTAL listings here right now (not sales)? A rising rental-DOM trend means longer vacancies and softer asking-rent achievability than the comps imply.
- What's the recent tenant-quality profile in this submarket — average credit score on applications, eviction rate, late-payment / NSF rate, and stable-employment percentage? A property-management company in the area should have these aggregated.
- How much new for-sale + rental construction is in the pipeline within 1–3 miles? Heavy new supply typically softens prices + rents 12–24 months out; constrained supply supports both.
Investment metrics
- 1% rule
- 1.36% ✓
- Cap rate
- 11.74%
- Cash-on-cash
- 19.45%
- DSCR
- 1.87
- GRM
- 6.1
CMA / ARV
No comps found within radius.
Projected returns pro-forma
1.44% appreciation · 3.0% rent growth · sell at horizon
- IRR
- 22.5%
- Equity multiple
- 2.18×
- Total profit
- $27,655
- Equity at exit
- $30,609
- IRR
- 24.9%
- Equity multiple
- 4.12×
- Total profit
- $73,331
- Equity at exit
- $42,216
Cash invested: $23,520 (down + closing). Projections, not guarantees.
Landlord ↔ Tenant lean methodology
- Overall (STATE)
- 83 Strongly Landlord-Friendly
- State West Virginia
- 83 Strongly Landlord-Friendly · R+22
- County
- — inherits STATE
- City
- — inherits STATE
ZIP-level market 26354
- Home prices YoY
- 0.6%
- Active inventory
- 29
- Price-to-rent
- 6.1×
Monthly cashflow live
- Estimated rent
- $1,144 medium interval (Pro) →
- Mortgage (P&I)
- −$441
- Tax from tax record
- −$47 /mo · $564/yr
- Insurance
- −$35
- HOA
- −$0
- Vacancy / Maint / Mgmt
- −$240
- Net cashflow
- $381
Break-even live
UW: 25.0% down · 7.5% · 30yr · 1.5% tax · 5.0% vac · 8.0% maint · 8.0% mgmt
Financing live
Cash to close
- Down payment
- $21,000
- Closing costs
- $2,520
- Reserves months
- —
- Total cash needed
- —
Loan-product check · same deal, 3 products live
Conventional
25% down · 7.5% · 30yr
- Down + closing
- —
- Monthly P&I
- —
- Monthly cashflow
- —
- DSCR
- —
- Eligible?
- —
Personal DTI + credit; lowest rate.
DSCR
20% down · 8.5% · 30yr
- Down + closing
- —
- Monthly P&I
- —
- Monthly cashflow
- —
- DSCR
- —
- Eligible?
- —
No personal income docs; deal must DSCR.
Hard money
10% down · 12.0% · 12mo
- Down + closing
- —
- Monthly P&I
- —
- Monthly cashflow
- —
- DSCR
- —
- Eligible?
- —
Short-term bridge; refi at stabilization.
Listing history 18 events
-
2026-06-19days on market $84,000 Active 72 DOM
-
2026-06-18days on market $84,000 Active 71 DOM
-
2026-06-17days on market $84,000 Active 70 DOM
-
2026-06-16days on market $84,000 Active 69 DOM
-
2026-06-15days on market $84,000 Active 68 DOM
-
2026-06-14days on market $84,000 Active 66 DOM
-
2026-06-12pricedays on market $84,000 Active 65 DOM
-
2026-06-09days on market $89,000 Active 62 DOM
-
2026-06-08days on market $89,000 Active 61 DOM
-
2026-06-07days on market $89,000 Active 60 DOM
-
2026-06-05days on market $89,000 Active 57 DOM
-
2026-06-02days on market $89,000 Active 55 DOM
-
2026-06-01days on market $89,000 Active 54 DOM
-
2026-05-31days on market $89,000 Active 53 DOM
-
2026-05-30days on market $89,000 Active 52 DOM
-
2026-05-21price $89,000
-
2026-04-28price $94,000
-
2026-04-09$99,000 Active
ⓘ Source: listings_history table (triggers on properties + properties_extension) + one-shot
backfill from property_details.listing_events for pre-trigger history.
Tax reassessment forecast WV · Resets to sale price
- Current annual tax
- $564 · $47/mo
- Projected year-2 tax
- $564 · $47/mo
- Expected delta
- $0/yr ($0/mo · 0.0%)
ⓘ Screening estimate from a state-policy table — verify with the county assessor before closing.
Climate risk First Street
- Flood 1/10 Low FEMA zone X (unshaded) · 0% chance over 30 yrs
- Wildfire 4/10 Moderate
- Heat 4/10 Moderate 7 d/yr ≥96°F today · 20 d/yr by 30 yrs out
- Wind 1/10 Low 0% chance of damaging wind over 30 yrs
- Air quality 2/10 Low 1 unhealthy d/yr today · 1 by 30 yrs out
Nearby sold comps map
Loading sold comps map…
Walkable amenities ~0.75 mi
Loading nearby amenities…
Taxation est. · year 1
- Rental income
- $13,728
- − Mortgage interest
- −$4,705
- − Property taxes
- −$564
- − Insurance
- −$420
- − Repairs & maintenance
- −$1,098
- − Management
- −$1,098
- − Depreciation
- −$2,444
- Taxable income
- $3,399
- Est. tax owed @ 24.0%
- −$816
- After-tax cash flow
- $3,760/yr
For passive investors: Depreciation is non-cash, so a rental often shows a tax loss while cash-flowing — sheltering income. Rental losses are passive: they offset passive income freely, and up to $25,000/yr can offset ordinary (W-2) income if you actively participate and your MAGI is under $100k (phasing out to $0 by $150k); unused losses carry forward. On sale, claimed depreciation is recaptured at up to 25%, and gains may owe capital-gains tax (a 1031 exchange can defer both). Figures are a year-1 estimate at your 24.0% rate — not tax advice; consult a CPA.
Schools (NCES district)
- District
- Taylor County Schools
- NCES district ID
- 5401380
- Math proficiency
- 27% ▼ -14.00%
- Reading proficiency
- 36% ▼ -11.00%
- Median HH income
- $41,369
- Composite
- 26.59/100
- National rank
- #7183
- State rank
- #22 of 55 in WV
Livability — Grafton
- Score
- 68/100
- State rank
- #85
- US rank
- #9831
Category grades
Schools grade is shown separately in the Schools card above.
Census & demographics
- Population (ZIP)
- 10,101
Population outlook (Taylor County) Hauer SSP2
- Today (2025)
- 16,987 people
- By 2030
- 16,923 · -0.4%
- By 2040
- 16,523 · -2.7%
- By 2050
- 15,802 · -7.0%
- By 2075
- 13,768 · -18.9%
- By 2100
- 10,464 · -38.4%
Race, ethnicity, and origin ACS 2023
- Neighborhood character
- Predominantly White (96%)
- Race & ethnicity
- White 96% Two or more races 2% Hispanic / Latino 1%
- Common ancestry
- Slovak 5% Serbian 3% Iranian 2%
- Foreign-born
- 0%
Political lean MEDSL · Taylor
- 2024 margin
- Solid R (+51.3) · D 23.3% · R 74.6% · Other 2.0%
- 2008→2024 swing
- -32.9pp toward R · 2008: -18.4pp · 2024: -51.3pp
- All cycles
- 2024: R+51.3 2020: R+49.9 2016: R+49.5 2012: R+32.2 2008: R+18.4
Not yet ingested
- Civics
- —
Market trends
- HPI YoY
- ▲ 1.44%
- Current HPI
- 229.6924
- Rent YoY
- —
- Metro
- —
- State GDP YoY
- —
- F500 in state
- 0
Price history
-10.1% since first listed3 events — show timeline
- 2026-05-21 Price Changed $89,000 NCWVREIN
- 2026-04-28 Price Changed $94,000 NCWVREIN
- 2026-04-09 Listed $99,000 NCWVREIN
Property tax history
-2.7%/yrLatest (2025): $564 · -16.4% YoY. Source: county tax records.
Cash-flow waterfall
monthlySold comps — $/sqft
last 12 mo · ≤1 miLoading sold comps…