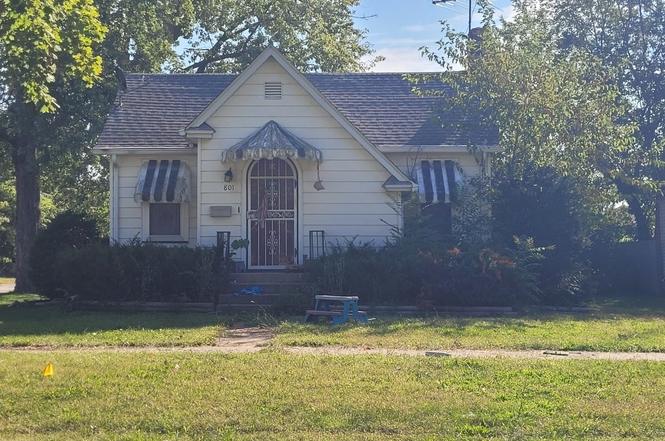
801 S Monroe St · Streator, IL
Flood risk 1/10 · Minimal
- FEMA flood zone
- X (unshaded)
- Chance of flooding over 30 yrs
- 0.0%
- Est. flood insurance / yr
- $473 – $860
Fire risk 1/10 · Minimal
- Est. fire insurance / yr
- $804 – $1,492
Heat risk 3/10 · Minor
- Hot days now (above 104°F)
- 7 days/yr
- Hot days in 30 yrs
- 17 days/yr
Wind risk 2/10 · Minimal
- Chance of severe wind over 30 yrs
- 1.0%
Air-quality risk 2/10 · Minimal
- Unhealthy air days now
- 1 days/yr
- Unhealthy air days in 30 yrs
- 1 days/yr
Risk factors via First Street. Map © Google.
Why this score? — see what drove the D grade
The composite is a weighted blend of 9 inputs, each scored 0–100. Each bar is that input's sub-score; the figure is the points it added to the 100-point composite (weight × sub-score).
- Cash flow +15.0/30.0
- ARV discount +7.5/15.0
- 1% rule +5.0/10.0
- DSCR +5.0/10.0
- Livability +3.2/5.0
- Rent growth +2.5/5.0
- Condition / age +2.5/5.0
- Schools +1.3/10.0
- Appreciation +0.0/10.0
$30,000
🖨 Deal sheet 📄 Offer letter ✓ Due diligence
Listing remarks
Bring your tool belt and your ideas! This property needs work, but the possibilities are endless. It's a great opportunity for anyone looking to invest, renovate, or create a home that reflects their own style
Key facts
- Garage
- Built 1910
- Listed 7 days
Neighborhood map
What this means for you Summary
Snapshot
- This is a 2-bed/1.0-bath single-family listed at $30k.
Deal economics
- At list price, monthly cash flow is $857 ($10k/yr) — positive.
- The deal already cash-flows at list — no discount required.
- Meets the 1% rule at list price ($1k rent vs $30k).
- Cap rate 40.6% vs local median 7.8% in Streator — top-decile yield for the area; either an underpriced asset or a hidden risk that comps aren't pricing in. Stress-test before assuming the spread holds.
Location & tenants
- Location reads 63/100 on livability (#752 in IL) — a middle-class / working-renter tenant base. Strengths: cost of living A+, health & safety A+, housing B+; Watch: schools F, amenities F, commute F.
- Streator Twp Hsd 40 (town): math 11% / reading 19% proficiency, ranked #513 of 620 in IL (top 83%) — low school quality limits family demand, transient renter base, plan for 1-2y turnover.
- Market conditions: 87 active listings in the ZIP; 10 comparable units currently listed for rent nearby; rentals at typical pace (median 25d on market — plan ~3-4 weeks tenant-placement turnaround); 82 units permitted in LaSalle County in 2024 (0 in 5+ unit buildings).
Forward outlook
- Local home prices are declining (-3.0%/yr); year-one equity from $207 of loan paydown is wiped out by about $900 of value loss. Plan a longer hold.
- LaSalle County population projected at -16% by 2050 — secular population decline; favor cash flow + early exit over multi-decade hold.
- At projected returns (-3.0% appreciation + 3.0% rent growth), your $8k cash investment doubles in ~1 year — after that, you're playing with house money.
Negotiation context
- Only 7 days on market — expect competitive offers; lowballing is unlikely to land.
- 3 sale attempts since 11y ago with the ask held roughly flat each time — persistent listings suggest the price (not the market) is what's stuck; bring a comps-based counter.
Risks & watch-outs
- Watch-outs: built in 1910 — expect roof / HVAC / electrical / plumbing capex.
Questions for the listing agent
- Built in 1910 — when were the roof, HVAC, electrical panel, plumbing, and water heater last replaced?
- Is there a deadline driving the sale (1031 exchange, divorce, estate, relocation)? That informs how much negotiation room exists.
- Schools are F-rated, which usually means shorter tenancies and higher turnover. Who's the typical renter profile here, and what's been the actual vacancy rate?
- The area grade is low — what's the realistic commute time and amenity access for the typical tenant pool here? Any planned neighborhood developments (good or bad) we should know about?
- What's the average days-on-market for RENTAL listings here right now (not sales)? A rising rental-DOM trend means longer vacancies and softer asking-rent achievability than the comps imply.
- What's the recent tenant-quality profile in this submarket — average credit score on applications, eviction rate, late-payment / NSF rate, and stable-employment percentage? A property-management company in the area should have these aggregated.
- How much new for-sale + rental construction is in the pipeline within 1–3 miles? Heavy new supply typically softens prices + rents 12–24 months out; constrained supply supports both.
Investment metrics
- 1% rule
- 4.49% ✓
- Cap rate
- 40.56%
- Cash-on-cash
- 122.38%
- DSCR
- 6.45
- GRM
- 1.9
CMA / ARV
- ARV (on-the-fly)
- $138,288
- Comps found
- 12
Show comp detail 12 sales within ~0.75 mi
| Address | Dist | Beds/Ba | Sqft | Sold | Price | $/sf | Match |
|---|---|---|---|---|---|---|---|
| 717 S Monroe St | 0.03mi | 2/1.0 | 960 (-7%) | 7mo | $125,000 | $130 | 81 |
| 907 S Bloomington St | 0.19mi | 2/1.0 | 970 (-6%) | 4mo | $26,500 | $27 | 78 |
| 709 S Park St | 0.11mi | 3/2.0 (+1) | 1,086 (+5%) | 1mo | $205,000 | $189 | 76 |
| 910 S Vermillion St | 0.13mi | 2/1.0 | 919 (-11%) | 1mo | $215,000 | $234 | 75 |
| 907 S Park St | 0.13mi | 3/1.0 (+1) | 1,120 (+8%) | 1mo | $150,000 | $134 | 74 |
| 218 W 10th St | 0.41mi | 3/1.5 (+1) | 1,000 (-3%) | 3mo | $157,500 | $158 | 66 |
| 1206 S Park St | 0.31mi | 3/1.5 (+1) | 952 (-8%) | 1mo | $132,000 | $139 | 65 |
| 609 S Monroe St | 0.17mi | 3/2.0 (+1) | 918 (-11%) | 1mo | $80,000 | $87 | 64 |
| 124 S Everett St | 0.66mi | 2/1.0 | 1,075 (+4%) | 6mo | $142,000 | $132 | 57 |
| 912 Charles St | 0.52mi | 3/2.0 (+1) | 1,134 (+10%) | 2mo | $141,000 | $124 | 48 |
| 1609 S Bloomington St | 0.71mi | 2/1.0 | 1,140 (+10%) | 7mo | $160,000 | $140 | 44 |
| 408 Powell St | 0.70mi | 2/1.0 | 900 (-13%) | 5mo | $89,900 | $100 | 42 |
Match score weights: distance 35% · size 25% · config 20% · recency 20%. Top-matched comps best support the ARV.
Projected returns pro-forma
-3.0% appreciation · 3.0% rent growth · sell at horizon
- IRR
- —
- Equity multiple
- 6.92×
- Total profit
- $49,719
- Equity at exit
- $4,473
- IRR
- —
- Equity multiple
- 14.53×
- Total profit
- $113,632
- Equity at exit
- $2,594
Cash invested: $8,400 (down + closing). Projections, not guarantees.
Landlord ↔ Tenant lean methodology
- Overall (STATE)
- 43 Moderately Tenant-Leaning
- State Illinois
- 43 Moderately Tenant-Leaning · D+7
- County
- — inherits STATE
- City
- — inherits STATE
ZIP-level market 61364
- Home prices YoY
- -31.1%
- Active inventory
- 87
- Price-to-rent
- 1.9×
Monthly cashflow live
- Estimated rent
- $1,347 high interval (Pro) →
- Mortgage (P&I)
- −$157
- Tax est. 1.5%
- −$38 /mo · $450/yr
- Insurance
- −$12
- HOA
- −$0
- Vacancy / Maint / Mgmt
- −$283
- Net cashflow
- $857
Break-even live
UW: 25.0% down · 7.5% · 30yr · 1.5% tax · 5.0% vac · 8.0% maint · 8.0% mgmt
Financing live
Cash to close
- Down payment
- $7,500
- Closing costs
- $900
- Reserves months
- —
- Total cash needed
- —
Loan-product check · same deal, 3 products live
Conventional
25% down · 7.5% · 30yr
- Down + closing
- —
- Monthly P&I
- —
- Monthly cashflow
- —
- DSCR
- —
- Eligible?
- —
Personal DTI + credit; lowest rate.
DSCR
20% down · 8.5% · 30yr
- Down + closing
- —
- Monthly P&I
- —
- Monthly cashflow
- —
- DSCR
- —
- Eligible?
- —
No personal income docs; deal must DSCR.
Hard money
10% down · 12.0% · 12mo
- Down + closing
- —
- Monthly P&I
- —
- Monthly cashflow
- —
- DSCR
- —
- Eligible?
- —
Short-term bridge; refi at stabilization.
Rent comps 10 comps
| Address | Beds | Baths | Sqft | Rent | $/sqft | DOM | Units | Dist |
|---|---|---|---|---|---|---|---|---|
| 503 S Bloomington St Streator, IL | 3.0 | 1.0 | 1200 | $1,500 | $1.25 | 24d | 1 | 0.32mi |
| 514 Lundy St Streator, IL | 3.0 | 1.0 | 1174 | $1,700 | $1.45 | 3d | 1 | 0.36mi |
| 402 S Illinois St Streator, IL | 2.0 | 1.0 | 1116 | $1,550 | $1.39 | 22d | 1 | 0.53mi |
| 1802 S Church St Streator, IL | 2.0 | 1.0 | 840 | $1,200 | $1.43 | 43d | 1 | 0.94mi |
| 303 Carriage Lane Ests Unit 303 Streator, IL | 3.0 | 2.0 | 924 | $1,188 | $1.29 | 24d | 1 | 1.10mi |
| 124 Carriage Lane Ests Streator, IL | 3.0 | 2.0 | 924 | $1,127 | $1.22 | 18d | 1 | 1.11mi |
| 124 Carriage Lane Ests Unit 124 Streator, IL | 3.0 | 2.0 | 924 | $1,127 | $1.22 | 17d | 1 | 1.11mi |
| 306 Carriage Lane Ests Unit 306 Streator, IL | 3.0 | 1.0 | 980 | $1,088 | $1.11 | 24d | 1 | 1.13mi |
| 410 Carriage Lane Ests #410 Streator, IL | 3.0 | 2.0 | 960 | $1,278 | $1.33 | 24d | 1 | 1.14mi |
| 614 Carriage Lane Ests Unit 614 Streator, IL | 2.0 | 1.0 | 768 | $1,127 | $1.47 | 43d | 1 | 1.19mi |
Listing history 10 events
-
2025-09-15status Pending
-
2025-09-08$30,000 Active
-
2016-09-13historical
-
2016-02-24price
-
2015-09-15New
-
2015-09-11historical
-
2015-05-31price
-
2015-05-11New
-
1996-08-20soldstatus $45,500
-
1991-01-25soldstatus $39,000
ⓘ Source: listings_history table (triggers on properties + properties_extension) + one-shot
backfill from property_details.listing_events for pre-trigger history.
Climate risk First Street
- Flood 1/10 Low FEMA zone X (unshaded) · 0% chance over 30 yrs
- Wildfire 1/10 Low
- Heat 3/10 Moderate 7 d/yr ≥104°F today · 17 d/yr by 30 yrs out
- Wind 2/10 Low 100% chance of damaging wind over 30 yrs
- Air quality 2/10 Low 1 unhealthy d/yr today · 1 by 30 yrs out
Nearby sold comps map
Loading sold comps map…
Walkable amenities ~0.75 mi
Loading nearby amenities…
Taxation est. · year 1
- Rental income
- $16,161
- − Mortgage interest
- −$1,680
- − Property taxes
- −$450
- − Insurance
- −$150
- − Repairs & maintenance
- −$1,293
- − Management
- −$1,293
- − Depreciation
- −$873
- Taxable income
- $10,422
- Est. tax owed @ 24.0%
- −$2,501
- After-tax cash flow
- $7,778/yr
For passive investors: Depreciation is non-cash, so a rental often shows a tax loss while cash-flowing — sheltering income. Rental losses are passive: they offset passive income freely, and up to $25,000/yr can offset ordinary (W-2) income if you actively participate and your MAGI is under $100k (phasing out to $0 by $150k); unused losses carry forward. On sale, claimed depreciation is recaptured at up to 25%, and gains may owe capital-gains tax (a 1031 exchange can defer both). Figures are a year-1 estimate at your 24.0% rate — not tax advice; consult a CPA.
Schools (NCES district)
- District
- Streator Twp Hsd 40
- NCES district ID
- 1738100
- Math proficiency
- 11% ▼ -4.00%
- Reading proficiency
- 19% ▼ -1.00%
- Median HH income
- $43,002
- Composite
- 13.07/100
- National rank
- #9561
- State rank
- #513 of 620 in IL
Livability — Streator
- Score
- 63/100
- State rank
- #752
- US rank
- #15266
Category grades
Schools grade is shown separately in the Schools card above.
Census & demographics
- Census place
- Streator, IL
- County
- La Salle County · 41,676 people
- City population
- 17,963
- Metro
- Ottawa, IL
- Population (ZIP)
- 17,963
- Household income
- $59,060
- Rent vs Own
- Severe rent burden
- 450.0
Population outlook (LaSalle County) Hauer SSP2
- Today (2025)
- 107,080 people
- By 2030
- 104,196 · -2.7%
- By 2040
- 97,413 · -9.0%
- By 2050
- 90,294 · -15.7%
- By 2075
- 76,252 · -28.8%
- By 2100
- 61,339 · -42.7%
Race, ethnicity, and origin ACS 2023
- Neighborhood character
- Predominantly White (83%)
- Race & ethnicity
- White 83% Hispanic / Latino 11% Two or more races 4% Black 3%
- Hispanic origin (detail)
- Mexican 10%
- Common ancestry
- Romanian 3% Lithuanian 2% Slovak 2%
- Foreign-born
- 3% · Canada
- Languages at home
- 93% English-only · Spanish 6%
Political lean MEDSL · LaSalle
- 2024 margin
- R (+18.5) · D 40.1% · R 58.6% · Other 1.3%
- 2008→2024 swing
- -29.6pp toward R · 2008: 11.1pp · 2024: -18.5pp
- All cycles
- 2024: R+18.5 2020: R+14.3 2016: R+14.4 2012: R+0.4 2008: D+11.1
Not yet ingested
- Civics
- —
Market trends
- HPI YoY
- ▼ -105.28%
- Current HPI
- 233.5533
- Rent YoY
- —
- Metro
- Ottawa, IL
- State GDP YoY
- ▲ 1.59%
- F500 in state
- 60
Industry mix (Fortune 500 HQ in IL)
| Industry | F500 HQs | Revenue |
|---|---|---|
| Insurance | 4 | $201B |
|
||
| Consumer Goods | 4 | $87B |
|
||
| Industrial Machinery | 3 | $64B |
|
||
| Healthcare | 2 | $55B |
|
||
| Retail / Pharmacy | 1 | $148B |
|
||
| Agriculture / Food | 1 | $86B |
|
||
Price history
-23.1% since first listed10 events — show timeline
- 2025-09-15 Pending — MRED as Distributed by MLS Grid
- 2025-09-08 Listed $30,000 MRED as Distributed by MLS Grid
- 2016-09-13 Listing Removed — MRED as Distributed by MLS Grid
- 2016-02-24 Price Changed — MRED as Distributed by MLS Grid
- 2015-09-15 Listed — MRED as Distributed by MLS Grid
- 2015-09-11 Listing Removed — MRED as Distributed by MLS Grid
- 2015-05-31 Price Changed — MRED as Distributed by MLS Grid
- 2015-05-11 Listed — MRED as Distributed by MLS Grid
- 1996-08-20 Sold (Public Records) $45,500 Public Records
- 1991-01-25 Sold (Public Records) $39,000 Public Records
Property tax history
+12.1%/yrLatest (2024): $2,965 · +8.1% YoY. Source: county tax records.
Cash-flow waterfall
monthlySold comps — $/sqft
last 12 mo · ≤1 miLoading sold comps…