1071 Clubhouse Dr · Independence, KY
Flood risk 1/10 · Minimal
- FEMA flood zone
- X (unshaded)
- Chance of flooding over 30 yrs
- 0.0%
- Est. flood insurance / yr
- $507 – $1,088
Fire risk 1/10 · Minimal
- Est. fire insurance / yr
- $839 – $1,559
Heat risk 4/10 · Minor
- Hot days now (above 102°F)
- 7 days/yr
- Hot days in 30 yrs
- 19 days/yr
Wind risk 2/10 · Minimal
- Chance of severe wind over 30 yrs
- 1.0%
Air-quality risk 2/10 · Minimal
- Unhealthy air days now
- 1 days/yr
- Unhealthy air days in 30 yrs
- 3 days/yr
Risk factors via First Street. Map © Google.
Why this score? — see what drove the F grade
The composite is a weighted blend of 9 inputs, each scored 0–100. Each bar is that input's sub-score; the figure is the points it added to the 100-point composite (weight × sub-score).
- Cash flow +9.8/30.0
- Schools +4.0/10.0
- Rent growth +3.8/5.0
- Livability +3.6/5.0
- DSCR +2.8/10.0
- Condition / age +2.5/5.0
- 1% rule +2.2/10.0
- ARV discount +0.9/15.0
- Appreciation +0.0/10.0
$294,000
🖨 Deal sheet 📄 Offer letter ✓ Due diligence
Listing remarks MLS
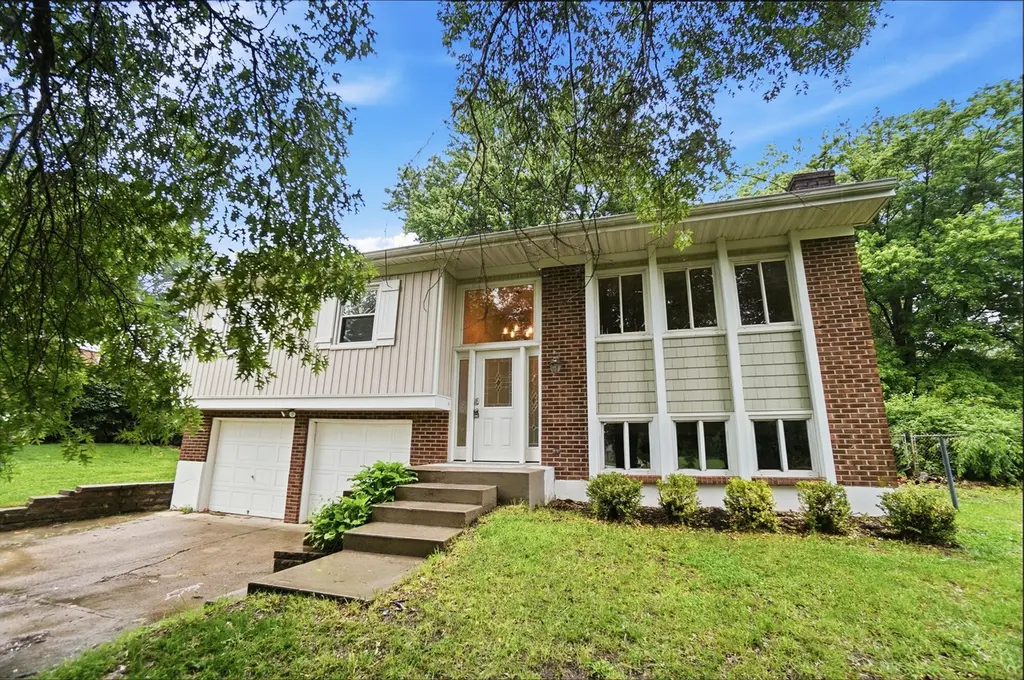
Beautiful home in a quiet neighborhood! Open & airy floor plan in this completely updated & meticulously cared for home. Over sized 2 car garage with a ton of driveway space. New flooring & paint throughout. Kitchen updated in '17 featuring soft close cabinets & stainless steel appliances. Walkout from dining room to expansive covered deck & patio area. Flat fenced back yard with mature trees. Front entry completely updated in '17 along with front steps. New front siding in '17. New roof in '19 with 15 yr transferable warranty. One year home warranty included. Book your private showing today!
Key facts
- Soft-close cabinets
- Remodeled kitchen
- Flat fenced backyard
Tags
Property features AI
Exterior
- Parking: Attached garage; Driveway; Garage faces front; 2 garage spaces
- Utilities: Public water; Public sewer; Natural gas available
- Home design: Bi-level house; Single-family residence; Built in 1988
- Construction: Brick and vinyl siding exterior; Shingle roof; Poured concrete foundation
- Exterior features: Covered patio/porch; Deck; Patio; Chain link fencing
Interior
- Kitchen: Stainless steel appliances; Electric range; Dishwasher; Microwave; Refrigerator
- Bedrooms: Primary bedroom (11 x 11); Bedroom 2 (11 x 10); Bedroom 3 (10 x 10)
- Bathrooms: 2 full bathrooms
- Heating & cooling: Forced-air heating; Central air conditioning
- Interior features: Storage; Chandelier; Built-in bookcases; Brick fireplace (inoperable)
- Laundry & utility: Laundry room on lower level
Neighborhood map
What this means for you Summary
Snapshot
- This is a 3-bed/2.0-bath single-family listed at $294k.
Deal economics
- At list price, monthly cash flow is $-188 ($-2k/yr) — negative.
- To cash-flow at today's rent, offer at most $261k (11.3% below list).
- To meet the 1% rule (rent ≥ 1% of price), the offer needs to be $212k (27.7% below list).
- Recommended offer: $212k (27.7% below list) — sets the bar for 1% rule.
- Cap rate 5.5% vs local median 3.7% in Independence — top-decile yield for the area; either an underpriced asset or a hidden risk that comps aren't pricing in. Stress-test before assuming the spread holds.
Location & tenants
- Location reads 72/100 on livability (#130 in KY) — a middle-class / working-renter tenant base. Strengths: crime A+, employment A+, cost of living A+; Watch: amenities F, commute F, health & safety F.
- Kenton County (suburban): math 42% / reading 48% proficiency, ranked #14 of 165 in KY (top 8%) — families likely to look elsewhere, expect single-tenant / working-renter base with shorter leases.
- Zoned schools: Beechgrove Elementary School (math 41% / reading 42%, grade F, #197 of 676 statewide, top 29%, 660 students, 61% FRL); Woodland Middle School (math 38% / reading 50%, grade D, #40 of 217 statewide, top 19%, 616 students, 48% FRL); Simon Kenton High School (math 40% / reading 44%, grade F, #32 of 254 statewide, top 13%, 1,859 students, 37% FRL) — zoned schools average 49% FRL vs 33% district-wide (15 pts higher); higher-poverty schools than district average — tighter screening recommended.
- Market conditions: Rents rising fast (+5.4%/yr); 253 active listings in the ZIP; 4 comparable units currently listed for rent nearby; rentals at typical pace (median 24d on market — plan ~3-4 weeks tenant-placement turnaround); solid renter incomes; 699 units permitted in Kenton County in 2024 (287 in 5+ unit buildings).
Forward outlook
- Local home prices are declining (-3.0%/yr); year-one equity from $2k of loan paydown is wiped out by about $9k of value loss. Plan a longer hold.
- Kenton County population projected at +5% by 2050 — modest demand growth; plan on rents tracking national, not racing it.
Negotiation context
- Only 11 days on market — expect competitive offers; lowballing is unlikely to land.
- 5 sale attempts since 18y ago with the ask held roughly flat each time — persistent listings suggest the price (not the market) is what's stuck; bring a comps-based counter.
Questions for the listing agent
- What do current leases actually rent for vs. the listed asking? Can we see a recent rent roll and the last 12 months of T-12 income?
- Is there a deadline driving the sale (1031 exchange, divorce, estate, relocation)? That informs how much negotiation room exists.
- Schools are B-rated — typically a magnet for longer-tenancy family renters. What's the average tenant stay here, and is there a school-zone premium baked into asking?
- The area grade is low — what's the realistic commute time and amenity access for the typical tenant pool here? Any planned neighborhood developments (good or bad) we should know about?
- What's the average days-on-market for RENTAL listings here right now (not sales)? A rising rental-DOM trend means longer vacancies and softer asking-rent achievability than the comps imply.
- What's the recent tenant-quality profile in this submarket — average credit score on applications, eviction rate, late-payment / NSF rate, and stable-employment percentage? A property-management company in the area should have these aggregated.
- How much new for-sale + rental construction is in the pipeline within 1–3 miles? Heavy new supply typically softens prices + rents 12–24 months out; constrained supply supports both.
Investment metrics
- 1% rule
- 0.72% ✗
- Cap rate
- 5.53%
- Cash-on-cash
- -2.74%
- DSCR
- 0.88
- GRM
- 11.5
CMA / ARV
- ARV (on-the-fly)
- $256,608
- Comps found
- 12
Show comp detail 12 sales within ~0.75 mi
| Address | Dist | Beds/Ba | Sqft | Sold | Price | $/sf | Match |
|---|---|---|---|---|---|---|---|
| 4070 Kimberly Dr | 0.35mi | 3/1.0 | 1,080 (+2%) | 10mo | $235,000 | $218 | 68 |
| 4270 Catalpa Dr | 0.51mi | 3/2.0 | 1,050 (-1%) | 10mo | $265,000 | $252 | 67 |
| 1135 Chestnut Ct | 0.59mi | 3/2.5 | 989 (-6%) | 1mo | $233,000 | $236 | 59 |
| 1052 Alpine Ct | 0.55mi | 3/1.5 | 972 (-8%) | 1mo | $232,000 | $239 | 59 |
| 1079 Birch Tree Ln | 0.41mi | 3/1.0 | 980 (-7%) | 7mo | $238,000 | $243 | 59 |
| 4079 Elizabeth Dr | 0.31mi | 3/2.5 | 1,180 (+12%) | 8mo | $299,000 | $253 | 58 |
| 3903 Hunters Green Dr | 0.66mi | 3/1.5 | 995 (-6%) | 4mo | $255,000 | $256 | 54 |
| 4257 Ashgrove Ct | 0.51mi | 3/1.5 | 972 (-8%) | 10mo | $172,000 | $177 | 53 |
| 4258 Berrywood Dr #1 | 0.64mi | 2/1.0 (-1) | 1,000 (-5%) | 4mo | $158,000 | $158 | 49 |
| 1170 Tyler Ct | 0.67mi | 3/2.5 | 1,182 (+12%) | 0mo | $295,000 | $250 | 46 |
| 4252 Catalpa Dr | 0.51mi | 3/1.5 | 918 (-13%) | 10mo | $270,000 | $294 | 44 |
| 2000 Woodcrest Dr | 0.52mi | 4/2.0 (+1) | 1,202 (+14%) | 10mo | $251,000 | $209 | 39 |
Match score weights: distance 35% · size 25% · config 20% · recency 20%. Top-matched comps best support the ARV.
Projected returns pro-forma
-3.0% appreciation · 5.37% rent growth · sell at horizon
- IRR
- -18.5%
- Equity multiple
- 0.34×
- Total profit
- $-54,502
- Equity at exit
- $43,836
- IRR
- -7.1%
- Equity multiple
- 0.50×
- Total profit
- $-40,828
- Equity at exit
- $25,420
Cash invested: $82,320 (down + closing). Projections, not guarantees.
Landlord ↔ Tenant lean methodology
- Overall (STATE)
- 83 Strongly Landlord-Friendly
- State Kentucky
- 83 Strongly Landlord-Friendly · R+16
- County
- — inherits STATE
- City
- — inherits STATE
ZIP-level market 41051
- Home prices YoY
- -32.6%
- Rents YoY
- 5.4%
- Active inventory
- 253
- Price-to-rent
- 11.5×
Monthly cashflow live
- Estimated rent
- $2,124 medium interval (Pro) →
- Mortgage (P&I)
- −$1,542
- Tax from tax record
- −$202 /mo · $2,424/yr
- Insurance
- −$122
- HOA
- −$0
- Vacancy / Maint / Mgmt
- −$446
- Net cashflow
- $-188
Break-even live
UW: 25.0% down · 7.5% · 30yr · 1.5% tax · 5.0% vac · 8.0% maint · 8.0% mgmt
Financing live
Cash to close
- Down payment
- $73,500
- Closing costs
- $8,820
- Reserves months
- —
- Total cash needed
- —
Loan-product check · same deal, 3 products live
Conventional
25% down · 7.5% · 30yr
- Down + closing
- —
- Monthly P&I
- —
- Monthly cashflow
- —
- DSCR
- —
- Eligible?
- —
Personal DTI + credit; lowest rate.
DSCR
20% down · 8.5% · 30yr
- Down + closing
- —
- Monthly P&I
- —
- Monthly cashflow
- —
- DSCR
- —
- Eligible?
- —
No personal income docs; deal must DSCR.
Hard money
10% down · 12.0% · 12mo
- Down + closing
- —
- Monthly P&I
- —
- Monthly cashflow
- —
- DSCR
- —
- Eligible?
- —
Short-term bridge; refi at stabilization.
Rent comps 4 comps
| Address | Beds | Baths | Sqft | Rent | $/sqft | DOM | Units | Dist |
|---|---|---|---|---|---|---|---|---|
| 9552 Apple Valley Dr Independence, KY | 2.0 | 2.0 | 1100 | $1,456 | $1.32 | 1d | 6 | 0.24mi |
| 3924 Trappers Ct Florence, KY | 3.0 | 1.5 | 1384 | $2,380 | $1.72 | 43d | 1 | 0.38mi |
| 1047 Alpine Ct Independence, KY | 3.0 | 2.0 | 1035 | $2,400 | $2.32 | 23d | 1 | 0.57mi |
| 3000 Stoneybrook Ln Elsmere, KY | 1.0–2.0 | 1.0–2.0 | 989 | $1,660 | $1.68 | 4d | 17 | 1.25mi |
Listing history 21 events
-
2026-06-18days on market $294,000 Active 11 DOM
-
2026-06-17days on market $294,000 Active 10 DOM
-
2026-06-16days on market $294,000 Active 9 DOM
-
2026-06-15days on market $294,000 Active 8 DOM
-
2026-06-13statusdays on market $294,000 Active 6 DOM
-
2026-06-02status $294,000 Pending 5 DOM
-
2026-06-01days on market $294,000 Active 5 DOM
-
2026-05-31days on market $294,000 Active 4 DOM
-
2026-05-27$294,000 Active
-
2026-04-21soldstatus $280,100
-
2020-02-24soldstatus $184,000
-
2020-01-22$184,000
-
2019-05-06soldstatus $175,000
-
2019-04-29soldstatus $175,000 619-char remark
Show marketing remark (619 chars)
Beautiful home in a quiet neighborhood! Open & airy floor plan in this completely updated & meticulously cared for home. Over sized 2 car garage with a ton of driveway space. New flooring & paint throughout. Kitchen updated in '17 featuring soft close cabinets & stainless steel appliances. Walkout from dining room to expansive covered deck & patio area. Flat fenced back yard with mature trees. Front entry completely updated in '17 along with front steps. New front siding in '17. New roof in '19 with 15 yr transferable warranty. One year home warranty included. Book your private showing today!
-
2019-03-28$175,000 619-char remark
Show marketing remark (619 chars)
Beautiful home in a quiet neighborhood! Open & airy floor plan in this completely updated & meticulously cared for home. Over sized 2 car garage with a ton of driveway space. New flooring & paint throughout. Kitchen updated in '17 featuring soft close cabinets & stainless steel appliances. Walkout from dining room to expansive covered deck & patio area. Flat fenced back yard with mature trees. Front entry completely updated in '17 along with front steps. New front siding in '17. New roof in '19 with 15 yr transferable warranty. One year home warranty included. Book your private showing today!
-
2017-03-01soldstatus $149,500
-
2017-02-28soldstatus $149,500
-
2016-11-10$155,000
-
2008-12-08historical
-
2008-06-08$139,900
-
1992-04-28soldstatus $79,000
ⓘ Source: listings_history table (triggers on properties + properties_extension) + one-shot
backfill from property_details.listing_events for pre-trigger history.
Tax reassessment forecast KY · Resets to sale price
- Current annual tax
- $2,424 · $202/mo
- Projected year-2 tax
- $2,528 · $211/mo
- Expected delta
- +$105/yr (+$9/mo · 4.3%)
ⓘ Screening estimate from a state-policy table — verify with the county assessor before closing.
Climate risk First Street
- Flood 1/10 Low FEMA zone X (unshaded) · 0% chance over 30 yrs
- Wildfire 1/10 Low
- Heat 4/10 Moderate 7 d/yr ≥102°F today · 19 d/yr by 30 yrs out
- Wind 2/10 Low 100% chance of damaging wind over 30 yrs
- Air quality 2/10 Low 1 unhealthy d/yr today · 3 by 30 yrs out
Nearby sold comps map
Loading sold comps map…
Walkable amenities ~0.75 mi
Loading nearby amenities…
Taxation est. · year 1
- Rental income
- $25,491
- − Mortgage interest
- −$16,469
- − Property taxes
- −$2,424
- − Insurance
- −$1,470
- − Repairs & maintenance
- −$2,039
- − Management
- −$2,039
- − Depreciation
- −$8,553
- Taxable loss
- −$7,502
- Est. tax savings @ 24.0%
- +$1,800
- After-tax cash flow
- $-456/yr
For passive investors: Depreciation is non-cash, so a rental often shows a tax loss while cash-flowing — sheltering income. Rental losses are passive: they offset passive income freely, and up to $25,000/yr can offset ordinary (W-2) income if you actively participate and your MAGI is under $100k (phasing out to $0 by $150k); unused losses carry forward. On sale, claimed depreciation is recaptured at up to 25%, and gains may owe capital-gains tax (a 1031 exchange can defer both). Figures are a year-1 estimate at your 24.0% rate — not tax advice; consult a CPA.
Schools (NCES district)
- District
- Kenton County
- NCES district ID
- 2103090
- Math proficiency
- 42% ▼ -13.00%
- Reading proficiency
- 48% ▼ -14.00%
- Median HH income
- $66,183
- Composite
- 40.17/100
- National rank
- #3789
- State rank
- #14 of 165 in KY
Livability — Independence
- Score
- 72/100
- State rank
- #130
- US rank
- #6165
Category grades
Schools grade is shown separately in the Schools card above.
Census & demographics
- Census place
- Independence, KY
- County
- Kenton County · 142,881 people
- City population
- 33,054
- Metro
- Cincinnati, OH-KY-IN
- Population (ZIP)
- 33,054
- Household income
- $104,201
- Rent vs Own
- Severe rent burden
- 243.0
Population outlook (Kenton County) Hauer SSP2
- Today (2025)
- 174,205 people
- By 2030
- 177,897 · +2.1%
- By 2040
- 182,671 · +4.9%
- By 2050
- 183,543 · +5.4%
- By 2075
- 178,977 · +2.7%
- By 2100
- 159,920 · -8.2%
Race, ethnicity, and origin ACS 2023
- Neighborhood character
- Predominantly White (93%)
- Race & ethnicity
- White 93% Two or more races 3% Hispanic / Latino 2% Black 1% Asian 1%
- Common ancestry
- Italian 3% Lithuanian 3% Slovak 2%
- Foreign-born
- 3% · China, Canada
- Languages at home
- 96% English-only · Spanish 1% Chinese 1% Other Asian/Pacific 1%
Political lean MEDSL · Kenton
- 2024 margin
- Strong R (+21.7) · D 38.2% · R 59.9% · Other 1.9%
- 2008→2024 swing
- -0.9pp no change · 2008: -20.9pp · 2024: -21.7pp
- All cycles
- 2024: R+21.7 2020: R+19.3 2016: R+26.1 2012: R+24.3 2008: R+20.9
Not yet ingested
- Civics
- —
Market trends
- HPI YoY
- ▼ -105.60%
- Current HPI
- 218.492
- Rent YoY
- ▲ 5.37%
- Metro
- Cincinnati, OH-KY-IN
- State GDP YoY
- ▲ 1.81%
- F500 in state
- 4
Industry mix (Fortune 500 HQ in KY)
| Industry | F500 HQs | Revenue |
|---|---|---|
| Healthcare | 1 | $118B |
|
||
| Food / Beverage | 1 | $7B |
|
||
Price history
+272.2% since first listed13 events — show timeline
- 2026-05-27 Listed $294,000 NKMLS
- 2026-04-21 Sold (Public Records) $280,100 Public Records
- 2020-02-24 Sold (MLS) $184,000 NKMLS
- 2020-01-22 Listed $184,000 NKMLS
- 2019-05-06 Sold (Public Records) $175,000 Public Records
- 2019-04-29 Sold (MLS) $175,000 NKMLS
- 2019-03-28 Listed $175,000 NKMLS
- 2017-03-01 Sold (Public Records) $149,500 Public Records
- 2017-02-28 Sold (MLS) $149,500 NKMLS
- 2016-11-10 Listed $155,000 NKMLS
- 2008-12-08 Listing Removed — NKMLS
- 2008-06-08 Listed $139,900 NKMLS
- 1992-04-28 Sold (Public Records) $79,000 Public Records
Property tax history
+4.0%/yrLatest (2025): $2,424 · +6.3% YoY. Source: county tax records.
Cash-flow waterfall
monthlySold comps — $/sqft
last 12 mo · ≤1 miLoading sold comps…