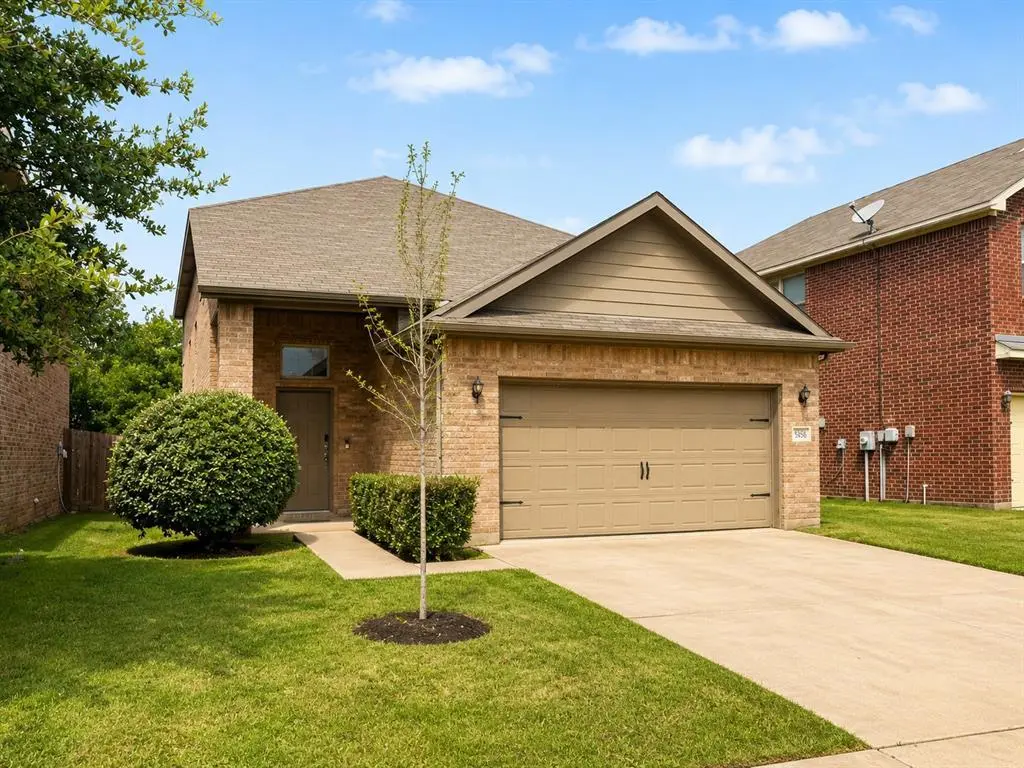
5548 Thunder Bay Dr · Fort Worth, TX
Flood risk 1/10 · Minimal
- FEMA flood zone
- X (shaded)
- Chance of flooding over 30 yrs
- 0.0%
- Est. flood insurance / yr
- $507 – $1,088
Fire risk 2/10 · Minimal
- Est. fire insurance / yr
- $1,222 – $2,270
Heat risk 8/10 · Major
- Hot days now (above 110°F)
- 7 days/yr
- Hot days in 30 yrs
- 24 days/yr
Wind risk 6/10 · Moderate
- Chance of severe wind over 30 yrs
- 27.0%
Air-quality risk 3/10 · Minor
- Unhealthy air days now
- 2 days/yr
- Unhealthy air days in 30 yrs
- 4 days/yr
Risk factors via First Street. Map © Google.
Why this score? — see what drove the D- grade
The composite is a weighted blend of 9 inputs, each scored 0–100. Each bar is that input's sub-score; the figure is the points it added to the 100-point composite (weight × sub-score).
- ARV discount +14.4/15.0
- Cash flow +8.4/30.0
- Livability +4.0/5.0
- 1% rule +3.1/10.0
- Condition / age +2.5/5.0
- DSCR +2.3/10.0
- Rent growth +2.1/5.0
- Schools +2.0/10.0
- Appreciation +0.0/10.0
$279,900
🖨 Deal sheet (PDF) 📄 Offer letter ✓ Due diligence
Listing remarks
Welcome to 5548 Thunder Bay Dr, an inviting home nestled in a convenient Fort Worth location. The spacious living area flows seamlessly into the dining space and kitchen, creating a bright and connected atmosphere. The kitchen features ample cabinetry, generous counter space, and a layout that makes meal prep and hosting easy. The primary suite provides a comfortable retreat with a private bath and good closet space, while the additional bedrooms offer flexibility for family, guests, or a home office. Step outside to a private backyard with plenty of room for relaxing, pets, or outdoor gatherings. Conveniently located near major highways, shopping, dining, and schools, this home offers both
Key facts
- Ample cabinetry
- Spacious living area
- Private backyard
Tags
Property features AI
Finance
- Other: Located in the Waterfront Enchanted Bay Fwy subdivision; Parcel and land details recorded with assessor
- Financial info: Listing accepts Cash, Conventional, FHA, and VA financing
- HOA & community: Mandatory HOA; Quarterly HOA fee; HOA covers management fees; HOA managed by Essex Assoc Mgmt
Exterior
- Parking: Attached 2-car garage with garage door opener; Covered parking for 2 vehicles; Driveway
- Security: Gated community
- Utilities: City water; City sewer; Concrete and curb infrastructure; Sidewalks; Irrigation equipment
- Home design: Single-family residence; Residential property; Two-story; Entry level primary bedroom
- Construction: Built in 2014; Brick and siding exterior; Composition roof; Slab foundation
- Exterior features: Wood fencing; Gated community features; Curbs and sidewalks; Concrete driveways/paths; All-weather road access
Interior
- Kitchen: Kitchen island; Pantry; Dishwasher; Disposal; Electric range; Microwave
- Bedrooms: Primary bedroom on main level; Three additional bedrooms on second level (two with walk-in closets)
- Flooring: Carpet; Ceramic tile
- Bathrooms: Two full bathrooms; One half bathroom
- Heating & cooling: Central heating (electric); Central air (electric); Ceiling fans
- Interior features: Eat-in kitchen; High-speed internet available; Walk-in closets; One living area; One dining area; 7 total rooms; Two levels
- Laundry & utility: Separate utility room; Full-size washer/dryer area; Washer hookup; Electric dryer hookup
Neighborhood map
What this means for you Summary
Snapshot
- This is a 4-bed/2.0-bath single-family listed at $280k.
Deal economics
- At list price, monthly cash flow is $-251 ($-3k/yr) — negative.
- To cash-flow at today's rent, offer at most $236k (15.8% below list).
- To meet the 1% rule (rent ≥ 1% of price), the offer needs to be $228k (18.7% below list).
- Recommended offer: $228k (18.7% below list) — sets the bar for 1% rule.
- Cap rate 5.2% vs local median 3.9% in Fort Worth — top-decile yield for the area; either an underpriced asset or a hidden risk that comps aren't pricing in. Stress-test before assuming the spread holds.
Location & tenants
- Location reads 80/100 on livability (#49 in TX, #1,954 nationally) — a professional / high-income tenant draw. Strengths: amenities A+, cost of living A+, housing A+; Watch: crime F.
- Fort Worth ISD (urban): math 18% / reading 28% proficiency, ranked #742 of 826 in TX (top 90%) — low school quality limits family demand, transient renter base, plan for 1-2y turnover; 73% free/reduced lunch — lower-income household profile, screen leases tightly.
- Zoned schools: Sunrise - Mcmillan El (math 8% / reading 12%, grade F, #4,259 of 4,322 statewide, top 99%, 325 students, 98% FRL) — zoned schools average 98% FRL vs 73% district-wide (26 pts higher); higher-poverty schools than district average — tighter screening recommended.
- Zoned-school proficiency averages 10% at this address vs 23% district-wide (-13 pts) — the specific schools serving this property underperform the Fort Worth ISD average; the district grade overstates school quality for this exact location.
- Market conditions: Rents soft (-1.6%/yr); 187 active listings in the ZIP; 21 comparable units currently listed for rent nearby; rentals lingering (median 46d on market — plan ~5-8 weeks vacancy on turnover, expect pricing pressure); 52% of comp listings sitting > 30 days — soft ceiling on asking rent; 18,938 units permitted in Tarrant County in 2024 (8,336 in 5+ unit buildings).
- At $2,277/mo this rent would consume 53% of the median local household income ($51k/yr) (locally 2221% of renters already pay >50% of income on rent) — very limited rent-growth headroom before tenants either downsize or default.
Forward outlook
- Local home prices are declining (-3.0%/yr); year-one equity from $2k of loan paydown is wiped out by about $8k of value loss. Plan a longer hold.
- Tarrant County population projected at +41% by 2050 — long-run rental-demand tailwind backs the buy-and-hold thesis.
Negotiation context
- It's been on market 37 days — a 3% lower offer ($272k) is reasonable based on typical stale-listing flexibility.
Risks & watch-outs
- Climate carrying-cost: major wind risk, 27% chance of damaging wind over 30y; extreme-heat days projected 7→24/yr by 2055 (HVAC capex compounding) — expect insurance premiums to compound above CPI over the hold.
Questions for the listing agent
- What do current leases actually rent for vs. the listed asking? Can we see a recent rent roll and the last 12 months of T-12 income?
- It's been on market 37 days. Have you received any prior offers? Is the seller open to a 19% concession, seller financing, or rate buy-down credit?
- What does the HOA fee cover, when was the last increase, and are there any pending special assessments or reserve-fund shortfalls?
- Is there a deadline driving the sale (1031 exchange, divorce, estate, relocation)? That informs how much negotiation room exists.
- Schools are D-rated, which usually means shorter tenancies and higher turnover. Who's the typical renter profile here, and what's been the actual vacancy rate?
- Crime grade is F in this area — have there been break-ins, vandalism, or insurance claims at this property in the last 3 years? What carrier currently insures it and at what premium?
- The area grade is low — what's the realistic commute time and amenity access for the typical tenant pool here? Any planned neighborhood developments (good or bad) we should know about?
- What's the average days-on-market for RENTAL listings here right now (not sales)? A rising rental-DOM trend means longer vacancies and softer asking-rent achievability than the comps imply.
- What's the recent tenant-quality profile in this submarket — average credit score on applications, eviction rate, late-payment / NSF rate, and stable-employment percentage? A property-management company in the area should have these aggregated.
- How much new for-sale + rental construction is in the pipeline within 1–3 miles? Heavy new supply typically softens prices + rents 12–24 months out; constrained supply supports both.
Investment metrics
- 1% rule
- 0.81% ✗
- Cap rate
- 5.22%
- Cash-on-cash
- -3.84%
- DSCR
- 0.83
- GRM
- 10.2
CMA / ARV
- ARV (median comp)
- $330,299
- List price
- $279,900
- Delta
- -15.26%
- Verdict
- UNDERPRICED
- Comps
- 20 within 1.0 mi
Show comp detail 12 sales within ~0.75 mi
| Address | Dist | Beds/Ba | Sqft | Sold | Price | $/sf | Match |
|---|---|---|---|---|---|---|---|
| 5541 Grenada Dr | 0.10mi | 3/2.0 (-1) | 1,896 (-3%) | 1mo | $389,900 | $206 | 84 |
| 4503 Lake Park Dr | 0.51mi | 3/2.0 (-1) | 1,975 (+1%) | 1mo | $350,000 | $177 | 70 |
| 5512 Grenada Dr | 0.07mi | 3/2.5 (-1) | 2,231 (+14%) | 2mo | $320,000 | $143 | 66 |
| 5804 Grenada Ct | 0.10mi | 4/2.5 | 2,243 (+14%) | 6mo | $325,000 | $145 | 64 |
| 5712 Shore Point Trl | 0.45mi | 3/3.0 (-1) | 2,013 (+3%) | 3mo | $319,000 | $158 | 64 |
| 5649 Willamette Dr | 0.40mi | 3/2.5 (-1) | 1,805 (-8%) | 2mo | $282,000 | $156 | 59 |
| 4720 Michelle Dr | 0.63mi | 3/2.0 (-1) | 1,889 (-4%) | 4mo | $370,000 | $196 | 56 |
| 7107 Greenspring Dr | 0.68mi | 4/2.5 | 2,002 (+2%) | 10mo | $295,000 | $147 | 54 |
| 7116 Bowman Springs Rd | 0.60mi | 4/1.5 | 1,778 (-9%) | 3mo | $365,000 | $205 | 51 |
| 4710 Michelle Dr | 0.59mi | 4/2.0 | 2,242 (+14%) | 4mo | $340,000 | $152 | 45 |
| 7110 Forestview Dr | 0.67mi | 4/2.5 | 2,209 (+13%) | 5mo | $310,000 | $140 | 42 |
| 4609 Lupin Pl | 0.72mi | 3/2.0 (-1) | 1,724 (-12%) | 7mo | $343,000 | $199 | 35 |
Match score weights: distance 35% · size 25% · config 20% · recency 20%. Top-matched comps best support the ARV.
Projected returns pro-forma
-3.0% appreciation · 0.0% rent growth · sell at horizon
- IRR
- -26.4%
- Equity multiple
- 0.13×
- Total profit
- $-67,914
- Equity at exit
- $41,734
- IRR
- -39.2%
- Equity multiple
- -0.34×
- Total profit
- $-105,088
- Equity at exit
- $24,201
Cash invested: $78,372 (down + closing). Projections, not guarantees.
Landlord ↔ Tenant lean methodology
- Overall (STATE)
- 87 Strongly Landlord-Friendly
- State Texas
- 87 Strongly Landlord-Friendly · R+5
- County
- — inherits STATE
- City
- — inherits STATE
ZIP-level market 76119
- Home prices YoY
- -6.4%
- Rents YoY
- -1.6%
- Active inventory
- 187
- Price-to-rent
- 10.2×
Monthly cashflow live
- Estimated rent
- $2,277 high interval (Pro) →
- Mortgage (P&I)
- −$1,468
- Tax from tax record
- −$433 /mo · $5,200/yr
- Insurance
- −$117
- HOA
- −$32
- Vacancy / Maint / Mgmt
- −$478
- Net cashflow
- $-251
Break-even live
Sensitivity live
| Price | -10% $-93 | -5% $-172 | +0% $-251 | +5% $-330 | +10% $-410 |
|---|---|---|---|---|---|
| Rent | -10% $-431 | -5% $-341 | +0% $-251 | +5% $-161 | +10% $-71 |
| Rate | -1.0pp $-110 | -0.5pp $-180 | base $-251 | +0.5pp $-324 | +1.0pp $-397 |
UW: 25.0% down · 7.5% · 30yr · 1.5% tax · 5.0% vac · 8.0% maint · 8.0% mgmt
Financing live
Cash to close
- Down payment
- $69,975
- Closing costs
- $8,397
- Reserves months
- —
- Total cash needed
- —
Loan-product check · same deal, 3 products live
Conventional
25% down · 7.5% · 30yr
- Down + closing
- —
- Monthly P&I
- —
- Monthly cashflow
- —
- DSCR
- —
- Eligible?
- —
Personal DTI + credit; lowest rate.
DSCR
20% down · 8.5% · 30yr
- Down + closing
- —
- Monthly P&I
- —
- Monthly cashflow
- —
- DSCR
- —
- Eligible?
- —
No personal income docs; deal must DSCR.
Hard money
10% down · 12.0% · 12mo
- Down + closing
- —
- Monthly P&I
- —
- Monthly cashflow
- —
- DSCR
- —
- Eligible?
- —
Short-term bridge; refi at stabilization.
Rent comps 21 comps
| Address | Beds | Baths | Sqft | Rent | $/sqft | DOM | Units | Dist |
|---|---|---|---|---|---|---|---|---|
| 5533 Grenada Dr Fort Worth, TX | 4.0 | 2.0 | 2065 | $2,700 | $1.31 | 45d | 1 | 0.10mi |
| 5640 Willamette Dr Fort Worth, TX | 4.0 | 3.5 | 2013 | $2,340 | $1.16 | 45d | 1 | 0.39mi |
| 5641 Willamette Dr Fort Worth, TX | 3.0 | 2.5 | 1631 | $2,150 | $1.32 | 18d | 1 | 0.41mi |
| 5500 David Strickland Rd Fort Worth, TX | 5.0 | 2.0 | 1635 | $1,895 | $1.16 | 26d | 1 | 0.44mi |
| 5664 Shore Point Trl Fort Worth, TX | 3.0 | 2.5 | 1742 | $2,150 | $1.23 | 45d | 1 | 0.47mi |
| 5541 Topwater Trl Fort Worth, TX | 3.0 | 3.0 | 2089 | $6,100 | $2.92 | 4d | 1 | 0.51mi |
| 5532 Shore Point Trl Fort Worth, TX | 3.0 | 2.5 | 1446 | $1,950 | $1.35 | 45d | 1 | 0.54mi |
| 5505 Shore Point Trl Fort Worth, TX | 4.0 | 2.5 | 2043 | $2,300 | $1.13 | 26d | 1 | 0.59mi |
| 5104 Applegate Dr Fort Worth, TX | 4.0 | 3.5 | 2013 | $2,340 | $1.16 | 45d | 1 | 0.70mi |
| 6905 Forestview Dr Arlington, TX | 3.0 | 2.0 | 1780 | $2,149 | $1.21 | 26d | 1 | 0.88mi |
| 7014 Cadillac Blvd Arlington, TX | 3.0 | 2.0 | 1525 | $2,199 | $1.44 | 45d | 1 | 0.92mi |
| 4131 Crossgate Ct Arlington, TX | 3.0 | 2.0 | 1845 | $2,350 | $1.27 | 0d | 1 | 1.02mi |
| 6610 Greenspring Dr Arlington, TX | 3.0 | 2.0 | 1517 | $1,895 | $1.25 | 0d | 1 | 1.07mi |
| 6610 Greenspring Dr Arlington, TX | 3.0 | 2.0 | 1517 | $2,295 | $1.51 | 46d | 1 | 1.07mi |
| 6515 Greenspring Dr Arlington, TX | 4.0 | 2.0 | 1900 | $2,295 | $1.21 | 45d | 1 | 1.17mi |
| 6512 High Country Trl Arlington, TX | 4.0 | 2.0 | 2368 | $2,475 | $1.05 | 3d | 1 | 1.21mi |
| 6606 Cliffwood Ct Arlington, TX | 4.0 | 2.5 | 2220 | $3,000 | $1.35 | 0d | 1 | 1.28mi |
| 4010 Southern Charm Ct Arlington, TX | 3.0 | 2.5 | 1540 | $1,995 | $1.30 | 18d | 1 | 1.32mi |
| 4611 Rockland Dr Arlington, TX | 3.0 | 2.0 | 1936 | $2,050 | $1.06 | 45d | 1 | 1.39mi |
| 5712 Whittlesey Rd Fort Worth, TX | 4.0 | 2.0 | 1610 | $2,000 | $1.24 | 46d | 1 | 1.48mi |
| 3900 Brookgate Ct Arlington, TX | 4.0 | 2.5 | 2327 | $2,256 | $0.97 | 45d | 1 | 1.49mi |
HOA detail
- Monthly dues
- $32 · $384/yr
Listing history 9 events
-
2026-06-04status $279,900 Pending 37 DOM
-
2026-06-03days on market $279,900 Active Option Contract 37 DOM
-
2026-06-02days on market $279,900 Active Option Contract 36 DOM
-
2026-06-01days on market $279,900 Active Option Contract 35 DOM
-
2026-05-31days on market $279,900 Active Option Contract 34 DOM
-
2026-05-11price $289,900 730-char remark
-
2026-04-27$299,900 Active 730-char remark
-
2014-09-17soldstatus
-
2014-06-18soldstatus
ⓘ Source: listings_history table (triggers on properties + properties_extension) + one-shot
backfill from property_details.listing_events for pre-trigger history.
Tax reassessment forecast TX · Resets to sale price
- Current annual tax
- $5,200 · $433/mo
- Projected year-2 tax
- $5,200 · $433/mo
- Expected delta
- $0/yr ($0/mo · 0.0%)
ⓘ Screening estimate from a state-policy table — verify with the county assessor before closing.
Climate risk First Street
- Flood 1/10 Low FEMA zone X (shaded) · 0% chance over 30 yrs
- Wildfire 2/10 Low
- Heat 8/10 Severe 7 d/yr ≥110°F today · 24 d/yr by 30 yrs out
- Wind 6/10 Major 27% chance of damaging wind over 30 yrs
- Air quality 3/10 Moderate 2 unhealthy d/yr today · 4 by 30 yrs out
Nearby sold comps map
Loading sold comps map…
Walkable amenities ~0.75 mi
Loading nearby amenities…
Taxation est. · year 1
- Rental income
- $27,322
- − Mortgage interest
- −$15,679
- − Property taxes
- −$5,200
- − Insurance
- −$1,400
- − Repairs & maintenance
- −$2,186
- − Management
- −$2,186
- − HOA
- −$384
- − Depreciation
- −$8,143
- Taxable loss
- −$7,854
- Est. tax savings @ 24.0%
- +$1,885
- After-tax cash flow
- $-1,128/yr
For passive investors: Depreciation is non-cash, so a rental often shows a tax loss while cash-flowing — sheltering income. Rental losses are passive: they offset passive income freely, and up to $25,000/yr can offset ordinary (W-2) income if you actively participate and your MAGI is under $100k (phasing out to $0 by $150k); unused losses carry forward. On sale, claimed depreciation is recaptured at up to 25%, and gains may owe capital-gains tax (a 1031 exchange can defer both). Figures are a year-1 estimate at your 24.0% rate — not tax advice; consult a CPA.
Schools (NCES district)
- District
- Fort Worth ISD
- NCES district ID
- 4819700
- Math proficiency
- 18% ▼ -16.00%
- Reading proficiency
- 28% ▼ -6.00%
- Median HH income
- $42,109
- Composite
- 19.61/100
- National rank
- #8753
- State rank
- #742 of 826 in TX
Livability — Fort Worth
- Score
- 80/100
- State rank
- #49
- US rank
- #1954
Category grades
Schools grade is shown separately in the Schools card above.
Census & demographics
- Census place
- Fort Worth, TX
- County
- Tarrant County · 2,033,669 people
- City population
- 911,619
- Metro
- Dallas-Fort Worth-Arlington, TX
- Population (ZIP)
- 52,974
- Household income
- $51,267
- Rent vs Own
- Severe rent burden
- 2221.0
Population outlook (Tarrant County) Hauer SSP2
- Today (2025)
- 2,380,417 people
- By 2030
- 2,578,900 · +8.3%
- By 2040
- 2,974,995 · +25.0%
- By 2050
- 3,350,489 · +40.8%
- By 2075
- 4,216,909 · +77.2%
- By 2100
- 4,741,527 · +99.2%
Race, ethnicity, and origin ACS 2023
- Neighborhood character
- Diverse neighborhood (Simpson 0.60)
- Race & ethnicity
- Hispanic / Latino 51% Black 36% Two or more races 26% White 8% Asian 3%
- Hispanic origin (detail)
- Mexican 44%
- Foreign-born
- 25% · Canada, Philippines
- Languages at home
- 54% English-only · Spanish 42% Other Indo-European 2% Other Asian/Pacific 1%
Political lean MEDSL · Tarrant
- 2024 margin
- Lean R (+5.1) · D 46.7% · R 51.9% · Other 1.4%
- 2008→2024 swing
- +6.6pp toward D · 2008: -11.7pp · 2024: -5.1pp
- All cycles
- 2024: R+5.1 2020: D+0.2 2016: R+8.7 2012: R+15.7 2008: R+11.7
Not yet ingested
- Civics
- —
Market trends
- HPI YoY
- ▼ -23.04%
- Current HPI
- 336.7941
- Rent YoY
- ▼ -1.61%
- Metro
- Dallas-Fort Worth-Arlington, TX
- State GDP YoY
- ▲ 3.95%
- F500 in state
- 110
Industry mix (Fortune 500 HQ in TX)
| Industry | F500 HQs | Revenue |
|---|---|---|
| Energy | 16 | $1,198B |
|
||
| Technology | 5 | $198B |
|
||
| Engineering / Construction | 4 | $72B |
|
||
| Energy Services | 3 | $60B |
|
||
| Utilities | 3 | $41B |
|
||
| Healthcare | 2 | $330B |
|
||
Price history
-6.7% since first listed7 events — show timeline
- 2026-06-04 Pending — NTREIS
- 2026-05-29 Contingent — NTREIS
- 2026-05-21 Price Changed $279,900 NTREIS
- 2026-05-11 Price Changed $289,900 NTREIS
- 2026-04-27 Listed $299,900 NTREIS
- 2014-09-17 Sold (Public Records) — Public Records
- 2014-06-18 Sold (Public Records) — Public Records
Property tax history
+11.7%/yrLatest (2025): $5,200 · -18.9% YoY. Source: county tax records.
Cash-flow waterfall
monthlySold comps — $/sqft
last 12 mo · ≤1 miLoading sold comps…