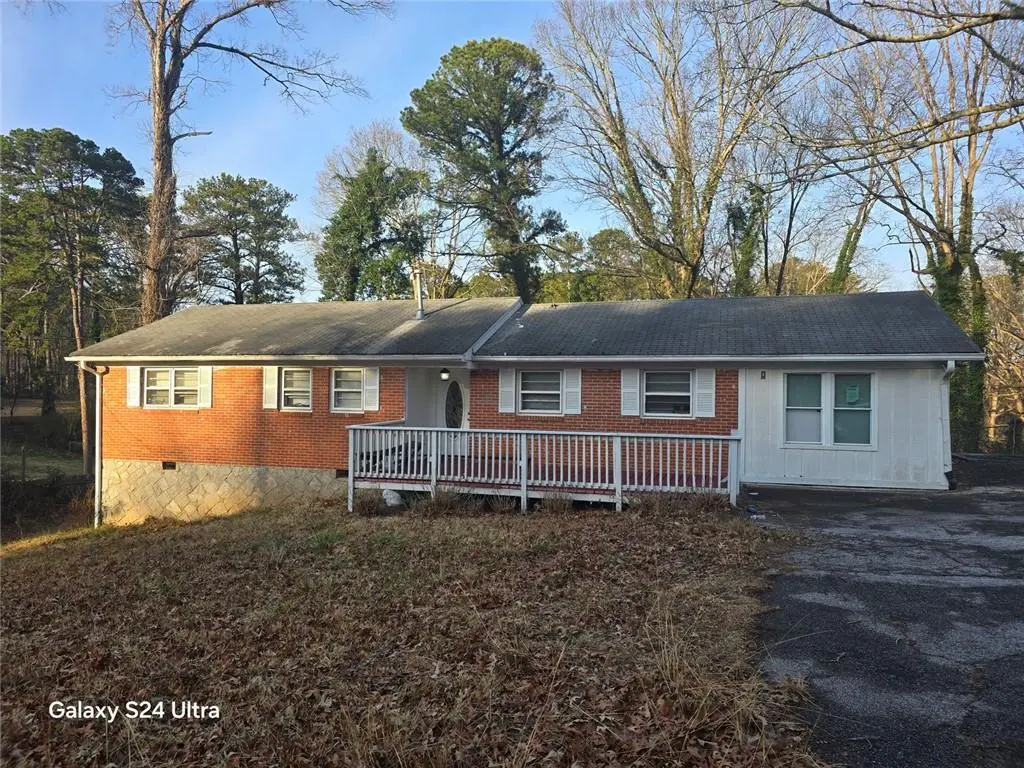
6270 Rockbridge Rd · Stone Mountain, GA
Flood risk 1/10 · Minimal
- FEMA flood zone
- X (unshaded)
- Chance of flooding over 30 yrs
- 0.0%
- Est. flood insurance / yr
- $507 – $1,088
Fire risk 2/10 · Minimal
- Est. fire insurance / yr
- $963 – $1,789
Heat risk 5/10 · Moderate
- Hot days now (above 105°F)
- 7 days/yr
- Hot days in 30 yrs
- 17 days/yr
Wind risk 6/10 · Moderate
- Chance of severe wind over 30 yrs
- 27.0%
Air-quality risk 5/10 · Moderate
- Unhealthy air days now
- 7 days/yr
- Unhealthy air days in 30 yrs
- 10 days/yr
Risk factors via First Street. Map © Google.
Why this score? — see what drove the D grade
The composite is a weighted blend of 9 inputs, each scored 0–100. Each bar is that input's sub-score; the figure is the points it added to the 100-point composite (weight × sub-score).
- Cash flow +13.4/30.0
- ARV discount +11.4/15.0
- 1% rule +4.0/10.0
- DSCR +4.0/10.0
- Livability +4.0/5.0
- Rent growth +2.8/5.0
- Condition / age +2.5/5.0
- Schools +2.1/10.0
- Appreciation +0.0/10.0
$225,000
🖨 Deal sheet 📄 Offer letter ✓ Due diligence
Listing remarks MLS
PROPERTY SOLD AS-IS. This is a great and ideal opportunty for motivated renovators and investors. This is a single family home or a potential income producing property with 4 bedrooms, 3 full bathrooms and a potentail bonus family room. DON'T judge the book by the cover. Come and check out your next rental project or your next fix and flip. AGAIN, PROPERTY SOLD AS-IS.
Key facts
- 0.65 acre lot
- 6 parking spots
- Built 1957
Neighborhood map
What this means for you Summary
Snapshot
- This is a 3-bed/1.5-bath single-family listed at $225k.
Deal economics
- At list price, monthly cash flow is $4 ($48/yr) — positive.
- The deal already cash-flows at list — no discount required.
- To meet the 1% rule (rent ≥ 1% of price), the offer needs to be $201k (10.5% below list).
- Recommended offer: $201k (10.5% below list) — sets the bar for 1% rule.
- Cap rate 6.3% vs local median 5.1% in Stone Mountain — meaningfully above typical; check what's discounted (condition, days-on-market, listing class) to confirm the premium yield is real.
Location & tenants
- Location reads 79/100 on livability (#11 in GA, #1,977 nationally) — a middle-class / working-renter tenant base. Strengths: commute A+, cost of living A+, housing A+; Watch: employment D+, schools F, crime F.
- Dekalb County (suburban): math 19% / reading 28% proficiency, ranked #125 of 174 in GA (top 72%) — low school quality limits family demand, transient renter base, plan for 1-2y turnover; 68% free/reduced lunch — lower-income household profile, screen leases tightly.
- Market conditions: Rents rising (+1.3%/yr); 246 active listings in the ZIP; 20 comparable units currently listed for rent nearby; rentals at typical pace (median 24d on market — plan ~3-4 weeks tenant-placement turnaround); 40% of comp listings sitting > 30 days — soft ceiling on asking rent; solid renter incomes; 1,240 units permitted in DeKalb County in 2024 (385 in 5+ unit buildings).
Forward outlook
- Local home prices are declining (-3.0%/yr); year-one equity from $2k of loan paydown is wiped out by about $7k of value loss. Plan a longer hold.
- DeKalb County population projected at +28% by 2050 — long-run rental-demand tailwind backs the buy-and-hold thesis.
Negotiation context
- It's been on market 105 days — a 9% lower offer ($205k) is reasonable based on typical stale-listing flexibility.
- 2 sale attempts; this cycle's ask has dropped $80k (26%) from the opening price — seller is motivated, your offer sets the floor, not the list.
Risks & watch-outs
- Watch-outs: built in 1957 — expect roof / HVAC / electrical / plumbing capex.
- Climate carrying-cost: major wind risk, 27% chance of damaging wind over 30y; extreme-heat days projected 7→17/yr by 2055 (HVAC capex compounding) — expect insurance premiums to compound above CPI over the hold.
Questions for the listing agent
- It's been on market 105 days. Have you received any prior offers? Is the seller open to a 10% concession, seller financing, or rate buy-down credit?
- Built in 1957 — when were the roof, HVAC, electrical panel, plumbing, and water heater last replaced?
- Why hasn't it sold? Are there any deal-killer items the seller is aware of (foundation, flood, title, zoning, code violations)?
- Is there a deadline driving the sale (1031 exchange, divorce, estate, relocation)? That informs how much negotiation room exists.
- Schools are F-rated, which usually means shorter tenancies and higher turnover. Who's the typical renter profile here, and what's been the actual vacancy rate?
- Crime grade is F in this area — have there been break-ins, vandalism, or insurance claims at this property in the last 3 years? What carrier currently insures it and at what premium?
- The area grade is low — what's the realistic commute time and amenity access for the typical tenant pool here? Any planned neighborhood developments (good or bad) we should know about?
- What's the average days-on-market for RENTAL listings here right now (not sales)? A rising rental-DOM trend means longer vacancies and softer asking-rent achievability than the comps imply.
- What's the recent tenant-quality profile in this submarket — average credit score on applications, eviction rate, late-payment / NSF rate, and stable-employment percentage? A property-management company in the area should have these aggregated.
- How much new for-sale + rental construction is in the pipeline within 1–3 miles? Heavy new supply typically softens prices + rents 12–24 months out; constrained supply supports both.
Investment metrics
- 1% rule
- 0.90% ✗
- Cap rate
- 6.31%
- Cash-on-cash
- 0.08%
- DSCR
- 1.00
- GRM
- 9.3
CMA / ARV
- ARV (median comp)
- $246,560
- List price
- $225,000
- Delta
- -8.74%
- Verdict
- FAIR
- Comps
- 20 within 1.0 mi
Show comp detail 12 sales within ~0.75 mi
| Address | Dist | Beds/Ba | Sqft | Sold | Price | $/sf | Match |
|---|---|---|---|---|---|---|---|
| 6270 Rockbridge Rd | 0.00mi | 4/3.0 (+1) | 1,618 (0%) | 1mo | $170,000 | $105 | 88 |
| 592 Allana Ct | 0.37mi | 3/2.0 | 1,618 (0%) | 1mo | $286,000 | $177 | 80 |
| 6100 Mincey Rd | 0.38mi | 3/2.0 | 1,384 (-14%) | 4mo | $188,000 | $136 | 53 |
| 5848 Navarre Ct | 0.66mi | 3/2.0 | 1,516 (-6%) | 7mo | $220,000 | $145 | 51 |
| 6310 Field Glen Rd | 0.57mi | 4/2.0 (+1) | 1,782 (+10%) | 1mo | $270,000 | $152 | 48 |
| 6292 Field Glen Rd | 0.54mi | 3/2.0 | 1,480 (-8%) | 13mo | $272,500 | $184 | 48 |
| 609 Mount Vista Ct | 0.49mi | 3/2.0 | 1,394 (-14%) | 7mo | $275,000 | $197 | 46 |
| 577 Simone Way | 0.69mi | 3/2.0 | 1,818 (+12%) | 0mo | $309,900 | $170 | 44 |
| 630 Simone Way | 0.70mi | 3/2.0 | 1,735 (+7%) | 17mo | $275,000 | $159 | 39 |
| 644 Navarre Dr | 0.73mi | 4/3.0 (+1) | 1,751 (+8%) | 3mo | $309,900 | $177 | 39 |
| 5847 Navarre Ct | 0.64mi | 3/2.5 | 1,832 (+13%) | 16mo | $350,000 | $191 | 31 |
| 437 Stephenson Rd | 0.66mi | 4/2.5 (+1) | 1,844 (+14%) | 10mo | $350,000 | $190 | 29 |
Match score weights: distance 35% · size 25% · config 20% · recency 20%. Top-matched comps best support the ARV.
Projected returns pro-forma
-3.0% appreciation · 1.3% rent growth · sell at horizon
- IRR
- -18.1%
- Equity multiple
- 0.37×
- Total profit
- $-39,541
- Equity at exit
- $33,548
- IRR
- -14.1%
- Equity multiple
- 0.25×
- Total profit
- $-47,333
- Equity at exit
- $19,454
Cash invested: $63,000 (down + closing). Projections, not guarantees.
Landlord ↔ Tenant lean methodology
- Overall (STATE)
- 90 Strongly Landlord-Friendly
- State Georgia
- 90 Strongly Landlord-Friendly · R+3
- County
- — inherits STATE
- City
- — inherits STATE
ZIP-level market 30087
- Rents YoY
- 1.3%
- Active inventory
- 246
- Price-to-rent
- 9.3×
Monthly cashflow live
- Estimated rent
- $2,014 high interval (Pro) →
- Mortgage (P&I)
- −$1,180
- Tax from tax record
- −$313 /mo · $3,762/yr
- Insurance
- −$94
- HOA
- −$0
- Vacancy / Maint / Mgmt
- −$423
- Net cashflow
- $4
Break-even live
UW: 25.0% down · 7.5% · 30yr · 1.5% tax · 5.0% vac · 8.0% maint · 8.0% mgmt
Financing live
Cash to close
- Down payment
- $56,250
- Closing costs
- $6,750
- Reserves months
- —
- Total cash needed
- —
Loan-product check · same deal, 3 products live
Conventional
25% down · 7.5% · 30yr
- Down + closing
- —
- Monthly P&I
- —
- Monthly cashflow
- —
- DSCR
- —
- Eligible?
- —
Personal DTI + credit; lowest rate.
DSCR
20% down · 8.5% · 30yr
- Down + closing
- —
- Monthly P&I
- —
- Monthly cashflow
- —
- DSCR
- —
- Eligible?
- —
No personal income docs; deal must DSCR.
Hard money
10% down · 12.0% · 12mo
- Down + closing
- —
- Monthly P&I
- —
- Monthly cashflow
- —
- DSCR
- —
- Eligible?
- —
Short-term bridge; refi at stabilization.
Rent comps 20 comps
| Address | Beds | Baths | Sqft | Rent | $/sqft | DOM | Units | Dist |
|---|---|---|---|---|---|---|---|---|
| 427 Chanterelle Dr Stone Mountain, GA | 3.0 | 2.5 | 1608 | $1,650 | $1.03 | 3d | 1 | 0.09mi |
| 651 Mincey Woods Ct Stone Mountain, GA | 3.0 | 2.0 | 2188 | $2,150 | $0.98 | 43d | 1 | 0.19mi |
| 564 Field Cliff Dr Stone Mountain, GA | 4.0 | 3.0 | 2200 | $5,500 | $2.50 | 43d | 1 | 0.55mi |
| 481 Stephenson Rd Stone Mountain, GA | 3.0 | 1.0 | 1396 | $1,855 | $1.33 | 5d | 1 | 0.71mi |
| 5811 Navarre Ct Stone Mountain, GA | 3.0 | 2.0 | 1864 | $1,911 | $1.03 | 2d | 1 | 0.75mi |
| 643 Navarre Dr Stone Mountain, GA | 3.0 | 2.5 | 1666 | $2,600 | $1.56 | 43d | 1 | 0.79mi |
| 524 Julius Dr Stone Mountain, GA | 3.0 | 2.0 | 1780 | $1,795 | $1.01 | 43d | 1 | 0.98mi |
| 450 Pennybrook Dr Stone Mountain, GA | 3.0 | 2.0 | 1404 | $1,750 | $1.25 | 24d | 1 | 1.04mi |
| 469 Sherwood Grn Stone Mountain, GA | 3.0 | 2.0 | 1792 | $1,810 | $1.01 | 11d | 1 | 1.12mi |
| 5612 Pennybrook Ct Stone Mountain, GA | 3.0 | 2.0 | 1364 | $1,941 | $1.42 | 12d | 1 | 1.20mi |
| 5621 Stonington Trace Pkwy Stone Mountain, GA | 2.0 | 3.5 | 1292 | $1,581 | $1.22 | 15d | 1 | 1.23mi |
| 5702 Wells Cir Stone Mountain, GA | 2.0 | 2.5 | 1160 | $1,495 | $1.29 | 43d | 1 | 1.23mi |
| 5707 Wells Cir Stone Mountain, GA | 2.0 | 2.5 | 1160 | $1,506 | $1.30 | 4d | 1 | 1.24mi |
| 5713 Wells Cir Stone Mountain, GA | 3.0 | 2.5 | 1304 | $1,706 | $1.31 | 5d | 1 | 1.25mi |
| 6445 Greenock Dr Unit 1 Stone Mountain, GA | 2.0 | 2.5 | 1200 | $2,450 | $2.04 | 43d | 1 | 1.25mi |
| 557 Shadow Valley Ct Lithonia, GA | 3.0 | 2.5 | 1588 | $1,700 | $1.07 | 43d | 1 | 1.36mi |
| 732 Shadow Lake Dr Lithonia, GA | 4.0 | 2.5 | 2200 | $2,800 | $1.27 | 24d | 1 | 1.38mi |
| 5994 Pattillo Ln Lithonia, GA | 3.0 | 2.5 | 1680 | $1,940 | $1.15 | 5d | 1 | 1.43mi |
| 597 Shadow Valley Ct Lithonia, GA | 3.0 | 2.0 | 2141 | $1,879 | $0.88 | 43d | 1 | 1.44mi |
| 5509 Stonehaven Way Stone Mountain, GA | 4.0 | 3.0 | 1635 | $1,899 | $1.16 | 22d | 1 | 1.47mi |
Listing history 12 events
-
2026-06-09days on market $225,000 Active 105 DOM
-
2026-06-08days on market $225,000 Active 104 DOM
-
2026-06-07days on market $225,000 Active 103 DOM
-
2026-06-04days on market $225,000 Active 100 DOM
-
2026-06-03days on market $225,000 Active 99 DOM
-
2026-06-02days on market $225,000 Active 98 DOM
-
2026-06-01days on market $225,000 Active 97 DOM
-
2026-05-31days on market $225,000 Active 96 DOM
-
2026-03-16price $225,000 370-char remark
Show marketing remark (370 chars)
PROPERTY SOLD AS-IS. This is a great and ideal opportunty for motivated renovators and investors. This is a single family home or a potential income producing property with 4 bedrooms, 3 full bathrooms and a potentail bonus family room. DON'T judge the book by the cover. Come and check out your next rental project or your next fix and flip. AGAIN, PROPERTY SOLD AS-IS.
-
2026-02-23$305,000 New 370-char remark
Show marketing remark (370 chars)
PROPERTY SOLD AS-IS. This is a great and ideal opportunty for motivated renovators and investors. This is a single family home or a potential income producing property with 4 bedrooms, 3 full bathrooms and a potentail bonus family room. DON'T judge the book by the cover. Come and check out your next rental project or your next fix and flip. AGAIN, PROPERTY SOLD AS-IS.
-
2026-02-23$305,000 Active 370-char remark
Show marketing remark (370 chars)
PROPERTY SOLD AS-IS. This is a great and ideal opportunty for motivated renovators and investors. This is a single family home or a potential income producing property with 4 bedrooms, 3 full bathrooms and a potentail bonus family room. DON'T judge the book by the cover. Come and check out your next rental project or your next fix and flip. AGAIN, PROPERTY SOLD AS-IS.
ⓘ Source: listings_history table (triggers on properties + properties_extension) + one-shot
backfill from property_details.listing_events for pre-trigger history.
Tax reassessment forecast GA · Resets to sale price
- Current annual tax
- $3,762 · $313/mo
- Projected year-2 tax
- $3,762 · $313/mo
- Expected delta
- $0/yr ($0/mo · 0.0%)
ⓘ Screening estimate from a state-policy table — verify with the county assessor before closing.
Climate risk First Street
- Flood 1/10 Low FEMA zone X (unshaded) · 0% chance over 30 yrs
- Wildfire 2/10 Low
- Heat 5/10 Major 7 d/yr ≥105°F today · 17 d/yr by 30 yrs out
- Wind 6/10 Major 27% chance of damaging wind over 30 yrs
- Air quality 5/10 Major 7 unhealthy d/yr today · 10 by 30 yrs out
Nearby sold comps map
Loading sold comps map…
Walkable amenities ~0.75 mi
Loading nearby amenities…
Taxation est. · year 1
- Rental income
- $24,170
- − Mortgage interest
- −$12,603
- − Property taxes
- −$3,762
- − Insurance
- −$1,125
- − Repairs & maintenance
- −$1,934
- − Management
- −$1,934
- − Depreciation
- −$6,545
- Taxable loss
- −$3,733
- Est. tax savings @ 24.0%
- +$896
- After-tax cash flow
- $944/yr
For passive investors: Depreciation is non-cash, so a rental often shows a tax loss while cash-flowing — sheltering income. Rental losses are passive: they offset passive income freely, and up to $25,000/yr can offset ordinary (W-2) income if you actively participate and your MAGI is under $100k (phasing out to $0 by $150k); unused losses carry forward. On sale, claimed depreciation is recaptured at up to 25%, and gains may owe capital-gains tax (a 1031 exchange can defer both). Figures are a year-1 estimate at your 24.0% rate — not tax advice; consult a CPA.
Schools (NCES district)
- District
- Dekalb County
- NCES district ID
- 1301740
- Math proficiency
- 19% ▼ -12.00%
- Reading proficiency
- 28% ▼ -7.00%
- Median HH income
- $51,448
- Composite
- 20.92/100
- National rank
- #8482
- State rank
- #125 of 174 in GA
Livability — Stone Mountain
- Score
- 79/100
- State rank
- #11
- US rank
- #1977
Category grades
Schools grade is shown separately in the Schools card above.
Census & demographics
- County
- Dekalb County · 782,738 people
- City population
- 130,941
- Metro
- Atlanta-Sandy Springs-Alpharetta, GA
- Population (ZIP)
- 38,977
- Household income
- $96,491
- Rent vs Own
- Severe rent burden
- 780.0
Population outlook (DeKalb County) Hauer SSP2
- Today (2025)
- 839,977 people
- By 2030
- 891,768 · +6.2%
- By 2040
- 988,894 · +17.7%
- By 2050
- 1,074,583 · +27.9%
- By 2075
- 1,245,026 · +48.2%
- By 2100
- 1,303,135 · +55.1%
Race, ethnicity, and origin ACS 2023
- Neighborhood character
- Diverse neighborhood (Simpson 0.56)
- Race & ethnicity
- Black 62% White 22% Asian 6% Hispanic / Latino 5% Two or more races 5%
- Common ancestry
- Slovak 1% Lithuanian 1% Serbian 1%
- Foreign-born
- 14% · Canada, China, South Korea
- Languages at home
- 86% English-only · Spanish 5% Other Indo-European 2% Other Asian/Pacific 1%
Political lean MEDSL · DeKalb
- 2024 margin
- Solid D (+64.8) · D 81.9% · R 17.1% · Other 1.0%
- 2008→2024 swing
- +6.1pp toward D · 2008: 58.6pp · 2024: 64.8pp
- All cycles
- 2024: D+64.8 2020: D+67.4 2016: D+64.8 2012: D+56.8 2008: D+58.6
Not yet ingested
- Civics
- —
Market trends
- HPI YoY
- ▼ -228.39%
- Current HPI
- 204.2122
- Rent YoY
- ▲ 1.30%
- Metro
- Atlanta-Sandy Springs-Alpharetta, GA
- State GDP YoY
- ▲ 2.66%
- F500 in state
- 28
Industry mix (Fortune 500 HQ in GA)
| Industry | F500 HQs | Revenue |
|---|---|---|
| Paper / Packaging | 2 | $29B |
|
||
| Retail | 1 | $160B |
|
||
| Transportation / Logistics | 1 | $91B |
|
||
| Airlines | 1 | $62B |
|
||
| Consumer Goods | 1 | $47B |
|
||
| Utilities | 1 | $25B |
|
||
Price history
-26.2% since first listed4 events — show timeline
- 2026-03-16 Price Changed $225,000 GAMLS
- 2026-03-16 Price Changed $225,000 FMLS
- 2026-02-23 Listed $305,000 FMLS
- 2026-02-23 Listed $305,000 GAMLS
Property tax history
+4.8%/yrLatest (2025): $3,762 · -12.5% YoY. Source: county tax records.
Cash-flow waterfall
monthlySold comps — $/sqft
last 12 mo · ≤1 miLoading sold comps…