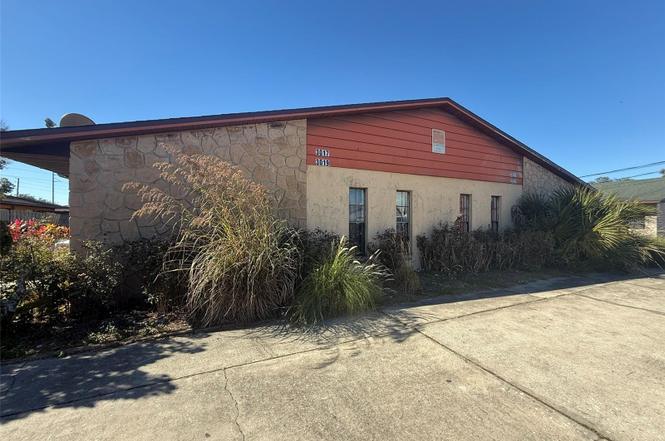
 Fourplex
3023 Saint Paul Dr · Jan Phyl Village, FL
Flood risk 1/10 · Minimal
- FEMA flood zone
- X (unshaded)
- Chance of flooding over 30 yrs
- 0.0%
- Est. flood insurance / yr
- $507 – $1,088
Fire risk 5/10 · Moderate
- Est. fire insurance / yr
- $947 – $1,759
Heat risk 8/10 · Major
- Hot days now (above 107°F)
- 7 days/yr
- Hot days in 30 yrs
- 24 days/yr
Wind risk 9/10 · Severe
- Chance of severe wind over 30 yrs
- 99.0%
Air-quality risk 2/10 · Minimal
- Unhealthy air days now
- 2 days/yr
- Unhealthy air days in 30 yrs
- 2 days/yr
Risk factors via First Street. Map © Google.
Why this score? — see what drove the C- grade
The composite is a weighted blend of 9 inputs, each scored 0–100. Each bar is that input's sub-score; the figure is the points it added to the 100-point composite (weight × sub-score).
- Cash flow +22.4/30.0
- ARV discount +7.5/15.0
- DSCR +7.2/10.0
- 1% rule +5.3/10.0
- Schools +3.5/10.0
- Rent growth +3.1/5.0
- Livability +3.1/5.0
- Condition / age +2.5/5.0
- Appreciation +0.0/10.0
$550,000
🖨 Deal sheet 📄 Offer letter ✓ Due diligence
Multi-family units
County records classify this as Multi-Family (2-4 Unit). Listing-text estimate: 4 units. confirmed
Listing remarks
BUYER FINANCING FELL THROUGH!! Don’t miss your chance to own this fully rented quadplex offering immediate cash flow. All four units are currently occupied with month-to-month tenancies paying $1000-1200 per month, giving a new owner flexibility to increase rents to market value or renovate units for added equity and higher returns. Each unit features: 2 Bedrooms / 1 Bathroom, spacious living and dining room combination, dedicated laundry room with washer/dryer hookups, gas stoves and hot water heaters. The roof is only 5 years old. Whether you’re looking to expand your portfolio or secure a strong income-producing property, this quadplex checks all the boxes with built-in upsid
Key facts
- Immediate cash flow
- Hot water heaters
- Gas stoves
Tags
Neighborhood map
What this means for you Summary
Snapshot
- This is a 4 × 2.0-bed/1.0-bath units multifamily listed at $550k.
Deal economics
- At list price, monthly cash flow is $912 ($11k/yr) — positive. Per door: $228/mo.
- The deal already cash-flows at list — no discount required.
- Meets the 1% rule at list price ($6k rent vs $550k).
- Recommended offer: $542k (1.5% below list) — sets the bar for market timing.
Location & tenants
- Location reads 62/100 on livability (#769 in FL) — a middle-class / working-renter tenant base. Strengths: cost of living A+, housing A+; Watch: employment D+, amenities F, commute F.
- Polk (suburban): math 39% / reading 43% proficiency, ranked #62 of 73 in FL (top 85%) — families likely to look elsewhere, expect single-tenant / working-renter base with shorter leases.
- Zoned schools: Lake Shipp Elementary School (math 30% / reading 38%, grade F, #1,744 of 2,144 statewide, top 82%, 628 students, 60% FRL); Lake Region High School (math 14% / reading 22%, grade F, #570 of 667 statewide, top 86%, 1,545 students, 61% FRL) — zoned schools at 60% FRL track the district average.
- Zoned-school proficiency averages 26% at this address vs 41% district-wide (-15 pts) — the specific schools serving this property underperform the Polk average; the district grade overstates school quality for this exact location.
- Market conditions: Rents rising (+2.5%/yr); 341 active listings in the ZIP; 10,384 units permitted in Polk County in 2024 (1,716 in 5+ unit buildings).
- At $5,680/mo this rent would consume 121% of the median local household income ($56k/yr) (locally 1412% of renters already pay >50% of income on rent) — very limited rent-growth headroom before tenants either downsize or default.
Forward outlook
- Local home prices are declining (-3.0%/yr); year-one equity from $4k of loan paydown is wiped out by about $16k of value loss. Plan a longer hold.
- Polk County population projected at +33% by 2050 — long-run rental-demand tailwind backs the buy-and-hold thesis.
Negotiation context
- It's been on market 20 days — a 2% lower offer ($542k) is reasonable based on typical stale-listing flexibility.
- Current owner paid $120k; list at $550k implies a 358% gain — meaningful room to come down on a strong offer.
Risks & watch-outs
- Climate carrying-cost: severe wind risk, 99% chance of damaging wind over 30y; moderate wildfire risk; extreme-heat days projected 7→24/yr by 2055 (HVAC capex compounding) — expect insurance premiums to compound above CPI over the hold.
Questions for the listing agent
- Can we see the unit-by-unit rent roll, current vacancy, and any below-market leases? What's the average tenancy length?
- What capital expenditures (roof, boiler, parking lot, exteriors) have been made in the last 5 years, and what's planned in the next 2?
- Is there a deadline driving the sale (1031 exchange, divorce, estate, relocation)? That informs how much negotiation room exists.
- Schools are F-rated, which usually means shorter tenancies and higher turnover. Who's the typical renter profile here, and what's been the actual vacancy rate?
- What's the average days-on-market for RENTAL listings here right now (not sales)? A rising rental-DOM trend means longer vacancies and softer asking-rent achievability than the comps imply.
- What's the recent tenant-quality profile in this submarket — average credit score on applications, eviction rate, late-payment / NSF rate, and stable-employment percentage? A property-management company in the area should have these aggregated.
- How much new apartment / multifamily construction is in the pipeline within 1–3 miles? Heavy new supply (>2% of stock underway) typically softens rents 12–24 months out; light construction supports rent growth.
Investment metrics
- 1% rule
- 1.03% ✓
- Cap rate
- 8.28%
- Cash-on-cash
- 7.11%
- DSCR
- 1.32
- GRM
- 8.1
CMA / ARV
No comps found within radius.
Projected returns pro-forma
-3.0% appreciation · 2.47% rent growth · sell at horizon
- IRR
- -6.0%
- Equity multiple
- 0.78×
- Total profit
- $-34,103
- Equity at exit
- $82,007
- IRR
- 3.0%
- Equity multiple
- 1.21×
- Total profit
- $32,652
- Equity at exit
- $47,554
Cash invested: $154,000 (down + closing). Projections, not guarantees.
Landlord ↔ Tenant lean methodology
- Overall (STATE)
- 87 Strongly Landlord-Friendly
- State Florida
- 87 Strongly Landlord-Friendly · R+3
- County
- — inherits STATE
- City
- — inherits STATE
ZIP-level market 33880
- Home prices YoY
- -16.2%
- Rents YoY
- 2.5%
- Active inventory
- 341
- Price-to-rent
- 32.3×
Monthly cashflow live
- Estimated rent
- $5,680 high interval (Pro) →
- Mortgage (P&I)
- −$2,884
- Tax from tax record
- −$462 /mo · $5,541/yr
- Insurance
- −$229
- HOA
- −$0
- Vacancy / Maint / Mgmt
- −$1,193
- Net cashflow
- $912
Break-even live
4-unit breakdown (identical units grouped — click to expand)
| Units | Beds | Baths | Est. rent |
|---|---|---|---|
| 4× units | 2.0 | 1 | $5,680 |
| #1 | 2.0 | 1 | $1,420 |
| #2 | 2.0 | 1 | $1,420 |
| #3 | 2.0 | 1 | $1,420 |
| #4 | 2.0 | 1 | $1,420 |
| Total (4 units) | $5,680 | ||
UW: 25.0% down · 7.5% · 30yr · 1.5% tax · 5.0% vac · 8.0% maint · 8.0% mgmt
Financing live
Cash to close
- Down payment
- $137,500
- Closing costs
- $16,500
- Reserves months
- —
- Total cash needed
- —
Loan-product check · same deal, 3 products live
Conventional
25% down · 7.5% · 30yr
- Down + closing
- —
- Monthly P&I
- —
- Monthly cashflow
- —
- DSCR
- —
- Eligible?
- —
Personal DTI + credit; lowest rate.
DSCR
20% down · 8.5% · 30yr
- Down + closing
- —
- Monthly P&I
- —
- Monthly cashflow
- —
- DSCR
- —
- Eligible?
- —
No personal income docs; deal must DSCR.
Hard money
10% down · 12.0% · 12mo
- Down + closing
- —
- Monthly P&I
- —
- Monthly cashflow
- —
- DSCR
- —
- Eligible?
- —
Short-term bridge; refi at stabilization.
Listing history 12 events
-
2026-06-18days on market $550,000 Active 20 DOM
-
2026-06-17days on market $550,000 Active 19 DOM
-
2026-06-16days on market $550,000 Active 18 DOM
-
2026-06-15days on market $550,000 Active 17 DOM
-
2026-06-13days on market $550,000 Active 15 DOM
-
2026-06-10days on market $550,000 Active 12 DOM
-
2026-06-09days on market $550,000 Active 11 DOM
-
2026-06-08days on market $550,000 Active 10 DOM
-
2026-06-07status $550,000 Active 9 DOM
-
2026-03-13status Pending
-
2026-03-04$550,000 Active
-
1984-05-01soldstatus $120,000
ⓘ Source: listings_history table (triggers on properties + properties_extension) + one-shot
backfill from property_details.listing_events for pre-trigger history.
Tax reassessment forecast FL · Resets to sale price
- Current annual tax
- $5,541 · $462/mo
- Projected year-2 tax
- $5,541 · $462/mo
- Expected delta
- $0/yr ($0/mo · 0.0%)
ⓘ Screening estimate from a state-policy table — verify with the county assessor before closing.
Climate risk First Street
- Flood 1/10 Low FEMA zone X (unshaded) · 0% chance over 30 yrs
- Wildfire 5/10 Major
- Heat 8/10 Severe 7 d/yr ≥107°F today · 24 d/yr by 30 yrs out
- Wind 9/10 Extreme 99% chance of damaging wind over 30 yrs
- Air quality 2/10 Low 2 unhealthy d/yr today · 2 by 30 yrs out
Nearby sold comps map
Loading sold comps map…
Walkable amenities ~0.75 mi
Loading nearby amenities…
Taxation est. · year 1
- Rental income
- $68,160
- − Mortgage interest
- −$30,809
- − Property taxes
- −$5,541
- − Insurance
- −$2,750
- − Repairs & maintenance
- −$5,453
- − Management
- −$5,453
- − Depreciation
- −$16,000
- Taxable income
- $2,155
- Est. tax owed @ 24.0%
- −$517
- After-tax cash flow
- $10,427/yr
For passive investors: Depreciation is non-cash, so a rental often shows a tax loss while cash-flowing — sheltering income. Rental losses are passive: they offset passive income freely, and up to $25,000/yr can offset ordinary (W-2) income if you actively participate and your MAGI is under $100k (phasing out to $0 by $150k); unused losses carry forward. On sale, claimed depreciation is recaptured at up to 25%, and gains may owe capital-gains tax (a 1031 exchange can defer both). Figures are a year-1 estimate at your 24.0% rate — not tax advice; consult a CPA.
Schools (NCES district)
- District
- Polk
- NCES district ID
- 1201590
- Math proficiency
- 39% ▼ -11.00%
- Reading proficiency
- 43% ▼ -4.00%
- Median HH income
- $43,979
- Composite
- 34.74/100
- National rank
- #5132
- State rank
- #62 of 73 in FL
Livability — Jan Phyl Village
- Score
- 62/100
- State rank
- #769
- US rank
- #17294
Category grades
Schools grade is shown separately in the Schools card above.
Census & demographics
- Census place
- Jan Phyl Village, FL
- County
- Polk County · 740,051 people
- Metro
- Lakeland-Winter Haven, FL
- Population (ZIP)
- 43,371
- Household income
- $56,390
- Rent vs Own
- Severe rent burden
- 1412.0
Population outlook (Polk County) Hauer SSP2
- Today (2025)
- 752,975 people
- By 2030
- 804,621 · +6.9%
- By 2040
- 906,117 · +20.3%
- By 2050
- 1,000,476 · +32.9%
- By 2075
- 1,197,520 · +59.0%
- By 2100
- 1,271,518 · +68.9%
Race, ethnicity, and origin ACS 2023
- Neighborhood character
- Diverse neighborhood (Simpson 0.65)
- Race & ethnicity
- White 49% Hispanic / Latino 27% Black 17% Two or more races 14% Asian 1%
- Hispanic origin (detail)
- Mexican 11% Puerto Rican 10% Cuban 2%
- Common ancestry
- Hispanic 2% Lithuanian 1% Italian 1%
- Foreign-born
- 9% · Canada, Jamaica
- Languages at home
- 74% English-only · Spanish 21% French/Haitian/Cajun 4%
Political lean MEDSL · Polk
- 2024 margin
- Strong R (+20.7) · D 39.2% · R 59.9%
- 2008→2024 swing
- -14.6pp toward R · 2008: -6.1pp · 2024: -20.7pp
- All cycles
- 2024: R+20.7 2020: R+14.4 2016: R+14.1 2012: R+6.8 2008: R+6.1
Not yet ingested
- Civics
- —
Market trends
- HPI YoY
- ▼ -61.41%
- Current HPI
- 317.8788
- Rent YoY
- ▲ 2.47%
- Metro
- Lakeland-Winter Haven, FL
- State GDP YoY
- ▲ 3.28%
- F500 in state
- 36
Industry mix (Fortune 500 HQ in FL)
| Industry | F500 HQs | Revenue |
|---|---|---|
| Industrial Technology | 2 | $29B |
|
||
| Insurance | 2 | $17B |
|
||
| Retail | 1 | $60B |
|
||
| Technology Distribution | 1 | $58B |
|
||
| Homebuilding | 1 | $35B |
|
||
| Technology Manufacturing | 1 | $35B |
|
||
Price history
+358.3% since first listed3 events — show timeline
- 2026-03-13 Pending — Stellar MLS as Distributed by MLS Grid
- 2026-03-04 Listed $550,000 Stellar MLS as Distributed by MLS Grid
- 1984-05-01 Sold (Public Records) $120,000 Public Records
Property tax history
+15.3%/yrLatest (2025): $5,541 · +7.9% YoY. Source: county tax records.
Cash-flow waterfall
monthlySold comps — $/sqft
last 12 mo · ≤1 miLoading sold comps…