 🏷️ Likely Rental
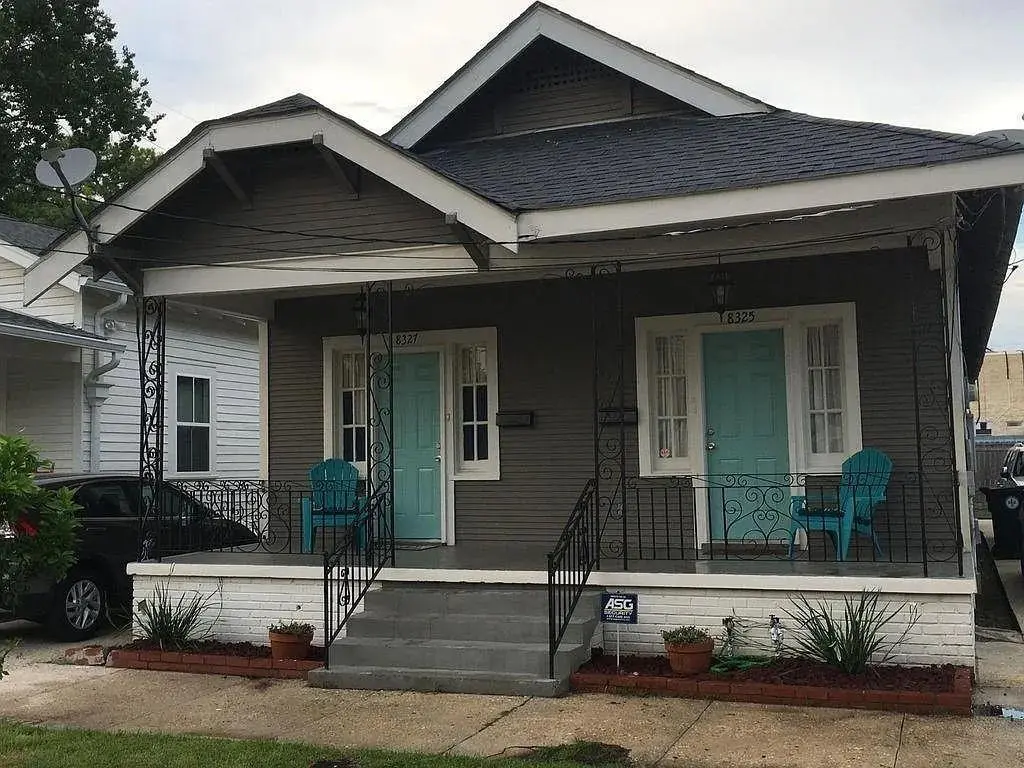
8327 Belfast St · New Orleans, LA
Flood risk 8/10 · Major
- FEMA flood zone
- X (shaded)
- Chance of flooding over 30 yrs
- 0.6%
- Est. flood insurance / yr
- $507 – $1,088
Fire risk 1/10 · Minimal
- Est. fire insurance / yr
- $1,269 – $2,357
Heat risk 10/10 · Severe
- Hot days now (above 108°F)
- 7 days/yr
- Hot days in 30 yrs
- 21 days/yr
Wind risk 10/10 · Severe
- Chance of severe wind over 30 yrs
- 99.0%
Air-quality risk 4/10 · Minor
- Unhealthy air days now
- 4 days/yr
- Unhealthy air days in 30 yrs
- 4 days/yr
Risk factors via First Street. Map © Google.
Why this score? — see what drove the D grade
The composite is a weighted blend of 9 inputs, each scored 0–100. Each bar is that input's sub-score; the figure is the points it added to the 100-point composite (weight × sub-score).
- Cash flow +15.0/30.0
- ARV discount +7.5/15.0
- 1% rule +5.0/10.0
- DSCR +5.0/10.0
- Livability +4.0/5.0
- Condition / age +4.0/5.0
- Rent growth +2.7/5.0
- Schools +1.6/10.0
- Appreciation +0.0/10.0
$1,150
🖨 Deal sheet 📄 Offer letter ✓ Due diligence
Multi-family units
County records classify this as Multi-Family (2-4 Unit). Listing-text estimate: 1 unit. estimate disagrees with records
Listing remarks MLS
Recently renovated 2 bedroom/ 1 bath homeith open floor plan located in Carrollton. Newly refinished wood floors throughout with large closets in each bedroom. Ceiling fans throughout, fully equipped eat in kitchen featuring: granite, counter tops, stainless steel appliances; gas stove, microwave, refrigerator and dishwasher. Off street parking, central air/heat, washer/dryer. No pets allowed, tenant pays utilities.
Key facts
- Open floor plan
- Large closets
- Granite counter tops
Tags
Property features AI
Exterior
- Parking: Off-street parking
- Utilities: Public water; Public sewer
- Home design: Single-story; Raised foundation
- Construction: Wood siding; Shingle roof; Built with raised foundation
- Exterior features: Front porch; City lot; Rectangular lot; Lot dimensions approximately 41 x 100
Interior
- Bedrooms: 2 rooms total
- Bathrooms: 1 full bathroom
- Heating & cooling: Central heating; Central air conditioning
- Interior features: Very good condition
- Laundry & utility: Tenants pay electricity, gas, and water
Neighborhood map
What this means for you Summary
Snapshot
- This is a 2-bed/1.0-bath multifamily listed at $1k. Condition is rated good.
Deal economics
- At list price, monthly cash flow is $1k ($13k/yr) — positive.
- The deal already cash-flows at list — no discount required.
- Meets the 1% rule at list price ($1k rent vs $1k).
- Cap rate 1207.6% vs local median 4.4% in New Orleans — top-decile yield for the area; either an underpriced asset or a hidden risk that comps aren't pricing in. Stress-test before assuming the spread holds.
Location & tenants
- Location reads 81/100 on livability (#3 in LA, #1,383 nationally) — a professional / high-income tenant draw. Strengths: amenities A+, commute A+, health & safety A+; Watch: crime C-, employment D.
- Orleans Parish (urban): math 11% / reading 27% proficiency, ranked #69 of 98 in LA (top 70%) — low school quality limits family demand, transient renter base, plan for 1-2y turnover; 68% free/reduced lunch — lower-income household profile, screen leases tightly.
- Market conditions: Rents flat; 279 active listings in the ZIP; 40 comparable units currently listed for rent nearby; rentals at typical pace (median 21d on market — plan ~3-4 weeks tenant-placement turnaround); 710 units permitted in Orleans Parish in 2024 (244 in 5+ unit buildings).
Forward outlook
- Local home prices are declining (-3.0%/yr); year-one equity from $8 of loan paydown is wiped out by about $34 of value loss. Plan a longer hold.
- Orleans County population projected at +61% by 2050 — long-run rental-demand tailwind backs the buy-and-hold thesis.
- At projected returns (-3.0% appreciation + 1.0% rent growth), your $322 cash investment doubles in ~1 year — after that, you're playing with house money.
Negotiation context
- Only 11 days on market — expect competitive offers; lowballing is unlikely to land.
- 2 sale attempts with the ask held roughly flat each time — persistent listings suggest the price (not the market) is what's stuck; bring a comps-based counter.
Risks & watch-outs
- Watch-outs: flood insurance adds $66/mo; built in 1950 — expect roof / HVAC / electrical / plumbing capex.
- Climate carrying-cost: severe flood risk; severe wind risk, 99% chance of damaging wind over 30y; extreme-heat days projected 7→21/yr by 2055 (HVAC capex compounding) — expect insurance premiums to compound above CPI over the hold.
Questions for the listing agent
- Built in 1950 — when were the roof, HVAC, electrical panel, plumbing, and water heater last replaced?
- What's the actual annual flood-insurance premium (NFIP or private), and is the property in a SFHA with mandatory coverage?
- Is there a deadline driving the sale (1031 exchange, divorce, estate, relocation)? That informs how much negotiation room exists.
- The area grade is low — what's the realistic commute time and amenity access for the typical tenant pool here? Any planned neighborhood developments (good or bad) we should know about?
- What's the average days-on-market for RENTAL listings here right now (not sales)? A rising rental-DOM trend means longer vacancies and softer asking-rent achievability than the comps imply.
- What's the recent tenant-quality profile in this submarket — average credit score on applications, eviction rate, late-payment / NSF rate, and stable-employment percentage? A property-management company in the area should have these aggregated.
- How much new apartment / multifamily construction is in the pipeline within 1–3 miles? Heavy new supply (>2% of stock underway) typically softens rents 12–24 months out; light construction supports rent growth.
Investment metrics
- 1% rule
- 127.60% ✓
- Cap rate
- 1207.65%
- Cash-on-cash
- 4290.55%
- DSCR
- 191.91
- GRM
- 0.1
CMA / ARV
No comps found within radius.
Projected returns pro-forma
-3.0% appreciation · 0.97% rent growth · sell at horizon
- IRR
- —
- Equity multiple
- 206.07×
- Total profit
- $66,033
- Equity at exit
- $171
- IRR
- —
- Equity multiple
- 420.73×
- Total profit
- $135,152
- Equity at exit
- $99
Cash invested: $322 (down + closing). Projections, not guarantees.
Landlord ↔ Tenant lean methodology
- Overall (STATE)
- 90 Strongly Landlord-Friendly
- State Louisiana
- 90 Strongly Landlord-Friendly · R+12
- County
- — inherits STATE
- City
- — inherits STATE
ZIP-level market 70118
- Rents YoY
- 1.0%
- Active inventory
- 279
- Price-to-rent
- 0.1×
Monthly cashflow live
- Estimated rent
- $1,467 high interval (Pro) →
- Mortgage (P&I)
- −$6
- Tax est. 1.5%
- −$1 /mo · $17/yr
- Insurance
- −$0
- Flood insurance flood zone
- −$66 /mo · $798/yr
- HOA
- −$0
- Vacancy / Maint / Mgmt
- −$308
- Net cashflow
- $1,085
Break-even live
UW: 25.0% down · 7.5% · 30yr · 1.5% tax · 5.0% vac · 8.0% maint · 8.0% mgmt
Financing live
Cash to close
- Down payment
- $288
- Closing costs
- $34
- Reserves months
- —
- Total cash needed
- —
Loan-product check · same deal, 3 products live
Conventional
25% down · 7.5% · 30yr
- Down + closing
- —
- Monthly P&I
- —
- Monthly cashflow
- —
- DSCR
- —
- Eligible?
- —
Personal DTI + credit; lowest rate.
DSCR
20% down · 8.5% · 30yr
- Down + closing
- —
- Monthly P&I
- —
- Monthly cashflow
- —
- DSCR
- —
- Eligible?
- —
No personal income docs; deal must DSCR.
Hard money
10% down · 12.0% · 12mo
- Down + closing
- —
- Monthly P&I
- —
- Monthly cashflow
- —
- DSCR
- —
- Eligible?
- —
Short-term bridge; refi at stabilization.
Rent comps 40 comps
| Address | Beds | Baths | Sqft | Rent | $/sqft | DOM | Units | Dist |
|---|---|---|---|---|---|---|---|---|
| 8327 Belfast St heuristic New Orleans, LA | 2.0 | 1.0 | 800 | $1,150 | $1.44 | 25d | 1 | 0.02mi |
| 8327 Belfast St New Orleans, LA | 2.0 | 1.0 | 800 | $1,150 | $1.44 | 14d | 1 | 0.02mi |
| 8405 Apricot St New Orleans, LA | 3.0 | 2.0 | 1058 | $1,795 | $1.70 | 3d | 1 | 0.09mi |
| 8405 Apricot St New Orleans, LA | 3.0 | 2.0 | 1058 | $1,795 | $1.70 | 3d | 1 | 0.09mi |
| 8417 Apple St New Orleans, LA | 2.0 | 1.0 | 828 | $1,200 | $1.45 | 17d | 1 | 0.10mi |
| 8127 Belfast St New Orleans, LA | 1.0 | 1.0 | 621 | $1,000 | $1.61 | 23d | 1 | 0.12mi |
| 8429 Apple St Unit 1B New Orleans, LA | 2.0 | 1.0 | 803 | $1,400 | $1.74 | 23d | 1 | 0.12mi |
| 8205 Nelson St Unit A New Orleans, LA | 2.0 | 1.0 | 600 | $1,000 | $1.67 | 14d | 1 | 0.16mi |
| 2730 Leonidas St New Orleans, LA | 2.0 | 1.0 | 1000 | $1,400 | $1.40 | 23d | 1 | 0.20mi |
| 8610 Apricot St New Orleans, LA | 3.0 | 2.0 | 1000 | $2,200 | $2.20 | 10d | 1 | 0.21mi |
| 4 Fontainebleau Dr Unit A New Orleans, LA | 1.0 | 1.0 | 700 | $1,450 | $2.07 | 23d | 1 | 0.23mi |
| 8637 Belfast St New Orleans, LA | 2.0 | 1.0 | 800 | $1,195 | $1.49 | 23d | 1 | 0.24mi |
| 8633 Nelson St New Orleans, LA | 2.0 | 1.0 | 800 | $1,100 | $1.38 | 2d | 1 | 0.27mi |
| 8709 Pritchard Pl New Orleans, LA | 3.0 | 2.0 | 1000 | $1,500 | $1.50 | 21d | 1 | 0.30mi |
| 2311 Joliet St New Orleans, LA | 2.0 | 2.0 | 950 | $1,900 | $2.00 | 23d | 1 | 0.30mi |
| 8812 Apple St New Orleans, LA | 3.0 | 2.0 | 1085 | $1,650 | $1.52 | 16d | 1 | 0.35mi |
| 8328 Forshey St New Orleans, LA | 2.0 | 1.0 | 838 | $1,200 | $1.43 | 3d | 1 | 0.37mi |
| 2428 Eagle St New Orleans, LA | 2.0 | 1.0 | 840 | $1,425 | $1.70 | 23d | 1 | 0.37mi |
| 2817 General Ogden St Unit 2819 New Orleans, LA | 2.0 | 1.0 | 870 | $1,200 | $1.38 | 23d | 1 | 0.37mi |
| 8514 Forshey St New Orleans, LA | 3.0 | 1.0 | 1030 | $1,600 | $1.55 | 23d | 1 | 0.39mi |
| 8841 S Claiborne Ave Unit C New Orleans, LA | 1.0 | 1.0 | 575 | $1,200 | $2.09 | 23d | 1 | 0.42mi |
| 3316 Joliet St #18 New Orleans, LA | 2.0 | 1.0 | 800 | $1,400 | $1.75 | 23d | 1 | 0.43mi |
| 2909 Hollygrove St New Orleans, LA | 2.0 | 1.0 | 725 | $995 | $1.37 | 23d | 1 | 0.45mi |
| 3205 Fern St New Orleans, LA | 2.0 | 1.0 | 938 | $1,200 | $1.28 | 21d | 1 | 0.45mi |
| 2915 Hollygrove St New Orleans, LA | 1.0 | 1.0 | 725 | $995 | $1.37 | 21d | 1 | 0.46mi |
| 2022 Dante St New Orleans, LA | 2.0 | 1.0 | 989 | $1,300 | $1.31 | 3d | 1 | 0.47mi |
| 7929 Forshey St New Orleans, LA | 1.0 | 1.0 | 534 | $1,200 | $2.25 | 19d | 1 | 0.47mi |
| 7927 Forshey St New Orleans, LA | 1.0 | 1.0 | 700 | $1,200 | $1.71 | 23d | 1 | 0.47mi |
| 3317 Short St New Orleans, LA | 3.0 | 2.0 | 900 | $1,600 | $1.78 | 23d | 1 | 0.49mi |
| 8925 Colapissa St New Orleans, LA | 2.0 | 1.0 | 700 | $1,500 | $2.14 | 21d | 1 | 0.49mi |
| 2933 Pine St Unit 2937 New Orleans, LA | 2.0 | 1.0 | 1000 | $1,400 | $1.40 | 23d | 1 | 0.51mi |
| 7931 Olive St New Orleans, LA | 2.0 | 1.0 | 660 | $1,175 | $1.78 | 21d | 1 | 0.53mi |
| 2103 Fern St New Orleans, LA | 2.0 | 1.0 | 920 | $1,750 | $1.90 | 3d | 1 | 0.54mi |
| 7728 Sycamore St Unit B New Orleans, LA | 2.0 | 2.0 | 900 | $1,750 | $1.94 | 17d | 1 | 0.55mi |
| 7927 Spruce St Unit B New Orleans, LA | 1.0 | 1.0 | 650 | $1,350 | $2.08 | 11d | 1 | 0.56mi |
| 7927 Spruce St Unit A New Orleans, LA | 1.0 | 1.0 | 800 | $1,595 | $1.99 | 11d | 1 | 0.56mi |
| 8421 Cohn St New Orleans, LA | 2.0 | 2.0 | 887 | $1,750 | $1.97 | 23d | 1 | 0.56mi |
| 8423 Cohn St New Orleans, LA | 2.0 | 2.0 | 887 | $1,700 | $1.92 | 23d | 1 | 0.56mi |
| 9122 Nelson St New Orleans, LA | 2.0 | 2.0 | 1100 | $1,550 | $1.41 | 23d | 1 | 0.57mi |
| 2432 Broadway St Unit C New Orleans, LA | 2.0 | 1.0 | 1000 | $1,400 | $1.40 | 17d | 1 | 0.58mi |
Listing history 6 events
-
2026-06-03days on market $1,150 Active 11 DOM
-
2026-06-02days on market $1,150 Active 10 DOM
-
2026-06-01days on market $1,150 Active 9 DOM
-
2026-05-31days on market $1,150 Active 8 DOM
-
2026-05-23$1,150 Active
Show marketing remark (419 chars)
Recently renovated 2 bedroom/ 1 bath homeith open floor plan located in Carrollton. Newly refinished wood floors throughout with large closets in each bedroom. Ceiling fans throughout, fully equipped eat in kitchen featuring: granite, counter tops, stainless steel appliances; gas stove, microwave, refrigerator and dishwasher. Off street parking, central air/heat, washer/dryer. No pets allowed, tenant pays utilities.
-
2026-05-23$1,150 Active 419-char remark
Show marketing remark (419 chars)
Recently renovated 2 bedroom/ 1 bath homeith open floor plan located in Carrollton. Newly refinished wood floors throughout with large closets in each bedroom. Ceiling fans throughout, fully equipped eat in kitchen featuring: granite, counter tops, stainless steel appliances; gas stove, microwave, refrigerator and dishwasher. Off street parking, central air/heat, washer/dryer. No pets allowed, tenant pays utilities.
ⓘ Source: listings_history table (triggers on properties + properties_extension) + one-shot
backfill from property_details.listing_events for pre-trigger history.
Climate risk First Street
- Flood 8/10 Severe FEMA zone X (shaded) · 60% chance over 30 yrs
- Wildfire 1/10 Low
- Heat 10/10 Extreme 7 d/yr ≥108°F today · 21 d/yr by 30 yrs out
- Wind 10/10 Extreme 99% chance of damaging wind over 30 yrs
- Air quality 4/10 Moderate 4 unhealthy d/yr today · 4 by 30 yrs out
Nearby sold comps map
Loading sold comps map…
Walkable amenities ~0.75 mi
Loading nearby amenities…
Taxation est. · year 1
- Rental income
- $17,609
- − Mortgage interest
- −$64
- − Property taxes
- −$17
- − Insurance
- −$803
- − Repairs & maintenance
- −$1,409
- − Management
- −$1,409
- − Depreciation
- −$33
- Taxable income
- $13,873
- Est. tax owed @ 24.0%
- −$3,330
- After-tax cash flow
- $9,689/yr
For passive investors: Depreciation is non-cash, so a rental often shows a tax loss while cash-flowing — sheltering income. Rental losses are passive: they offset passive income freely, and up to $25,000/yr can offset ordinary (W-2) income if you actively participate and your MAGI is under $100k (phasing out to $0 by $150k); unused losses carry forward. On sale, claimed depreciation is recaptured at up to 25%, and gains may owe capital-gains tax (a 1031 exchange can defer both). Figures are a year-1 estimate at your 24.0% rate — not tax advice; consult a CPA.
Condition & rehab AI · 13 photos
This recently renovated 2-bedroom/1-bath home in Carrollton features hardwood floors, granite countertops, and stainless steel appliances. It is in good condition with minor cosmetic updates and is ready for move-in.
Value-add opportunities
- Both Painting exterior siding — Enhances curb appeal and can increase both resale and rental value
- Both Landscaping improvements — Enhances curb appeal and can increase both resale and rental value
Renovation cost estimate screening
Value-add ROI direction
- Both Painting exterior siding — Enhances curb appeal and can increase both resale and rental value ↑
- Both Landscaping improvements — Enhances curb appeal and can increase both resale and rental value ↑
ⓘ Cost ranges are severity-bucket heuristics (US national rule-of-thumb). Get contractor quotes + a written scope before underwriting a rehab budget.
Schools (NCES district)
- District
- Orleans Parish
- NCES district ID
- 2201170
- Math proficiency
- 11% ▼ -52.00%
- Reading proficiency
- 27% ▼ -46.00%
- Median HH income
- $37,011
- Composite
- 15.78/100
- National rank
- #9271
- State rank
- #69 of 98 in LA
Livability — New Orleans
- Score
- 81/100
- State rank
- #3
- US rank
- #1383
Category grades
Schools grade is shown separately in the Schools card above.
Census & demographics
- Census place
- New Orleans, LA
- County
- Orleans Parish · 338,817 people
- City population
- 338,817
- Metro
- New Orleans-Metairie, LA
- Population (ZIP)
- 36,072
- Household income
- $63,750
- Rent vs Own
- Severe rent burden
- 2237.0
Population outlook (Orleans County) Hauer SSP2
- Today (2025)
- 513,025 people
- By 2030
- 575,781 · +12.2%
- By 2040
- 700,174 · +36.5%
- By 2050
- 826,541 · +61.1%
- By 2075
- 1,123,374 · +119.0%
- By 2100
- 1,355,609 · +164.2%
Race, ethnicity, and origin ACS 2023
- Neighborhood character
- Diverse neighborhood (Simpson 0.65)
- Race & ethnicity
- White 47% Black 34% Hispanic / Latino 11% Two or more races 11% Asian 4%
- Hispanic origin (detail)
- Mexican 2%
- Common ancestry
- Lithuanian 8% Italian 2% Romanian 2%
- Foreign-born
- 9% · Canada, China
- Languages at home
- 86% English-only · Spanish 7% French/Haitian/Cajun 2% Other Indo-European 2%
Political lean MEDSL · Orleans
- 2024 margin
- Solid D (+67.0) · D 82.2% · R 15.2% · Other 2.7%
- 2008→2024 swing
- +6.7pp toward D · 2008: 60.3pp · 2024: 67.0pp
- All cycles
- 2024: D+67.0 2020: D+68.2 2016: D+66.2 2012: D+62.5 2008: D+60.3
Not yet ingested
- Civics
- —
Market trends
- HPI YoY
- ▼ -210.46%
- Current HPI
- 282.9629
- Rent YoY
- ▲ 0.97%
- Metro
- New Orleans-Metairie, LA
- State GDP YoY
- ▲ 3.29%
- F500 in state
- 10
Industry mix (Fortune 500 HQ in LA)
| Industry | F500 HQs | Revenue |
|---|---|---|
| Telecommunications | 2 | $23B |
|
||
| Utilities | 1 | $12B |
|
||
| Wholesale / Distribution | 1 | $5B |
|
||
| Advertising | 1 | $2B |
|
||
Price history
+0.0% since first listed2 events — show timeline
- 2026-05-23 Listed $1,150 AcadianaMLS
- 2026-05-23 Listed $1,150 GSREIN
Cash-flow waterfall
monthlySold comps — $/sqft
last 12 mo · ≤1 miLoading sold comps…