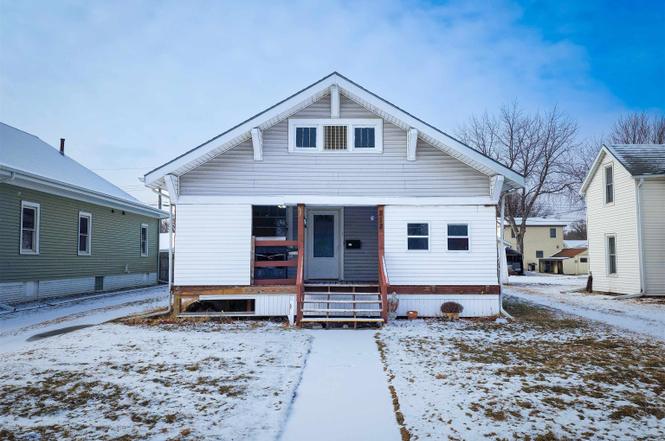
212 13th St · Norfolk, NE
Flood risk 1/10 · Minimal
- FEMA flood zone
- X (unshaded)
- Chance of flooding over 30 yrs
- 0.0%
- Est. flood insurance / yr
- $473 – $860
Fire risk 1/10 · Minimal
- Est. fire insurance / yr
- $1,161 – $2,155
Heat risk 3/10 · Minor
- Hot days now (above 102°F)
- 7 days/yr
- Hot days in 30 yrs
- 15 days/yr
Wind risk 2/10 · Minimal
- Chance of severe wind over 30 yrs
- —
Air-quality risk 2/10 · Minimal
- Unhealthy air days now
- 1 days/yr
- Unhealthy air days in 30 yrs
- 1 days/yr
Risk factors via First Street. Map © Google.
Why this score? — see what drove the B+ grade
The composite is a weighted blend of 9 inputs, each scored 0–100. Each bar is that input's sub-score; the figure is the points it added to the 100-point composite (weight × sub-score).
- Cash flow +30.0/30.0
- ARV discount +15.0/15.0
- DSCR +10.0/10.0
- 1% rule +8.0/10.0
- Livability +3.9/5.0
- Schools +3.8/10.0
- Rent growth +3.3/5.0
- Condition / age +2.5/5.0
- Appreciation +0.0/10.0
$138,000
🖨 Deal sheet (PDF) 📄 Offer letter ✓ Due diligence
Listing remarks
This well-maintained 3-bedroom, 1.5-bath bungalow offers a smart opportunity for both investors and first-time homeowners alike. Featuring a full unfinished basement with excellent potential for added living space or storage, this solid home is, ready to grow with your needs. Major mechanical updates include a newer A/C, furnace, and hot water heater—providing peace of mind and efficiency. Outside, you’ll find a rare 1-car detached drive-through garage with an attached carport and alley access, perfect for extra vehicles, hobbies, or convenience. Whether you’re looking for a solid investment or a comfortable place to start, this property delivers value, flexibility, and lo
Key facts
- Alley access
- Attached carport
- Garage
Tags
Neighborhood map
What this means for you Summary
Snapshot
- This is a 3-bed/2.0-bath single-family listed at $138k.
Deal economics
- At list price, monthly cash flow is $532 ($6k/yr) — positive.
- The deal already cash-flows at list — no discount required.
- Meets the 1% rule at list price ($2k rent vs $138k).
- Recommended offer: $130k (6.0% below list) — sets the bar for market timing.
- Cap rate 10.9% vs local median 3.2% in Norfolk — top-decile yield for the area; either an underpriced asset or a hidden risk that comps aren't pricing in. Stress-test before assuming the spread holds.
Location & tenants
- Location reads 78/100 on livability (#54 in NE, #2,611 nationally) — a middle-class / working-renter tenant base. Strengths: cost of living A+, housing A+, health & safety A+; Watch: employment C-, amenities F, commute F.
- Norfolk Public Schools (town): math 44% / reading 46% proficiency, ranked #84 of 111 in NE (top 76%) — families likely to look elsewhere, expect single-tenant / working-renter base with shorter leases.
- Zoned schools: Norfolk Middle School (math 47% / reading 45%, grade D+, #60 of 128 statewide, top 48%, 600 students, 56% FRL); Norfolk Senior High School (math 44% / reading 38%, grade F, #180 of 261 statewide, top 69%, 1,346 students, 46% FRL).
- Market conditions: Rents rising (+3.3%/yr); 230 active listings in the ZIP; 4 comparable units currently listed for rent nearby; rentals lingering (median 44d on market — plan ~5-8 weeks vacancy on turnover, expect pricing pressure); 50% of comp listings sitting > 30 days — soft ceiling on asking rent; 270 units permitted in Madison County in 2024 (196 in 5+ unit buildings).
- This rent runs 34% of the median local income ($63k/yr) — at the standard rent-burdened threshold; future hikes will face affordability resistance.
Forward outlook
- Local home prices are declining (-3.0%/yr); year-one equity from $954 of loan paydown is wiped out by about $4k of value loss. Plan a longer hold.
- At projected returns (-3.0% appreciation + 3.3% rent growth), your $39k cash investment doubles in ~8 years — after that, you're playing with house money.
Negotiation context
- It's been on market 75 days — a 6% lower offer ($130k) is reasonable based on typical stale-listing flexibility.
Risks & watch-outs
- Watch-outs: built in 1915 — expect roof / HVAC / electrical / plumbing capex.
Questions for the listing agent
- It's been on market 75 days. Have you received any prior offers? Is the seller open to a 6% concession, seller financing, or rate buy-down credit?
- Built in 1915 — when were the roof, HVAC, electrical panel, plumbing, and water heater last replaced?
- Why hasn't it sold? Are there any deal-killer items the seller is aware of (foundation, flood, title, zoning, code violations)?
- Is there a deadline driving the sale (1031 exchange, divorce, estate, relocation)? That informs how much negotiation room exists.
- Schools are B-rated — typically a magnet for longer-tenancy family renters. What's the average tenant stay here, and is there a school-zone premium baked into asking?
- What's the average days-on-market for RENTAL listings here right now (not sales)? A rising rental-DOM trend means longer vacancies and softer asking-rent achievability than the comps imply.
- What's the recent tenant-quality profile in this submarket — average credit score on applications, eviction rate, late-payment / NSF rate, and stable-employment percentage? A property-management company in the area should have these aggregated.
- How much new for-sale + rental construction is in the pipeline within 1–3 miles? Heavy new supply typically softens prices + rents 12–24 months out; constrained supply supports both.
Investment metrics
- 1% rule
- 1.30% ✓
- Cap rate
- 10.92%
- Cash-on-cash
- 16.51%
- DSCR
- 1.73
- GRM
- 6.4
CMA / ARV
- ARV (on-the-fly)
- $244,260
- Comps found
- 12
Show comp detail 12 sales within ~0.75 mi
| Address | Dist | Beds/Ba | Sqft | Sold | Price | $/sf | Match |
|---|---|---|---|---|---|---|---|
| 1313 Park Ave | 0.13mi | 3/2.0 | 1,209 (-12%) | 6mo | $192,000 | $159 | 68 |
| 1008 Verges Ave | 0.56mi | 3/1.5 | 1,417 (+3%) | 1mo | $180,000 | $127 | 67 |
| 406 Skyview Cir | 0.49mi | 2/2.0 (-1) | 1,398 (+1%) | 8mo | $355,000 | $254 | 63 |
| 1809 Taylor Ave | 0.47mi | 2/2.0 (-1) | 1,446 (+5%) | 5mo | $295,000 | $204 | 61 |
| 211 13th St | 0.31mi | 4/2.0 (+1) | 1,536 (+11%) | 3mo | $185,000 | $120 | 59 |
| 608 9th St | 0.48mi | 4/2.0 (+1) | 1,521 (+10%) | 1mo | $132,500 | $87 | 55 |
| 308 13th Pl | 0.40mi | 3/2.0 | 1,582 (+15%) | 5mo | $280,000 | $177 | 53 |
| 213 9th St | 0.48mi | 4/2.0 (+1) | 1,528 (+11%) | 6mo | $208,500 | $136 | 49 |
| 2002 Sunset Ave | 0.48mi | 2/2.0 (-1) | 1,232 (-11%) | 7mo | $234,000 | $190 | 49 |
| 728 11th St | 0.53mi | 2/1.0 (-1) | 1,461 (+6%) | 12mo | $185,000 | $127 | 47 |
| 825 8th St | 0.72mi | 3/2.0 | 1,530 (+11%) | 12mo | $290,000 | $190 | 38 |
| 1407 Elm | 0.55mi | 2/1.0 (-1) | 1,188 (-14%) | 12mo | $214,900 | $181 | 32 |
Match score weights: distance 35% · size 25% · config 20% · recency 20%. Top-matched comps best support the ARV.
Projected returns pro-forma
-3.0% appreciation · 3.31% rent growth · sell at horizon
- IRR
- 7.9%
- Equity multiple
- 1.31×
- Total profit
- $12,047
- Equity at exit
- $20,576
- IRR
- 17.4%
- Equity multiple
- 2.46×
- Total profit
- $56,355
- Equity at exit
- $11,932
Cash invested: $38,640 (down + closing). Projections, not guarantees.
Landlord ↔ Tenant lean methodology
- Overall (STATE)
- 83 Strongly Landlord-Friendly
- State Nebraska
- 83 Strongly Landlord-Friendly · R+13
- County
- — inherits STATE
- City
- — inherits STATE
ZIP-level market 68701
- Rents YoY
- 3.3%
- Active inventory
- 230
- Price-to-rent
- 6.4×
Monthly cashflow live
- Estimated rent
- $1,795 medium interval (Pro) →
- Mortgage (P&I)
- −$724
- Tax from tax record
- −$105 /mo · $1,265/yr
- Insurance
- −$58
- HOA
- −$0
- Vacancy / Maint / Mgmt
- −$377
- Net cashflow
- $532
Break-even live
Sensitivity live
| Price | -10% $610 | -5% $571 | +0% $532 | +5% $493 | +10% $454 |
|---|---|---|---|---|---|
| Rent | -10% $390 | -5% $461 | +0% $532 | +5% $603 | +10% $673 |
| Rate | -1.0pp $601 | -0.5pp $567 | base $532 | +0.5pp $496 | +1.0pp $460 |
UW: 25.0% down · 7.5% · 30yr · 1.5% tax · 5.0% vac · 8.0% maint · 8.0% mgmt
Financing live
Cash to close
- Down payment
- $34,500
- Closing costs
- $4,140
- Reserves months
- —
- Total cash needed
- —
Loan-product check · same deal, 3 products live
Conventional
25% down · 7.5% · 30yr
- Down + closing
- —
- Monthly P&I
- —
- Monthly cashflow
- —
- DSCR
- —
- Eligible?
- —
Personal DTI + credit; lowest rate.
DSCR
20% down · 8.5% · 30yr
- Down + closing
- —
- Monthly P&I
- —
- Monthly cashflow
- —
- DSCR
- —
- Eligible?
- —
No personal income docs; deal must DSCR.
Hard money
10% down · 12.0% · 12mo
- Down + closing
- —
- Monthly P&I
- —
- Monthly cashflow
- —
- DSCR
- —
- Eligible?
- —
Short-term bridge; refi at stabilization.
Rent comps 4 comps
| Address | Beds | Baths | Sqft | Rent | $/sqft | DOM | Units | Dist |
|---|---|---|---|---|---|---|---|---|
| 1208 Koenigstein Ave Norfolk, NE | 3.0 | 1.5 | 1140 | $2,200 | $1.93 | 44d | 1 | 0.26mi |
| 1401 Lakewood Dr Norfolk, NE | 2.0–3.0 | 1.0–1.5 | 937 | $1,345 | $1.43 | 24d | 2 | 1.31mi |
| 901 Syracuse Ave Norfolk, NE | 2.0 | 1.0 | 1000 | $1,095 | $1.09 | 44d | 1 | 1.35mi |
| 1303 Galeta Ave Norfolk, NE | 2.0 | 1.0 | 900 | $1,270 | $1.41 | 19d | 1 | 1.43mi |
Listing history 5 events
-
2026-04-15status Pending
-
2026-04-06price $138,000
-
2026-03-28price $149,900
-
2026-03-03price $155,000
-
2026-01-30$165,000 Active
ⓘ Source: listings_history table (triggers on properties + properties_extension) + one-shot
backfill from property_details.listing_events for pre-trigger history.
Tax reassessment forecast NE · Resets to sale price
- Current annual tax
- $1,265 · $105/mo
- Projected year-2 tax
- $2,387 · $199/mo
- Expected delta
- +$1,123/yr (+$94/mo · 88.8%)
ⓘ Screening estimate from a state-policy table — verify with the county assessor before closing.
Climate risk First Street
- Flood 1/10 Low FEMA zone X (unshaded) · 0% chance over 30 yrs
- Wildfire 1/10 Low
- Heat 3/10 Moderate 7 d/yr ≥102°F today · 15 d/yr by 30 yrs out
- Wind 2/10 Low
- Air quality 2/10 Low 1 unhealthy d/yr today · 1 by 30 yrs out
Nearby sold comps map
Loading sold comps map…
Walkable amenities ~0.75 mi
Loading nearby amenities…
Taxation est. · year 1
- Rental income
- $21,543
- − Mortgage interest
- −$7,730
- − Property taxes
- −$1,265
- − Insurance
- −$690
- − Repairs & maintenance
- −$1,723
- − Management
- −$1,723
- − Depreciation
- −$4,015
- Taxable income
- $4,397
- Est. tax owed @ 24.0%
- −$1,055
- After-tax cash flow
- $5,325/yr
For passive investors: Depreciation is non-cash, so a rental often shows a tax loss while cash-flowing — sheltering income. Rental losses are passive: they offset passive income freely, and up to $25,000/yr can offset ordinary (W-2) income if you actively participate and your MAGI is under $100k (phasing out to $0 by $150k); unused losses carry forward. On sale, claimed depreciation is recaptured at up to 25%, and gains may owe capital-gains tax (a 1031 exchange can defer both). Figures are a year-1 estimate at your 24.0% rate — not tax advice; consult a CPA.
Schools (NCES district)
- District
- Norfolk Public Schools
- NCES district ID
- 3174430
- Math proficiency
- 44% ▼ -7.00%
- Reading proficiency
- 46% ▼ -7.00%
- Median HH income
- $46,579
- Composite
- 38.31/100
- National rank
- #4227
- State rank
- #84 of 111 in NE
Livability — Norfolk
- Score
- 78/100
- State rank
- #54
- US rank
- #2611
Category grades
Schools grade is shown separately in the Schools card above.
Census & demographics
- Census place
- Norfolk, NE
- County
- Madison County · 31,417 people
- City population
- 31,417
- Metro
- Norfolk, NE
- Population (ZIP)
- 31,417
- Household income
- $62,633
- Rent vs Own
- Severe rent burden
- 861.0
Population outlook (Madison County) Hauer SSP2
- Today (2025)
- 35,536 people
- By 2030
- 35,518 · -0.1%
- By 2040
- 35,170 · -1.0%
- By 2050
- 34,606 · -2.6%
- By 2075
- 34,522 · -2.9%
- By 2100
- 34,307 · -3.5%
Race, ethnicity, and origin ACS 2023
- Neighborhood character
- Predominantly White (80%)
- Race & ethnicity
- White 80% Hispanic / Latino 14% Two or more races 9% Native American 1% Black 1%
- Hispanic origin (detail)
- Mexican 11% Cuban 1%
- Common ancestry
- Portuguese 2% Romanian 1% Lithuanian 1%
- Foreign-born
- 6% · Canada
- Languages at home
- 90% English-only · Spanish 9%
Political lean MEDSL · Madison
- 2024 margin
- Solid R (+56.0) · D 21.4% · R 77.4% · Other 1.2%
- 2008→2024 swing
- -16.8pp toward R · 2008: -39.2pp · 2024: -56.0pp
- All cycles
- 2024: R+56.0 2020: R+53.5 2016: R+56.3 2012: R+48.1 2008: R+39.2
Not yet ingested
- Civics
- —
Market trends
- HPI YoY
- ▼ -172.61%
- Current HPI
- 260.5574
- Rent YoY
- ▲ 3.31%
- Metro
- Norfolk, NE
- State GDP YoY
- ▲ 0.68%
- F500 in state
- 2
Industry mix (Fortune 500 HQ in NE)
| Industry | F500 HQs | Revenue |
|---|---|---|
| Conglomerate | 1 | $371B |
|
||
Price history
-16.4% since first listed5 events — show timeline
- 2026-04-15 Pending — NNEMLS
- 2026-04-06 Price Changed $138,000 NNEMLS
- 2026-03-28 Price Changed $149,900 NNEMLS
- 2026-03-03 Price Changed $155,000 NNEMLS
- 2026-01-30 Listed $165,000 NNEMLS
Property tax history
+4.2%/yrLatest (2025): $1,265 · +0.0% YoY. Source: county tax records.
Cash-flow waterfall
monthlySold comps — $/sqft
last 12 mo · ≤1 miLoading sold comps…