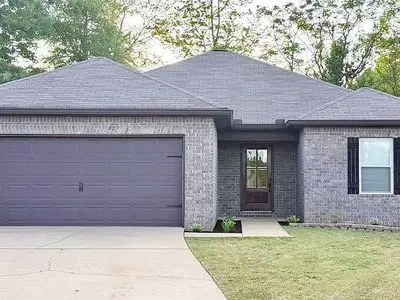
200 Roscommon Rd · Tuscaloosa, AL
Flood risk 1/10 · Minimal
- FEMA flood zone
- X (unshaded)
- Chance of flooding over 30 yrs
- 0.0%
- Est. flood insurance / yr
- $507 – $1,088
Fire risk 3/10 · Minor
- Est. fire insurance / yr
- $916 – $1,700
Heat risk 8/10 · Major
- Hot days now (above 108°F)
- 7 days/yr
- Hot days in 30 yrs
- 22 days/yr
Wind risk 6/10 · Moderate
- Chance of severe wind over 30 yrs
- 59.0%
Air-quality risk 2/10 · Minimal
- Unhealthy air days now
- 0 days/yr
- Unhealthy air days in 30 yrs
- 1 days/yr
Risk factors via First Street. Map © Google.
Why this score? — see what drove the D- grade
The composite is a weighted blend of 9 inputs, each scored 0–100. Each bar is that input's sub-score; the figure is the points it added to the 100-point composite (weight × sub-score).
- Cash flow +12.6/30.0
- ARV discount +7.0/15.0
- Rent growth +3.9/5.0
- Livability +3.9/5.0
- DSCR +3.7/10.0
- Schools +2.9/10.0
- 1% rule +2.5/10.0
- Condition / age +2.5/5.0
- Appreciation +0.0/10.0
$239,900
🖨 Deal sheet (PDF) 📄 Offer letter ✓ Due diligence
Listing remarks MLS
sold before published
Key facts
- Walk-in closets
- Open layout
- Covered patio
Tags
Neighborhood map
What this means for you Summary
Snapshot
- This is a 3-bed/2.0-bath single-family listed at $240k.
Deal economics
- At list price, monthly cash flow is $-32 ($-385/yr) — negative.
- To cash-flow at today's rent, offer at most $234k (2.4% below list).
- To meet the 1% rule (rent ≥ 1% of price), the offer needs to be $180k (24.9% below list).
- Recommended offer: $180k (24.9% below list) — sets the bar for 1% rule.
- Cap rate 6.1% vs local median 3.4% in Tuscaloosa — top-decile yield for the area; either an underpriced asset or a hidden risk that comps aren't pricing in. Stress-test before assuming the spread holds.
Location & tenants
- Location reads 77/100 on livability (#9 in AL, #2,909 nationally) — a middle-class / working-renter tenant base. Strengths: amenities A+, health & safety A+, cost of living A; Watch: crime F, employment D-.
- Tuscaloosa County (suburban): math 21% / reading 45% proficiency, ranked #47 of 129 in AL (top 36%) — families likely to look elsewhere, expect single-tenant / working-renter base with shorter leases.
- Market conditions: Rents rising fast (+5.4%/yr); 462 active listings in the ZIP; 13 comparable units currently listed for rent nearby; rentals lingering (median 46d on market — plan ~5-8 weeks vacancy on turnover, expect pricing pressure); 85% of comp listings sitting > 30 days — soft ceiling on asking rent; 622 units permitted in Tuscaloosa County in 2024 (69 in 5+ unit buildings).
- This rent runs 35% of the median local income ($62k/yr) — at the standard rent-burdened threshold; future hikes will face affordability resistance.
Forward outlook
- Local home prices are declining (-3.0%/yr); year-one equity from $2k of loan paydown is wiped out by about $7k of value loss. Plan a longer hold.
- Tuscaloosa County population projected at +26% by 2050 — long-run rental-demand tailwind backs the buy-and-hold thesis.
Negotiation context
- It's been on market 34 days — a 3% lower offer ($233k) is reasonable based on typical stale-listing flexibility.
Risks & watch-outs
- Climate carrying-cost: major wind risk, 59% chance of damaging wind over 30y; extreme-heat days projected 7→22/yr by 2055 (HVAC capex compounding) — expect insurance premiums to compound above CPI over the hold.
Questions for the listing agent
- What do current leases actually rent for vs. the listed asking? Can we see a recent rent roll and the last 12 months of T-12 income?
- It's been on market 34 days. Have you received any prior offers? Is the seller open to a 25% concession, seller financing, or rate buy-down credit?
- Is there a deadline driving the sale (1031 exchange, divorce, estate, relocation)? That informs how much negotiation room exists.
- Crime grade is F in this area — have there been break-ins, vandalism, or insurance claims at this property in the last 3 years? What carrier currently insures it and at what premium?
- The area grade is low — what's the realistic commute time and amenity access for the typical tenant pool here? Any planned neighborhood developments (good or bad) we should know about?
- What's the average days-on-market for RENTAL listings here right now (not sales)? A rising rental-DOM trend means longer vacancies and softer asking-rent achievability than the comps imply.
- What's the recent tenant-quality profile in this submarket — average credit score on applications, eviction rate, late-payment / NSF rate, and stable-employment percentage? A property-management company in the area should have these aggregated.
- How much new for-sale + rental construction is in the pipeline within 1–3 miles? Heavy new supply typically softens prices + rents 12–24 months out; constrained supply supports both.
Investment metrics
- 1% rule
- 0.75% ✗
- Cap rate
- 6.13%
- Cash-on-cash
- -0.57%
- DSCR
- 0.97
- GRM
- 11.1
CMA / ARV
- ARV (median comp)
- $237,515
- List price
- $239,900
- Delta
- 1.00%
- Verdict
- FAIR
- Comps
- 20 within 1.0 mi
Show comp detail 12 sales within ~0.75 mi
| Address | Dist | Beds/Ba | Sqft | Sold | Price | $/sf | Match |
|---|---|---|---|---|---|---|---|
| 200 Roscommon Rd | 0.00mi | 3/2.0 | 1,380 (0%) | 0mo | $230,000 | $167 | 100 |
| 198 Wexford Way Way | 0.05mi | 3/2.0 | 1,339 (-3%) | 0mo | $215,000 | $161 | 93 |
| 128 Roscommon Rd Rd | 0.16mi | 3/2.0 | 1,438 (+4%) | 3mo | $235,000 | $163 | 83 |
| 165 Roscommon Rd | 0.08mi | 3/2.0 | 1,473 (+7%) | 7mo | $215,000 | $146 | 79 |
| 162 Wexford Way | 0.11mi | 3/2.0 | 1,269 (-8%) | 6mo | $214,900 | $169 | 76 |
| 9046 Cotton Field Cir | 0.23mi | 3/2.0 | 1,478 (+7%) | 5mo | $204,150 | $138 | 74 |
| 125 Roscommon Rd | 0.17mi | 3/2.0 | 1,272 (-8%) | 9mo | $225,000 | $177 | 71 |
| 335 Old Bridge Rd | 0.36mi | 3/2.0 | 1,508 (+9%) | 3mo | $258,900 | $172 | 65 |
| 333 Prairie Field Drive Dr | 0.50mi | 3/2.0 | 1,465 (+6%) | 6mo | $255,900 | $175 | 61 |
| 402 Barn Wood Rd | 0.34mi | 3/2.0 | 1,570 (+14%) | 7mo | $254,900 | $162 | 55 |
| 9332 Parkway Gardens Loop | 0.65mi | 4/2.0 (+1) | 1,497 (+8%) | 3mo | $284,900 | $190 | 48 |
| 9218 Parkway Gardens Loop | 0.68mi | 4/2.0 (+1) | 1,497 (+8%) | 3mo | $274,900 | $184 | 47 |
Match score weights: distance 35% · size 25% · config 20% · recency 20%. Top-matched comps best support the ARV.
Projected returns pro-forma
-3.0% appreciation · 5.42% rent growth · sell at horizon
- IRR
- -14.9%
- Equity multiple
- 0.46×
- Total profit
- $-36,521
- Equity at exit
- $35,770
- IRR
- -3.1%
- Equity multiple
- 0.77×
- Total profit
- $-15,450
- Equity at exit
- $20,742
Cash invested: $67,172 (down + closing). Projections, not guarantees.
Landlord ↔ Tenant lean methodology
- Overall (STATE)
- 90 Strongly Landlord-Friendly
- State Alabama
- 90 Strongly Landlord-Friendly · R+15
- County
- — inherits STATE
- City
- — inherits STATE
ZIP-level market 35405
- Home prices YoY
- -26.9%
- Rents YoY
- 5.4%
- Active inventory
- 462
- Price-to-rent
- 11.1×
Monthly cashflow live
- Estimated rent
- $1,802 high interval (Pro) →
- Mortgage (P&I)
- −$1,258
- Tax from tax record
- −$98 /mo · $1,171/yr
- Insurance
- −$100
- HOA
- −$0
- Vacancy / Maint / Mgmt
- −$378
- Net cashflow
- $-32
Break-even live
Sensitivity live
| Price | -10% $104 | -5% $36 | +0% $-32 | +5% $-100 | +10% $-168 |
|---|---|---|---|---|---|
| Rent | -10% $-174 | -5% $-103 | +0% $-32 | +5% $39 | +10% $110 |
| Rate | -1.0pp $89 | -0.5pp $29 | base $-32 | +0.5pp $-94 | +1.0pp $-157 |
UW: 25.0% down · 7.5% · 30yr · 1.5% tax · 5.0% vac · 8.0% maint · 8.0% mgmt
Financing live
Cash to close
- Down payment
- $59,975
- Closing costs
- $7,197
- Reserves months
- —
- Total cash needed
- —
Loan-product check · same deal, 3 products live
Conventional
25% down · 7.5% · 30yr
- Down + closing
- —
- Monthly P&I
- —
- Monthly cashflow
- —
- DSCR
- —
- Eligible?
- —
Personal DTI + credit; lowest rate.
DSCR
20% down · 8.5% · 30yr
- Down + closing
- —
- Monthly P&I
- —
- Monthly cashflow
- —
- DSCR
- —
- Eligible?
- —
No personal income docs; deal must DSCR.
Hard money
10% down · 12.0% · 12mo
- Down + closing
- —
- Monthly P&I
- —
- Monthly cashflow
- —
- DSCR
- —
- Eligible?
- —
Short-term bridge; refi at stabilization.
Rent comps 13 comps
| Address | Beds | Baths | Sqft | Rent | $/sqft | DOM | Units | Dist |
|---|---|---|---|---|---|---|---|---|
| 146 Wexford Way Tuscaloosa, AL | 4.0 | 2.0 | 1498 | $1,745 | $1.16 | 23d | 1 | 0.13mi |
| 9046 Cotton Field Cir Tuscaloosa, AL | 3.0 | 2.0 | 1478 | $1,645 | $1.11 | 45d | 1 | 0.20mi |
| 9332 Parkway Gardens Loop Tuscaloosa, AL | 4.0 | 2.0 | 1497 | $1,706 | $1.14 | 45d | 1 | 0.64mi |
| 9212 Parkway Gardens Loop Tuscaloosa, AL | 4.0 | 2.0 | 1774 | $1,796 | $1.01 | 45d | 1 | 0.66mi |
| 9230 Parkway Gardens Loop Tuscaloosa, AL | 4.0 | 2.0 | 1774 | $1,995 | $1.12 | 45d | 1 | 0.69mi |
| 9576 Havenridge Loop Tuscaloosa, AL | 3.0 | 2.0 | 1493 | $1,795 | $1.20 | 45d | 1 | 0.72mi |
| 9594 Havenridge Loop Tuscaloosa, AL | 3.0 | 2.0 | 1679 | $1,795 | $1.07 | 45d | 1 | 0.73mi |
| 9295 Havenridge Loop Tuscaloosa, AL | 4.0 | 2.0 | 1583 | $1,745 | $1.10 | 45d | 1 | 0.87mi |
| 801 Stonebrook Cir Tuscaloosa, AL | 2.0–3.0 | 2.0–2.5 | 1397 | $2,500 | $1.79 | 23d | 11 | 1.41mi |
| 815 Stonebrook Cir Tuscaloosa, AL | 3.0 | 2.5 | 1745 | $2,450 | $1.40 | 45d | 1 | 1.42mi |
| 820 Stonebrook Ln Tuscaloosa, AL | 3.0 | 2.5 | 1745 | $2,450 | $1.40 | 45d | 1 | 1.47mi |
| 1009 Stonebrook Ln Tuscaloosa, AL | 3.0 | 2.5 | 1745 | $2,450 | $1.40 | 45d | 1 | 1.47mi |
| 984 Stonebrook Ln Tuscaloosa, AL | 3.0 | 2.5 | 1745 | $2,450 | $1.40 | 45d | 1 | 1.50mi |
Listing history 21 events
-
2026-06-16status $239,900 Under Contract 34 DOM
-
2026-06-15days on market $239,900 Active 34 DOM
-
2026-06-14days on market $239,900 Active 32 DOM
-
2026-06-13days on market $239,900 Active 31 DOM
-
2026-06-10days on market $239,900 Active 29 DOM
-
2026-06-09days on market $239,900 Active 28 DOM
-
2026-06-08days on market $239,900 Active 27 DOM
-
2026-06-07days on market $239,900 Active 26 DOM
-
2026-06-05days on market $239,900 Active 23 DOM
-
2026-06-03days on market $239,900 Active 22 DOM
-
2026-06-02days on market $239,900 Active 21 DOM
-
2026-06-01days on market $239,900 Active 20 DOM
-
2026-05-31days on market $239,900 Active 19 DOM
-
2026-05-30days on market $239,900 Active 18 DOM
-
2026-05-13price $239,900 1506-char remark
-
2026-05-12$244,900 Active 1506-char remark
-
2018-01-31soldstatus $154,000 347-char remark
Show marketing remark (347 chars)
Amenities galore! This move-in ready, one owner home features cul-de-sac lot, private backyard, ceramic tile in the kitchen, bathrooms and laundry, oversized laundry room, 2 car garage, his & hers closets in the master, split floorplan, trey ceilings, open concept kitchen & living area, covered back porch, black appliances, and MORE!
-
2018-01-31soldstatus $154,000
Show marketing remark (347 chars)
Amenities galore! This move-in ready, one owner home features cul-de-sac lot, private backyard, ceramic tile in the kitchen, bathrooms and laundry, oversized laundry room, 2 car garage, his & hers closets in the master, split floorplan, trey ceilings, open concept kitchen & living area, covered back porch, black appliances, and MORE!
-
2017-12-18$152,900 347-char remark
Show marketing remark (347 chars)
Amenities galore! This move-in ready, one owner home features cul-de-sac lot, private backyard, ceramic tile in the kitchen, bathrooms and laundry, oversized laundry room, 2 car garage, his & hers closets in the master, split floorplan, trey ceilings, open concept kitchen & living area, covered back porch, black appliances, and MORE!
-
2012-06-13soldstatus $137,395
-
2012-02-22soldstatus $105,500
ⓘ Source: listings_history table (triggers on properties + properties_extension) + one-shot
backfill from property_details.listing_events for pre-trigger history.
Tax reassessment forecast AL · Resets to sale price
- Current annual tax
- $1,171 · $98/mo
- Projected year-2 tax
- $1,171 · $98/mo
- Expected delta
- $0/yr ($0/mo · 0.0%)
ⓘ Screening estimate from a state-policy table — verify with the county assessor before closing.
Climate risk First Street
- Flood 1/10 Low FEMA zone X (unshaded) · 0% chance over 30 yrs
- Wildfire 3/10 Moderate
- Heat 8/10 Severe 7 d/yr ≥108°F today · 22 d/yr by 30 yrs out
- Wind 6/10 Major 59% chance of damaging wind over 30 yrs
- Air quality 2/10 Low 0 unhealthy d/yr today · 1 by 30 yrs out
Nearby sold comps map
Loading sold comps map…
Walkable amenities ~0.75 mi
Loading nearby amenities…
Taxation est. · year 1
- Rental income
- $21,624
- − Mortgage interest
- −$13,438
- − Property taxes
- −$1,171
- − Insurance
- −$1,200
- − Repairs & maintenance
- −$1,730
- − Management
- −$1,730
- − Depreciation
- −$6,979
- Taxable loss
- −$4,624
- Est. tax savings @ 24.0%
- +$1,110
- After-tax cash flow
- $725/yr
For passive investors: Depreciation is non-cash, so a rental often shows a tax loss while cash-flowing — sheltering income. Rental losses are passive: they offset passive income freely, and up to $25,000/yr can offset ordinary (W-2) income if you actively participate and your MAGI is under $100k (phasing out to $0 by $150k); unused losses carry forward. On sale, claimed depreciation is recaptured at up to 25%, and gains may owe capital-gains tax (a 1031 exchange can defer both). Figures are a year-1 estimate at your 24.0% rate — not tax advice; consult a CPA.
Schools (NCES district)
- District
- Tuscaloosa County
- NCES district ID
- 0103390
- Math proficiency
- 21% ▼ -24.00%
- Reading proficiency
- 45% ▲ 2.00%
- Median HH income
- $53,000
- Composite
- 28.88/100
- National rank
- #6641
- State rank
- #47 of 129 in AL
Livability — Tuscaloosa
- Score
- 77/100
- State rank
- #9
- US rank
- #2909
Category grades
Schools grade is shown separately in the Schools card above.
Census & demographics
- County
- Tuscaloosa County · 206,491 people
- City population
- 134,228
- Metro
- Tuscaloosa, AL
- Population (ZIP)
- 49,420
- Household income
- $62,301
- Rent vs Own
- Severe rent burden
- 1963.0
Population outlook (Tuscaloosa County) Hauer SSP2
- Today (2025)
- 228,293 people
- By 2030
- 240,551 · +5.4%
- By 2040
- 263,856 · +15.6%
- By 2050
- 286,491 · +25.5%
- By 2075
- 335,783 · +47.1%
- By 2100
- 370,520 · +62.3%
Race, ethnicity, and origin ACS 2023
- Neighborhood character
- Diverse neighborhood (Simpson 0.56)
- Race & ethnicity
- Black 56% White 35% Hispanic / Latino 5% Two or more races 3% Asian 2%
- Hispanic origin (detail)
- Mexican 2%
- Common ancestry
- Italian 1% Lithuanian 1% Slovak 1%
- Foreign-born
- 5% · Canada, China
- Languages at home
- 94% English-only · Spanish 4% Other Indo-European 1% Chinese 1%
Political lean MEDSL · Tuscaloosa
- 2024 margin
- Strong R (+20.4) · D 39.4% · R 59.8%
- 2008→2024 swing
- -4.4pp toward R · 2008: -16.0pp · 2024: -20.4pp
- All cycles
- 2024: R+20.4 2020: R+14.8 2016: R+19.5 2012: R+17.4 2008: R+16.0
Not yet ingested
- Civics
- —
Market trends
- HPI YoY
- ▼ -71.25%
- Current HPI
- 193.1929
- Rent YoY
- ▲ 5.42%
- Metro
- Tuscaloosa, AL
- State GDP YoY
- ▲ 2.94%
- F500 in state
- 4
Industry mix (Fortune 500 HQ in AL)
| Industry | F500 HQs | Revenue |
|---|---|---|
| Financial Services | 1 | $8B |
|
||
| Healthcare | 1 | $5B |
|
||
Price history
+118.0% since first listed6 events — show timeline
- 2026-06-17 Sold (MLS) $230,000 WAMLS
- 2018-01-31 Sold (Public Records) $154,000 Public Records
- 2018-01-31 Sold (MLS) $154,000 WAMLS
- 2017-12-18 Listed $152,900 WAMLS
- 2012-06-13 Sold (Public Records) $137,395 Public Records
- 2012-02-22 Sold (Public Records) $105,500 Public Records
Property tax history
+12.4%/yrLatest (2025): $1,171 · +7.0% YoY. Source: county tax records.
Cash-flow waterfall
monthlySold comps — $/sqft
last 12 mo · ≤1 miLoading sold comps…