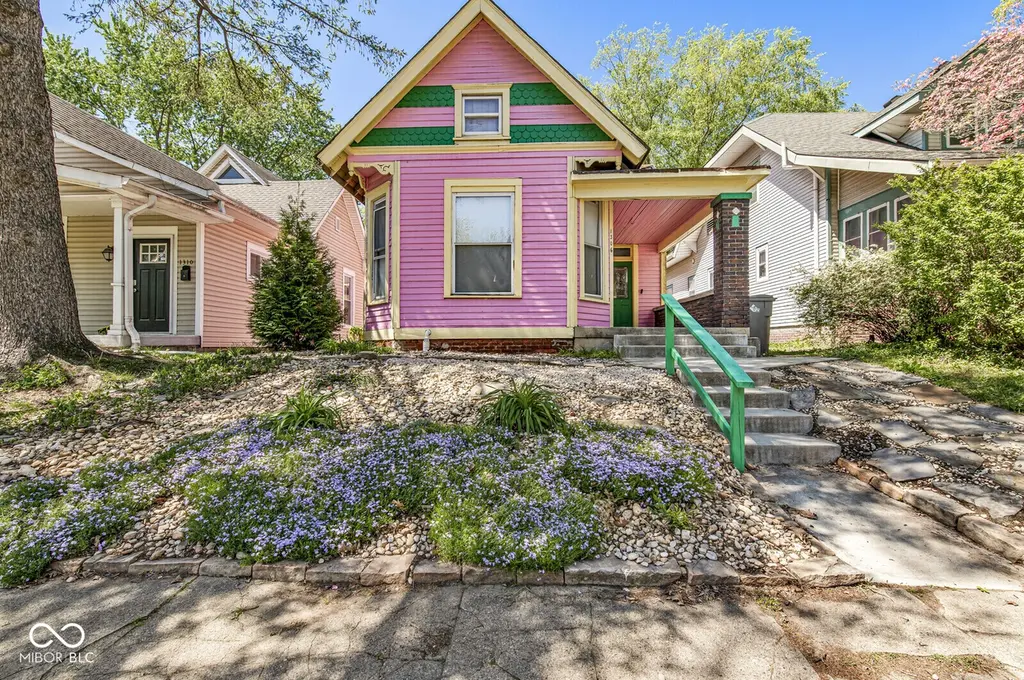
1306 Wright St · Indianapolis city (balance), IN
Flood risk 1/10 · Minimal
- FEMA flood zone
- X (unshaded)
- Chance of flooding over 30 yrs
- 0.0%
- Est. flood insurance / yr
- $473 – $860
Fire risk 1/10 · Minimal
- Est. fire insurance / yr
- $717 – $1,331
Heat risk 4/10 · Minor
- Hot days now (above 101°F)
- 7 days/yr
- Hot days in 30 yrs
- 19 days/yr
Wind risk 2/10 · Minimal
- Chance of severe wind over 30 yrs
- 1.0%
Air-quality risk 3/10 · Minor
- Unhealthy air days now
- 2 days/yr
- Unhealthy air days in 30 yrs
- 3 days/yr
Risk factors via First Street. Map © Google.
Why this score? — see what drove the C- grade
The composite is a weighted blend of 9 inputs, each scored 0–100. Each bar is that input's sub-score; the figure is the points it added to the 100-point composite (weight × sub-score).
- Cash flow +18.0/30.0
- ARV discount +15.0/15.0
- DSCR +5.6/10.0
- 1% rule +4.3/10.0
- Rent growth +3.2/5.0
- Livability +2.5/5.0
- Condition / age +2.5/5.0
- Schools +1.4/10.0
- Appreciation +0.0/10.0
$199,900
🖨 Deal sheet 📄 Offer letter ✓ Due diligence
Listing remarks MLS
Great opportunity in the up & coming Bates-Hendricks neighborhood! Much work has been done making this a great rental or for a do-it-yourselfer looking for some quick equity! New in kitchen: tile floor, cabinets, c’top & sink w/disposal. Bath w/new tile floor, vanity & tub/shower! Brand new carpet. Lots of charm remains as well w/tall ceilings, built-in china hutch, craftsman style staircase & transom windows. Big covered porch, fenced yard & parking spaces behind house! Being sold AS-IS.
Key facts
- Original built ins
- High ceilings
- Covered back porch
Tags
Property features AI
Exterior
- Parking: Alley access
- Utilities: Public water; Municipal sewer connection; Solid waste service available
- Home design: Single family residence; Two levels; Fixer condition
- Construction: Wood siding exterior; Concrete perimeter and brick/mortar foundation
- Exterior features: Covered patio/porch; City lot with sidewalks
Interior
- Kitchen: Down draft; Electric oven; Refrigerator; Disposal; Exhaust fan
- Bedrooms: Primary bedroom includes a sitting room; Two upper-level bedrooms
- Flooring: Hardwood floors
- Bathrooms: One full bathroom on the upper level with a full tub
- Heating & cooling: Forced air heating (natural gas); Central air conditioning
- Interior features: Hardwood floors; Unfinished basement
- Laundry & utility: Washer; Dryer; Gas water heater
Neighborhood map
What this means for you Summary
Snapshot
- This is a 3-bed/1.0-bath single-family listed at $200k.
Deal economics
- At list price, monthly cash flow is $172 ($2k/yr) — positive.
- The deal already cash-flows at list — no discount required.
- To meet the 1% rule (rent ≥ 1% of price), the offer needs to be $187k (6.5% below list).
- Recommended offer: $187k (6.5% below list) — sets the bar for 1% rule.
- Cap rate 7.3% vs local median 4.4% in Indianapolis city (balance) — top-decile yield for the area; either an underpriced asset or a hidden risk that comps aren't pricing in. Stress-test before assuming the spread holds.
Location & tenants
- Location reads: area grade C — affects rentability + tenant quality, not the cash-flow math above.
- Indianapolis Public Schools (urban): math 14% / reading 20% proficiency, ranked #286 of 301 in IN (top 95%) — low school quality limits family demand, transient renter base, plan for 1-2y turnover; 77% free/reduced lunch — lower-income household profile, screen leases tightly.
- Market conditions: Rents rising (+2.9%/yr); 493 active listings in the ZIP; 40 comparable units currently listed for rent nearby; rentals at typical pace (median 24d on market — plan ~3-4 weeks tenant-placement turnaround); 1,906 units permitted in Marion County in 2024 (621 in 5+ unit buildings).
- This rent runs 39% of the median local income ($57k/yr) — at the standard rent-burdened threshold; future hikes will face affordability resistance.
Forward outlook
- Local home prices are declining (-3.0%/yr); year-one equity from $1k of loan paydown is wiped out by about $6k of value loss. Plan a longer hold.
- Marion County population projected at +18% by 2050 — long-run rental-demand tailwind backs the buy-and-hold thesis.
Negotiation context
- It's been on market 56 days — a 3% lower offer ($194k) is reasonable based on typical stale-listing flexibility.
- 5 sale attempts since 20y ago with the ask held roughly flat each time — persistent listings suggest the price (not the market) is what's stuck; bring a comps-based counter.
- Current owner paid $89k; list at $200k implies a 125% gain — meaningful room to come down on a strong offer.
Risks & watch-outs
- Watch-outs: built in 1860 — expect roof / HVAC / electrical / plumbing capex.
Questions for the listing agent
- It's been on market 56 days. Have you received any prior offers? Is the seller open to a 7% concession, seller financing, or rate buy-down credit?
- Built in 1860 — when were the roof, HVAC, electrical panel, plumbing, and water heater last replaced?
- Is there a deadline driving the sale (1031 exchange, divorce, estate, relocation)? That informs how much negotiation room exists.
- What's the average days-on-market for RENTAL listings here right now (not sales)? A rising rental-DOM trend means longer vacancies and softer asking-rent achievability than the comps imply.
- What's the recent tenant-quality profile in this submarket — average credit score on applications, eviction rate, late-payment / NSF rate, and stable-employment percentage? A property-management company in the area should have these aggregated.
- How much new for-sale + rental construction is in the pipeline within 1–3 miles? Heavy new supply typically softens prices + rents 12–24 months out; constrained supply supports both.
Investment metrics
- 1% rule
- 0.93% ✗
- Cap rate
- 7.33%
- Cash-on-cash
- 3.69%
- DSCR
- 1.16
- GRM
- 8.9
CMA / ARV
- ARV (median comp)
- $331,350
- List price
- $199,900
- Delta
- -39.67%
- Verdict
- UNDERPRICED
- Comps
- 20 within 1.0 mi
Show comp detail 12 sales within ~0.75 mi
| Address | Dist | Beds/Ba | Sqft | Sold | Price | $/sf | Match |
|---|---|---|---|---|---|---|---|
| 746 Parkway Ave | 0.02mi | 3/2.0 | 1,628 (+1%) | 2mo | $251,000 | $154 | 91 |
| 619 Prospect St | 0.23mi | 3/1.5 | 1,564 (-3%) | 1mo | $264,000 | $169 | 82 |
| 711 Terrace Ave | 0.12mi | 3/2.0 | 1,475 (-8%) | 1mo | $323,500 | $219 | 76 |
| 1034 Elm St | 0.52mi | 3/2.0 | 1,587 (-1%) | 0mo | $385,000 | $243 | 69 |
| 1202 Hartford St | 0.15mi | 3/3.5 | 1,480 (-8%) | 2mo | $330,000 | $223 | 68 |
| 830 Olive St | 0.56mi | 3/2.0 | 1,618 (+1%) | 2mo | $335,000 | $207 | 68 |
| 1152 Lexington Ave | 0.61mi | 2/1.0 (-1) | 1,596 (-1%) | 1mo | $148,000 | $93 | 64 |
| 1205 Hoyt Ave | 0.66mi | 2/1.0 (-1) | 1,581 (-2%) | 0mo | $237,000 | $150 | 61 |
| 1125 Laurel St | 0.58mi | 3/2.0 | 1,731 (+8%) | 1mo | $350,000 | $202 | 55 |
| 1250 Union St | 0.65mi | 3/1.5 | 1,440 (-10%) | 1mo | $200,000 | $139 | 50 |
| 935 Spruce St | 0.72mi | 2/1.0 (-1) | 1,788 (+11%) | 1mo | $300,000 | $168 | 42 |
| 2125 S Garfield Dr | 0.74mi | 3/2.5 | 1,820 (+13%) | 1mo | $285,000 | $157 | 37 |
Match score weights: distance 35% · size 25% · config 20% · recency 20%. Top-matched comps best support the ARV.
Projected returns pro-forma
-3.0% appreciation · 2.88% rent growth · sell at horizon
- IRR
- -10.6%
- Equity multiple
- 0.61×
- Total profit
- $-21,673
- Equity at exit
- $29,806
- IRR
- -1.5%
- Equity multiple
- 0.90×
- Total profit
- $-5,757
- Equity at exit
- $17,284
Cash invested: $55,972 (down + closing). Projections, not guarantees.
Landlord ↔ Tenant lean methodology
- Overall (STATE)
- 90 Strongly Landlord-Friendly
- State Indiana
- 90 Strongly Landlord-Friendly · R+11
- County
- — inherits STATE
- City
- — inherits STATE
ZIP-level market 46203
- Home prices YoY
- -26.7%
- Rents YoY
- 2.9%
- Active inventory
- 493
- Price-to-rent
- 8.9×
Monthly cashflow live
- Estimated rent
- $1,868 high interval (Pro) →
- Mortgage (P&I)
- −$1,048
- Tax from tax record
- −$172 /mo · $2,069/yr
- Insurance
- −$83
- HOA
- −$0
- Vacancy / Maint / Mgmt
- −$392
- Net cashflow
- $172
Break-even live
UW: 25.0% down · 7.5% · 30yr · 1.5% tax · 5.0% vac · 8.0% maint · 8.0% mgmt
Financing live
Cash to close
- Down payment
- $49,975
- Closing costs
- $5,997
- Reserves months
- —
- Total cash needed
- —
Loan-product check · same deal, 3 products live
Conventional
25% down · 7.5% · 30yr
- Down + closing
- —
- Monthly P&I
- —
- Monthly cashflow
- —
- DSCR
- —
- Eligible?
- —
Personal DTI + credit; lowest rate.
DSCR
20% down · 8.5% · 30yr
- Down + closing
- —
- Monthly P&I
- —
- Monthly cashflow
- —
- DSCR
- —
- Eligible?
- —
No personal income docs; deal must DSCR.
Hard money
10% down · 12.0% · 12mo
- Down + closing
- —
- Monthly P&I
- —
- Monthly cashflow
- —
- DSCR
- —
- Eligible?
- —
Short-term bridge; refi at stabilization.
Rent comps 40 comps
| Address | Beds | Baths | Sqft | Rent | $/sqft | DOM | Units | Dist |
|---|---|---|---|---|---|---|---|---|
| 734 Parkway Ave Indianapolis, IN | 3.0 | 2.0 | 2110 | $2,299 | $1.09 | 24d | 1 | 0.02mi |
| 726 Parkway Ave Indianapolis, IN | 3.0 | 2.0 | 1150 | $2,195 | $1.91 | 17d | 1 | 0.03mi |
| 1247 Wright St Indianapolis, IN | 3.0 | 1.5 | 1809 | $1,750 | $0.97 | 44d | 1 | 0.08mi |
| 1247 Wright St Indianapolis, IN | 3.0 | 1.5 | 1247 | $1,750 | $1.40 | 18d | 1 | 0.08mi |
| 752 Cottage Ave Indianapolis, IN | 3.0 | 2.0 | 1548 | $1,750 | $1.13 | 15d | 1 | 0.09mi |
| 728 Cottage Ave Indianapolis, IN | 3.0 | 2.5 | 1831 | $2,550 | $1.39 | 24d | 1 | 0.09mi |
| 614 Parkway Ave Indianapolis, IN | 3.0 | 2.0 | 1360 | $1,900 | $1.40 | 22d | 1 | 0.11mi |
| 704 Sanders St Indianapolis, IN | 2.0 | 1.0 | 1290 | $1,275 | $0.99 | 24d | 1 | 0.13mi |
| 835 Weghorst St Unit 837 Indianapolis, IN | 3.0 | 1.5 | 1500 | $1,399 | $0.93 | 24d | 1 | 0.18mi |
| 736 E Morris St Indianapolis, IN | 2.0 | 1.5 | 1500 | $1,195 | $0.80 | 4d | 1 | 0.18mi |
| 1514 Ringgold Ave Indianapolis, IN | 3.0 | 1.0 | 1064 | $1,295 | $1.22 | 44d | 1 | 0.20mi |
| 1437 S East St Indianapolis, IN | 2.0 | 2.0 | 1114 | $1,425 | $1.28 | 44d | 1 | 0.21mi |
| 1439 South East St Indianapolis, IN | 2.0 | 2.0 | 1114 | $1,425 | $1.28 | 20d | 1 | 0.22mi |
| 932 E Morris St Indianapolis, IN | 2.0 | 2.0 | 1483 | $1,900 | $1.28 | 3d | 1 | 0.26mi |
| 907 Prospect St Unit 907 Prospect NO AMI Indianapolis, IN | 3.0 | 1.5 | 1121 | $1,400 | $1.25 | 24d | 1 | 0.26mi |
| 406 Orange St Indianapolis, IN | 3.0 | 2.5 | 1820 | $2,250 | $1.24 | 44d | 1 | 0.27mi |
| 1035 Sanders St Unit 163 Indianapolis, IN | 2.0 | 1.0 | 1481 | $1,921 | $1.30 | 44d | 1 | 0.28mi |
| 1045 Orange St Indianapolis, IN | 2.0 | 1.0 | 1232 | $2,000 | $1.62 | 24d | 1 | 0.29mi |
| 1045 Orange St Indianapolis, IN | 2.0 | 1.0 | 1232 | $2,200 | $1.79 | 44d | 1 | 0.29mi |
| 1436 S New Jersey St Unit A Indianapolis, IN | 3.0 | 2.5 | 1300 | $2,100 | $1.62 | 24d | 1 | 0.29mi |
| 518 Prospect St Unit 1357365P Indianapolis, IN | 3.0 | 2.0 | 1614 | $2,594 | $1.61 | 8d | 1 | 0.30mi |
| 518 Prospect St Unit 1353834P Indianapolis, IN | 3.0 | 2.0 | 1603 | $2,442 | $1.52 | 15d | 1 | 0.30mi |
| 1012 Prospect St Unit 1527 Indianapolis, IN | 3.0 | 1.5 | 1150 | $1,200 | $1.04 | 44d | 1 | 0.35mi |
| 1012 Prospect St Unit 907 Prospect NO AMI Indianapolis, IN | 3.0 | 1.5 | 1121 | $1,400 | $1.25 | 44d | 1 | 0.35mi |
| 1012 Prospect St Unit 512 State 120% AMI Indianapolis, IN | 3.0 | 1.0 | 1200 | $1,400 | $1.17 | 44d | 1 | 0.35mi |
| 1140 Shelby St Apt 515 Indianapolis, IN | 2.0 | 2.0 | 1181 | $2,090 | $1.77 | 24d | 1 | 0.35mi |
| 243 Terrace Ave Indianapolis, IN | 4.0 | 2.0 | 1669 | $2,700 | $1.62 | 18d | 1 | 0.35mi |
| 714 Buchanan St Indianapolis, IN | 2.0 | 2.0 | 1100 | $1,995 | $1.81 | 15d | 1 | 0.36mi |
| 1830 Orleans St Indianapolis, IN | 3.0 | 2.5 | 1586 | $1,995 | $1.26 | 44d | 1 | 0.42mi |
| 1835 Applegate St Indianapolis, IN | 4.0 | 3.0 | 2024 | $2,300 | $1.14 | 44d | 1 | 0.42mi |
| 1833 Orleans St Unit 1 Indianapolis, IN | 3.0 | 1.0 | 1260 | $1,350 | $1.07 | 44d | 1 | 0.42mi |
| 1012 Hosbrook St Indianapolis, IN | 2.0 | 2.5 | 1728 | $2,400 | $1.39 | 24d | 1 | 0.50mi |
| 620 E Beecher St Indianapolis, IN | 3.0 | 2.0 | 1072 | $1,639 | $1.53 | 20d | 1 | 0.50mi |
| 438 E Beecher St Indianapolis, IN | 3.0 | 2.5 | 1500 | $1,450 | $0.97 | 24d | 1 | 0.53mi |
| 224 Iowa St Indianapolis, IN | 3.0 | 1.0 | 1254 | $1,450 | $1.16 | 24d | 1 | 0.53mi |
| 1861 Barth Ave Unit 1861 Indianapolis, IN | 2.0 | 1.0 | 1300 | $1,600 | $1.23 | 24d | 1 | 0.54mi |
| 1330 Laurel St Indianapolis, IN | 3.0 | 2.0 | 1911 | $2,250 | $1.18 | 20d | 1 | 0.55mi |
| 1713 S Delaware St Indianapolis, IN | 2.0 | 2.0 | 1785 | $1,700 | $0.95 | 44d | 1 | 0.59mi |
| 1258 E Naomi St Indianapolis, IN | 3.0 | 2.0 | 1608 | $1,450 | $0.90 | 8d | 1 | 0.66mi |
| 1441 Prospect St Indianapolis, IN | 2.0 | 1.0–2.0 | 2840 | $2,000 | $0.70 | 2d | 13 | 0.66mi |
Listing history 27 events
-
2026-06-18days on market $199,900 Active 56 DOM
-
2026-06-17days on market $199,900 Active 55 DOM
-
2026-06-16days on market $199,900 Active 54 DOM
-
2026-06-15days on market $199,900 Active 53 DOM
-
2026-06-13days on market $199,900 Active 51 DOM
-
2026-06-13days on market $199,900 Active 50 DOM
-
2026-06-09days on market $199,900 Active 47 DOM
-
2026-06-08days on market $199,900 Active 46 DOM
-
2026-06-07days on market $199,900 Active 45 DOM
-
2026-06-03days on market $199,900 Active 41 DOM
-
2026-06-02days on market $199,900 Active 40 DOM
-
2026-06-01days on market $199,900 Active 39 DOM
-
2026-05-31days on market $199,900 Active 38 DOM
-
2026-04-23$199,900 Active 895-char remark
-
2016-04-08soldstatus $89,000 Sold 524-char remark
Show marketing remark (524 chars)
Great opportunity in the up & coming Bates-Hendricks neighborhood! Much work has been done making this a great rental or for a do-it-yourselfer looking for some quick equity! New in kitchen: tile floor, cabinets, c’top & sink w/disposal. Bath w/new tile floor, vanity & tub/shower! Brand new carpet. Lots of charm remains as well w/tall ceilings, built-in china hutch, craftsman style staircase & transom windows. Big covered porch, fenced yard & parking spaces behind house! Being sold AS-IS.
-
2016-04-06status Pending 524-char remark
Show marketing remark (524 chars)
Great opportunity in the up & coming Bates-Hendricks neighborhood! Much work has been done making this a great rental or for a do-it-yourselfer looking for some quick equity! New in kitchen: tile floor, cabinets, c’top & sink w/disposal. Bath w/new tile floor, vanity & tub/shower! Brand new carpet. Lots of charm remains as well w/tall ceilings, built-in china hutch, craftsman style staircase & transom windows. Big covered porch, fenced yard & parking spaces behind house! Being sold AS-IS.
-
2016-03-08historical Active with Contingency 524-char remark
Show marketing remark (524 chars)
Great opportunity in the up & coming Bates-Hendricks neighborhood! Much work has been done making this a great rental or for a do-it-yourselfer looking for some quick equity! New in kitchen: tile floor, cabinets, c’top & sink w/disposal. Bath w/new tile floor, vanity & tub/shower! Brand new carpet. Lots of charm remains as well w/tall ceilings, built-in china hutch, craftsman style staircase & transom windows. Big covered porch, fenced yard & parking spaces behind house! Being sold AS-IS.
-
2016-02-22price $94,500 524-char remark
Show marketing remark (524 chars)
Great opportunity in the up & coming Bates-Hendricks neighborhood! Much work has been done making this a great rental or for a do-it-yourselfer looking for some quick equity! New in kitchen: tile floor, cabinets, c’top & sink w/disposal. Bath w/new tile floor, vanity & tub/shower! Brand new carpet. Lots of charm remains as well w/tall ceilings, built-in china hutch, craftsman style staircase & transom windows. Big covered porch, fenced yard & parking spaces behind house! Being sold AS-IS.
-
2016-02-01$98,500 Active 524-char remark
Show marketing remark (524 chars)
Great opportunity in the up & coming Bates-Hendricks neighborhood! Much work has been done making this a great rental or for a do-it-yourselfer looking for some quick equity! New in kitchen: tile floor, cabinets, c’top & sink w/disposal. Bath w/new tile floor, vanity & tub/shower! Brand new carpet. Lots of charm remains as well w/tall ceilings, built-in china hutch, craftsman style staircase & transom windows. Big covered porch, fenced yard & parking spaces behind house! Being sold AS-IS.
-
2015-09-15historical
-
2015-08-28price $63,900
-
2015-08-28status Active
-
2015-08-24historical Contingent - Backup Pending Other
-
2015-08-07price $68,990
-
2015-08-07$68,900 Active
-
2006-04-04soldstatus $37,900
-
2006-01-13$40,000
ⓘ Source: listings_history table (triggers on properties + properties_extension) + one-shot
backfill from property_details.listing_events for pre-trigger history.
Tax reassessment forecast IN · Partial reset (capped growth)
- Current annual tax
- $2,069 · $172/mo
- Projected year-2 tax
- $2,069 · $172/mo
- Expected delta
- $0/yr ($0/mo · 0.0%)
ⓘ Screening estimate from a state-policy table — verify with the county assessor before closing.
Climate risk First Street
- Flood 1/10 Low FEMA zone X (unshaded) · 0% chance over 30 yrs
- Wildfire 1/10 Low
- Heat 4/10 Moderate 7 d/yr ≥101°F today · 19 d/yr by 30 yrs out
- Wind 2/10 Low 100% chance of damaging wind over 30 yrs
- Air quality 3/10 Moderate 2 unhealthy d/yr today · 3 by 30 yrs out
Nearby sold comps map
Loading sold comps map…
Walkable amenities ~0.75 mi
Loading nearby amenities…
Taxation est. · year 1
- Rental income
- $22,422
- − Mortgage interest
- −$11,198
- − Property taxes
- −$2,069
- − Insurance
- −$1,000
- − Repairs & maintenance
- −$1,794
- − Management
- −$1,794
- − Depreciation
- −$5,815
- Taxable loss
- −$1,246
- Est. tax savings @ 24.0%
- +$299
- After-tax cash flow
- $2,365/yr
For passive investors: Depreciation is non-cash, so a rental often shows a tax loss while cash-flowing — sheltering income. Rental losses are passive: they offset passive income freely, and up to $25,000/yr can offset ordinary (W-2) income if you actively participate and your MAGI is under $100k (phasing out to $0 by $150k); unused losses carry forward. On sale, claimed depreciation is recaptured at up to 25%, and gains may owe capital-gains tax (a 1031 exchange can defer both). Figures are a year-1 estimate at your 24.0% rate — not tax advice; consult a CPA.
Schools (NCES district)
- District
- Indianapolis Public Schools
- NCES district ID
- 1804770
- Math proficiency
- 14% ▼ -7.00%
- Reading proficiency
- 20% ▼ -3.00%
- Median HH income
- $32,034
- Composite
- 13.69/100
- National rank
- #9499
- State rank
- #286 of 301 in IN
Livability — Indianapolis city (balance)
No livability data for this city. (Only ~50 U.S. cities are tracked.)
Census & demographics
- Census place
- Indianapolis city (balance), IN
- County
- Marion County · 998,460 people
- City population
- 881,119
- Metro
- Indianapolis-Carmel-Anderson, IN
- Population (ZIP)
- 37,758
- Household income
- $57,393
- Rent vs Own
- Severe rent burden
- 1499.0
Population outlook (Marion County) Hauer SSP2
- Today (2025)
- 1,025,572 people
- By 2030
- 1,065,727 · +3.9%
- By 2040
- 1,141,577 · +11.3%
- By 2050
- 1,208,920 · +17.9%
- By 2075
- 1,367,288 · +33.3%
- By 2100
- 1,438,201 · +40.2%
Race, ethnicity, and origin ACS 2023
- Neighborhood character
- Predominantly White (69%)
- Race & ethnicity
- White 69% Hispanic / Latino 14% Black 12% Two or more races 8% Asian 2% Native American 1%
- Hispanic origin (detail)
- Mexican 12% Puerto Rican 1%
- Common ancestry
- Slovak 2% Lithuanian 2% Italian 1%
- Foreign-born
- 8% · Canada
- Languages at home
- 88% English-only · Spanish 10% Other Indo-European 1%
Political lean MEDSL · Marion
- 2024 margin
- Strong D (+27.7) · D 63.0% · R 35.3% · Other 1.7%
- 2008→2024 swing
- -0.7pp no change · 2008: 28.4pp · 2024: 27.7pp
- All cycles
- 2024: D+27.7 2020: D+29.1 2016: D+22.8 2012: D+22.2 2008: D+28.4
Not yet ingested
- Civics
- —
Market trends
- HPI YoY
- ▼ -127.37%
- Current HPI
- 349.579
- Rent YoY
- ▲ 2.88%
- Metro
- Indianapolis-Carmel-Anderson, IN
- State GDP YoY
- ▲ 2.90%
- F500 in state
- 18
Industry mix (Fortune 500 HQ in IN)
| Industry | F500 HQs | Revenue |
|---|---|---|
| Industrial Machinery | 2 | $37B |
|
||
| Healthcare | 1 | $177B |
|
||
| Pharmaceuticals | 1 | $45B |
|
||
| Metals / Steel | 1 | $18B |
|
||
| Agriculture | 1 | $17B |
|
||
| Packaging | 1 | $12B |
|
||
Price history
+399.8% since first listed14 events — show timeline
- 2026-04-23 Listed $199,900 MIBOR as Distributed by MLS Grid
- 2016-04-08 Sold (MLS) $89,000 MIBOR as Distributed by MLS Grid
- 2016-04-06 Pending — MIBOR as Distributed by MLS Grid
- 2016-03-08 Contingent — MIBOR as Distributed by MLS Grid
- 2016-02-22 Price Changed $94,500 MIBOR as Distributed by MLS Grid
- 2016-02-01 Listed $98,500 MIBOR as Distributed by MLS Grid
- 2015-09-15 Listing Removed — MIBOR as Distributed by MLS Grid
- 2015-08-28 Price Changed $63,900 MIBOR as Distributed by MLS Grid
- 2015-08-28 Relisted — MIBOR as Distributed by MLS Grid
- 2015-08-24 Contingent — MIBOR as Distributed by MLS Grid
- 2015-08-07 Price Changed $68,990 MIBOR as Distributed by MLS Grid
- 2015-08-07 Listed $68,900 MIBOR as Distributed by MLS Grid
- 2006-04-04 Sold (MLS) $37,900 MIBOR as Distributed by MLS Grid
- 2006-01-13 Listed $40,000 MIBOR as Distributed by MLS Grid
Property tax history
+7.0%/yrLatest (2025): $2,069 · -2.5% YoY. Source: county tax records.
Cash-flow waterfall
monthlySold comps — $/sqft
last 12 mo · ≤1 miLoading sold comps…