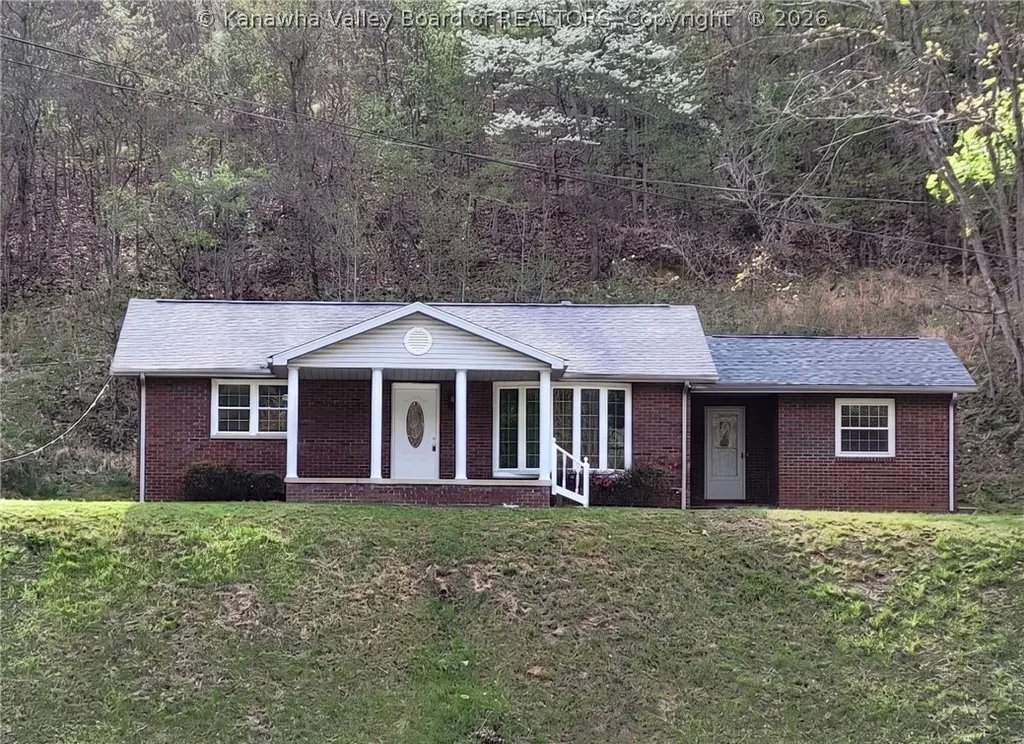
13 Mayfair Ln · Coal Fork, WV
Flood risk 1/10 · Minimal
- FEMA flood zone
- X (unshaded)
- Chance of flooding over 30 yrs
- 0.0%
- Est. flood insurance / yr
- $507 – $1,088
Fire risk 5/10 · Moderate
- Est. fire insurance / yr
- $787 – $1,461
Heat risk 4/10 · Minor
- Hot days now (above 100°F)
- 7 days/yr
- Hot days in 30 yrs
- 19 days/yr
Wind risk 2/10 · Minimal
- Chance of severe wind over 30 yrs
- 1.0%
Air-quality risk 1/10 · Minimal
- Unhealthy air days now
- 0 days/yr
- Unhealthy air days in 30 yrs
- 0 days/yr
Risk factors via First Street. Map © Google.
Why this score? — see what drove the B+ grade
The composite is a weighted blend of 9 inputs, each scored 0–100. Each bar is that input's sub-score; the figure is the points it added to the 100-point composite (weight × sub-score).
- Cash flow +30.0/30.0
- ARV discount +15.0/15.0
- DSCR +10.0/10.0
- 1% rule +9.9/10.0
- Livability +3.1/5.0
- Schools +2.9/10.0
- Rent growth +2.5/5.0
- Condition / age +2.2/5.0
- Appreciation +0.0/10.0
$81,900
🖨 Deal sheet 📄 Offer letter ✓ Due diligence
Listing remarks
Look at the potential that this 3-bedroom, 2-bathroom brick ranch has to offer. The open country style kitchen offers a breakfast bar as well as eat-in area large enough for a formal dining room table. Hardwood floors throughout the main living areas and bedrooms could be refinished to restore them to like new condition. The electric was recently updated and a new roof has just been installed checking two major repair items off your list. Off street parking and a detached 2-car garage is included.
Key facts
- Eat-in area
- Breakfast bar
- Hardwood floors
Tags
Property features AI
Exterior
- Parking: Detached 2-car garage
- Utilities: Public water; Septic tank sewer
- Home design: Single-story ranch; Residential property
- Construction: Brick and plaster construction; Composition shingle roof
- Exterior features: Porch; 2.45-acre lot
Interior
- Kitchen: Eat-in kitchen
- Bedrooms: 7 total rooms (bedrooms not specified separately)
- Flooring: Hardwood; Vinyl
- Bathrooms: 2 full bathrooms
- Heating & cooling: Central air conditioning; Forced air heating
- Interior features: Eat-in kitchen; Porch
Neighborhood map
What this means for you Summary
Snapshot
- This is a 3-bed/2.0-bath single-family listed at $82k. Condition is rated fair.
Deal economics
- At list price, monthly cash flow is $396 ($5k/yr) — positive.
- The deal already cash-flows at list — no discount required.
- Meets the 1% rule at list price ($1k rent vs $82k).
- Recommended offer: $79k (3.0% below list) — sets the bar for market timing.
Location & tenants
- Location reads 61/100 on livability (#201 in WV) — a middle-class / working-renter tenant base. Strengths: crime A+, cost of living A+; Watch: employment D, amenities F, commute F.
- Kanawha County Schools (suburban): math 29% / reading 40% proficiency, ranked #17 of 55 in WV (top 31%) — families likely to look elsewhere, expect single-tenant / working-renter base with shorter leases.
- Zoned schools: Ruffner Elementary School (math 37% / reading 37%, grade F, #130 of 377 statewide, top 39%, 290 students, 0% FRL); West Side Middle School (math 7% / reading 18%, grade F, #109 of 109 statewide, top 100%, 377 students, 0% FRL); Capital High School (math 22% / reading 52%, grade F, #32 of 110 statewide, top 34%, 1,086 students, 0% FRL) — zoned schools average 0% FRL vs 46% district-wide (46 pts lower); this property's tenant base skews higher-income than the district average.
- Market conditions: 61 active listings in the ZIP; 103 units permitted in Kanawha County in 2024 (0 in 5+ unit buildings).
Forward outlook
- Local home prices are declining (-3.0%/yr); year-one equity from $566 of loan paydown is wiped out by about $2k of value loss. Plan a longer hold.
- Kanawha County population projected at -17% by 2050 — secular population decline; favor cash flow + early exit over multi-decade hold.
- At projected returns (-3.0% appreciation + 3.0% rent growth), your $23k cash investment doubles in ~6 years — after that, you're playing with house money.
Negotiation context
- It's been on market 60 days — a 3% lower offer ($79k) is reasonable based on typical stale-listing flexibility.
- 3 sale attempts; this cycle's ask has dropped $6k (7%) from the opening price — seller is motivated, your offer sets the floor, not the list.
Risks & watch-outs
- Climate carrying-cost: moderate wildfire risk — expect insurance premiums to compound above CPI over the hold.
Questions for the listing agent
- It's been on market 60 days. Have you received any prior offers? Is the seller open to a 3% concession, seller financing, or rate buy-down credit?
- Have any recent inspections been done? Can we get a copy of the seller's disclosures and any deferred-maintenance estimates?
- Built in 1962 — when were the roof, HVAC, electrical panel, plumbing, and water heater last replaced?
- Is there a deadline driving the sale (1031 exchange, divorce, estate, relocation)? That informs how much negotiation room exists.
- Schools are F-rated, which usually means shorter tenancies and higher turnover. Who's the typical renter profile here, and what's been the actual vacancy rate?
- What's the average days-on-market for RENTAL listings here right now (not sales)? A rising rental-DOM trend means longer vacancies and softer asking-rent achievability than the comps imply.
- What's the recent tenant-quality profile in this submarket — average credit score on applications, eviction rate, late-payment / NSF rate, and stable-employment percentage? A property-management company in the area should have these aggregated.
- How much new for-sale + rental construction is in the pipeline within 1–3 miles? Heavy new supply typically softens prices + rents 12–24 months out; constrained supply supports both.
Investment metrics
- 1% rule
- 1.49% ✓
- Cap rate
- 12.09%
- Cash-on-cash
- 20.72%
- DSCR
- 1.92
- GRM
- 5.6
CMA / ARV
- ARV (on-the-fly)
- $156,912
- Comps found
- 1
Show comp detail 1 sale within ~0.75 mi
| Address | Dist | Beds/Ba | Sqft | Sold | Price | $/sf | Match |
|---|---|---|---|---|---|---|---|
| 104 Tourant Dr | 0.68mi | 3/3.0 | 1,489 (+6%) | 19mo | $166,900 | $112 | 38 |
Match score weights: distance 35% · size 25% · config 20% · recency 20%. Top-matched comps best support the ARV.
Projected returns pro-forma
-3.0% appreciation · 3.0% rent growth · sell at horizon
- IRR
- 13.1%
- Equity multiple
- 1.52×
- Total profit
- $11,961
- Equity at exit
- $12,212
- IRR
- 22.0%
- Equity multiple
- 2.87×
- Total profit
- $42,958
- Equity at exit
- $7,081
Cash invested: $22,932 (down + closing). Projections, not guarantees.
Landlord ↔ Tenant lean methodology
- Overall (STATE)
- 83 Strongly Landlord-Friendly
- State West Virginia
- 83 Strongly Landlord-Friendly · R+22
- County
- — inherits STATE
- City
- — inherits STATE
ZIP-level market 25311
- Home prices YoY
- -12.5%
- Active inventory
- 61
- Price-to-rent
- 5.6×
Monthly cashflow live
- Estimated rent
- $1,218 medium interval (Pro) →
- Mortgage (P&I)
- −$429
- Tax est. 1.5%
- −$102 /mo · $1,228/yr
- Insurance
- −$34
- HOA
- −$0
- Vacancy / Maint / Mgmt
- −$256
- Net cashflow
- $396
Break-even live
UW: 25.0% down · 7.5% · 30yr · 1.5% tax · 5.0% vac · 8.0% maint · 8.0% mgmt
Financing live
Cash to close
- Down payment
- $20,475
- Closing costs
- $2,457
- Reserves months
- —
- Total cash needed
- —
Loan-product check · same deal, 3 products live
Conventional
25% down · 7.5% · 30yr
- Down + closing
- —
- Monthly P&I
- —
- Monthly cashflow
- —
- DSCR
- —
- Eligible?
- —
Personal DTI + credit; lowest rate.
DSCR
20% down · 8.5% · 30yr
- Down + closing
- —
- Monthly P&I
- —
- Monthly cashflow
- —
- DSCR
- —
- Eligible?
- —
No personal income docs; deal must DSCR.
Hard money
10% down · 12.0% · 12mo
- Down + closing
- —
- Monthly P&I
- —
- Monthly cashflow
- —
- DSCR
- —
- Eligible?
- —
Short-term bridge; refi at stabilization.
Listing history 19 events
-
2026-06-19days on market $81,900 Active 60 DOM
-
2026-06-18days on market $81,900 Active 59 DOM
-
2026-06-17days on market $81,900 Active 58 DOM
-
2026-06-16days on market $81,900 Active 57 DOM
-
2026-06-15days on market $81,900 Active 56 DOM
-
2026-06-14days on market $81,900 Active 54 DOM
-
2026-06-12pricedays on market $81,900 Active 53 DOM
-
2026-06-09days on market $87,900 Active 50 DOM
-
2026-06-08days on market $87,900 Active 49 DOM
-
2026-06-07days on market $87,900 Active 48 DOM
-
2026-06-05days on market $87,900 Active 45 DOM
-
2026-06-03days on market $87,900 Active 44 DOM
-
2026-06-02days on market $87,900 Active 43 DOM
-
2026-06-01days on market $87,900 Active 42 DOM
-
2026-05-31days on market $87,900 Active 41 DOM
-
2026-05-30days on market $87,900 Active 40 DOM
-
2026-04-17$87,900 Active
-
2026-03-23$87,900 Active
-
2026-03-06$87,900 Active
ⓘ Source: listings_history table (triggers on properties + properties_extension) + one-shot
backfill from property_details.listing_events for pre-trigger history.
Climate risk First Street
- Flood 1/10 Low FEMA zone X (unshaded) · 0% chance over 30 yrs
- Wildfire 5/10 Major
- Heat 4/10 Moderate 7 d/yr ≥100°F today · 19 d/yr by 30 yrs out
- Wind 2/10 Low 100% chance of damaging wind over 30 yrs
- Air quality 1/10 Low 0 unhealthy d/yr today · 0 by 30 yrs out
Nearby sold comps map
Loading sold comps map…
Walkable amenities ~0.75 mi
Loading nearby amenities…
Taxation est. · year 1
- Rental income
- $14,611
- − Mortgage interest
- −$4,588
- − Property taxes
- −$1,228
- − Insurance
- −$410
- − Repairs & maintenance
- −$1,169
- − Management
- −$1,169
- − Depreciation
- −$2,383
- Taxable income
- $3,665
- Est. tax owed @ 24.0%
- −$880
- After-tax cash flow
- $3,871/yr
For passive investors: Depreciation is non-cash, so a rental often shows a tax loss while cash-flowing — sheltering income. Rental losses are passive: they offset passive income freely, and up to $25,000/yr can offset ordinary (W-2) income if you actively participate and your MAGI is under $100k (phasing out to $0 by $150k); unused losses carry forward. On sale, claimed depreciation is recaptured at up to 25%, and gains may owe capital-gains tax (a 1031 exchange can defer both). Figures are a year-1 estimate at your 24.0% rate — not tax advice; consult a CPA.
Condition & rehab AI · 13 photos
This 3-bedroom, 2-bathroom ranch requires moderate renovations to improve its condition and increase its value.
Repairs flagged
- Major Kitchen countertops — Exposed subfloor
- Major Bathroom fixtures — Exposed subfloor
- Major Landscaping — Overgrown lawn
Value-add opportunities
- Resale Paint interior walls — Enhances curb appeal and interior aesthetics
- Resale Replace countertops and fixtures — Improves functionality and aesthetics
- Both Landscaping — Enhances curb appeal and property value
Renovation cost estimate screening
| Repair item | Severity | Est. cost |
|---|---|---|
| Kitchen countertops · Exposed subfloor | Major | $15,000–50,000 |
| Bathroom fixtures · Exposed subfloor | Major | $15,000–50,000 |
| Landscaping · Overgrown lawn | Major | $15,000–50,000 |
| Total estimated repair cost · 3 items | $45,000–150,000 |
Value-add ROI direction
- Resale Paint interior walls — Enhances curb appeal and interior aesthetics ↑
- Resale Replace countertops and fixtures — Improves functionality and aesthetics ↑
- Both Landscaping — Enhances curb appeal and property value ↑
ⓘ Cost ranges are severity-bucket heuristics (US national rule-of-thumb). Get contractor quotes + a written scope before underwriting a rehab budget.
Schools (NCES district)
- District
- Kanawha County Schools
- NCES district ID
- 5400600
- Math proficiency
- 29% ▼ -13.00%
- Reading proficiency
- 40% ▼ -7.00%
- Median HH income
- $44,329
- Composite
- 29.35/100
- National rank
- #6540
- State rank
- #17 of 55 in WV
Livability — Coal Fork
- Score
- 61/100
- State rank
- #201
- US rank
- #17993
Category grades
Schools grade is shown separately in the Schools card above.
Census & demographics
- Population (ZIP)
- 9,613
Population outlook (Kanawha County) Hauer SSP2
- Today (2025)
- 178,946 people
- By 2030
- 172,906 · -3.4%
- By 2040
- 159,874 · -10.7%
- By 2050
- 148,148 · -17.2%
- By 2075
- 123,257 · -31.1%
- By 2100
- 96,454 · -46.1%
Race, ethnicity, and origin ACS 2023
- Neighborhood character
- Predominantly White (82%)
- Race & ethnicity
- White 82% Black 10% Two or more races 6%
- Common ancestry
- Italian 3% Iranian 2% Slovak 2%
- Foreign-born
- 2% · Canada, China
- Languages at home
- 97% English-only · Spanish 1% German/W. Germanic 1%
Political lean MEDSL · Kanawha
- 2024 margin
- R (+17.4) · D 40.2% · R 57.6% · Other 2.2%
- 2008→2024 swing
- -17.0pp toward R · 2008: -0.4pp · 2024: -17.4pp
- All cycles
- 2024: R+17.4 2020: R+14.7 2016: R+20.6 2012: R+11.9 2008: R+0.4
Not yet ingested
- Civics
- —
Market trends
- HPI YoY
- ▼ -23.77%
- Current HPI
- 166.032
- Rent YoY
- —
- Metro
- —
- State GDP YoY
- —
- F500 in state
- 0
Price history
+0.0% since first listed3 events — show timeline
- 2026-04-17 Listed $87,900 KVBOR
- 2026-03-23 Listed $87,900 KVBOR
- 2026-03-06 Listed $87,900 KVBOR
Cash-flow waterfall
monthlySold comps — $/sqft
last 12 mo · ≤1 miLoading sold comps…