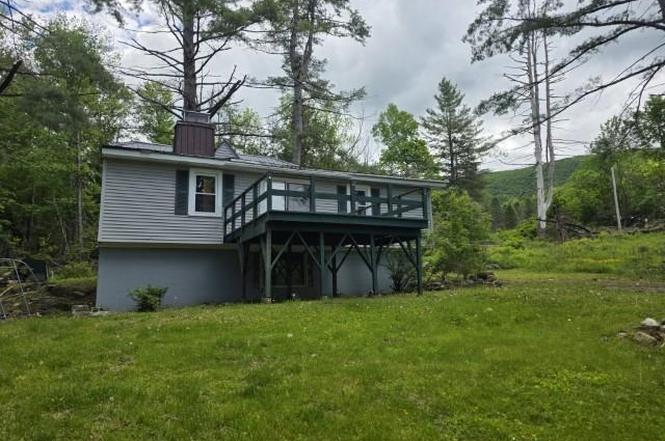
113 Forgette Rd · Stamford, VT
Flood risk 1/10 · Minimal
- FEMA flood zone
- X (unshaded)
- Chance of flooding over 30 yrs
- 0.0%
- Est. flood insurance / yr
- $507 – $1,088
Fire risk 3/10 · Minor
- Est. fire insurance / yr
- $480 – $892
Heat risk 1/10 · Minimal
- Hot days now (above 86°F)
- 8 days/yr
- Hot days in 30 yrs
- 19 days/yr
Wind risk 3/10 · Minor
- Chance of severe wind over 30 yrs
- 7.0%
Air-quality risk 2/10 · Minimal
- Unhealthy air days now
- 0 days/yr
- Unhealthy air days in 30 yrs
- 1 days/yr
Risk factors via First Street. Map © Google.
Why this score? — see what drove the B grade
The composite is a weighted blend of 9 inputs, each scored 0–100. Each bar is that input's sub-score; the figure is the points it added to the 100-point composite (weight × sub-score).
- Cash flow +30.0/30.0
- DSCR +10.0/10.0
- 1% rule +9.3/10.0
- ARV discount +7.5/15.0
- Appreciation +5.4/10.0
- Schools +5.0/10.0
- Rent growth +2.5/5.0
- Livability +2.5/5.0
- Condition / age +2.5/5.0
$120,500
🖨 Deal sheet 📄 Offer letter ✓ Due diligence
Listing remarks MLS
VERMONT Seclusion, privacy & wildlife abound. Well maintained 3 bedroom, 1 bath, 1-level home, well set back from road. Large, fairly private, shaded yard. Mud room leads you into the kitchen, dining, & bath areas. Good sized living room with wood burning stove leads to front den that opens to large front deck offering peace & beautiful late afternoon sunsets. Less than fifteen minutes to grocery stores & down town North Adams, yet feels miles away. Easy access Vermont & Massachusetts Skiing, Mass MoCA, Williams College and Clark Art Museum with Bennington to the North, Barrington Stage and Tanglewood to the South. Hiking, boating, snowmobiling. .. outdoor's person's paradise. Easement is for use of mountain spring on abutting property.
Key facts
- Large yard
- Private location
- 2.56 acre lot
Tags
Property features AI
Finance
- Financial info: Property is foreclosed / bank-owned / REO
Exterior
- Utilities: Deeded, shared spring water source; Private sewer; Circuit breaker electrical service; Internet availability unknown
- Home design: Ranch-style home; Existing structure
- Construction: Built in 1930; Wood frame construction; Metal roof; Unfinished basement (walkout)
- Exterior features: Sloping lot; Public road frontage; Dirt driveway; Taupe exterior color
Interior
- Kitchen: Kitchen combined with dining area
- Bedrooms: Five bedrooms on the main level
- Bathrooms: One full bathroom
- Heating & cooling: Oil heating
- Interior features: Eight total rooms; Unfinished walkout basement
Neighborhood map
What this means for you Summary
Snapshot
- This is a 4-bed/1.0-bath other listed at $120k.
Deal economics
- At list price, monthly cash flow is $543 ($7k/yr) — positive.
- The deal already cash-flows at list — no discount required.
- Meets the 1% rule at list price ($2k rent vs $120k).
Location & tenants
- Location reads: area grade B — affects rentability + tenant quality, not the cash-flow math above.
- Market conditions: 9 active listings in the ZIP; 59 units permitted in Bennington County in 2024 (0 in 5+ unit buildings).
Forward outlook
- In year one you build about $2k of equity ($833 loan paydown + $871 appreciation (0.7% local appreciation)).
- Bennington County population projected at -23% by 2050 — secular population decline; favor cash flow + early exit over multi-decade hold.
- At projected returns (0.7% appreciation + 3.0% rent growth), your $34k cash investment doubles in ~4 years — after that, you're playing with house money.
Negotiation context
- Only 2 days on market — expect competitive offers; lowballing is unlikely to land.
- 3 sale attempts since 9y ago with the ask held roughly flat each time — persistent listings suggest the price (not the market) is what's stuck; bring a comps-based counter.
Risks & watch-outs
- Watch-outs: built in 1930 — expect roof / HVAC / electrical / plumbing capex.
Questions for the listing agent
- Built in 1930 — when were the roof, HVAC, electrical panel, plumbing, and water heater last replaced?
- Is there a deadline driving the sale (1031 exchange, divorce, estate, relocation)? That informs how much negotiation room exists.
- What's the average days-on-market for RENTAL listings here right now (not sales)? A rising rental-DOM trend means longer vacancies and softer asking-rent achievability than the comps imply.
- What's the recent tenant-quality profile in this submarket — average credit score on applications, eviction rate, late-payment / NSF rate, and stable-employment percentage? A property-management company in the area should have these aggregated.
- How much new for-sale + rental construction is in the pipeline within 1–3 miles? Heavy new supply typically softens prices + rents 12–24 months out; constrained supply supports both.
Investment metrics
- 1% rule
- 1.43% ✓
- Cap rate
- 11.70%
- Cash-on-cash
- 19.32%
- DSCR
- 1.86
- GRM
- 5.8
CMA / ARV
No comps found within radius.
Projected returns pro-forma
0.72% appreciation · 3.0% rent growth · sell at horizon
- IRR
- 20.8%
- Equity multiple
- 2.04×
- Total profit
- $35,249
- Equity at exit
- $39,410
- IRR
- 24.1%
- Equity multiple
- 3.84×
- Total profit
- $95,968
- Equity at exit
- $51,063
Cash invested: $33,740 (down + closing). Projections, not guarantees.
Landlord ↔ Tenant lean methodology
- Overall (STATE)
- 41 Moderately Tenant-Leaning
- State Vermont
- 41 Moderately Tenant-Leaning · D+15
- County
- — inherits STATE
- City
- — inherits STATE
ZIP-level market 05352
- Home prices YoY
- 0.8%
- Active inventory
- 9
- Price-to-rent
- 5.8×
Monthly cashflow live
- Estimated rent
- $1,720 medium interval (Pro) →
- Mortgage (P&I)
- −$632
- Tax from tax record
- −$133 /mo · $1,600/yr
- Insurance
- −$50
- HOA
- −$0
- Vacancy / Maint / Mgmt
- −$361
- Net cashflow
- $543
Break-even live
UW: 25.0% down · 7.5% · 30yr · 1.5% tax · 5.0% vac · 8.0% maint · 8.0% mgmt
Financing live
Cash to close
- Down payment
- $30,125
- Closing costs
- $3,615
- Reserves months
- —
- Total cash needed
- —
Loan-product check · same deal, 3 products live
Conventional
25% down · 7.5% · 30yr
- Down + closing
- —
- Monthly P&I
- —
- Monthly cashflow
- —
- DSCR
- —
- Eligible?
- —
Personal DTI + credit; lowest rate.
DSCR
20% down · 8.5% · 30yr
- Down + closing
- —
- Monthly P&I
- —
- Monthly cashflow
- —
- DSCR
- —
- Eligible?
- —
No personal income docs; deal must DSCR.
Hard money
10% down · 12.0% · 12mo
- Down + closing
- —
- Monthly P&I
- —
- Monthly cashflow
- —
- DSCR
- —
- Eligible?
- —
Short-term bridge; refi at stabilization.
Listing history 3 events
-
2026-06-19days on market $120,500 Active 2 DOM
-
2026-06-17remarks 260-char remark
-
2026-06-17$120,500 Active 1 DOM
ⓘ Source: listings_history table (triggers on properties + properties_extension) + one-shot
backfill from property_details.listing_events for pre-trigger history.
Tax reassessment forecast VT · Partial reset (capped growth)
- Current annual tax
- $1,600 · $133/mo
- Projected year-2 tax
- $1,945 · $162/mo
- Expected delta
- +$345/yr (+$29/mo · 21.5%)
ⓘ Screening estimate from a state-policy table — verify with the county assessor before closing.
Climate risk First Street
- Flood 1/10 Low FEMA zone X (unshaded) · 0% chance over 30 yrs
- Wildfire 3/10 Moderate
- Heat 1/10 Low 8 d/yr ≥86°F today · 19 d/yr by 30 yrs out
- Wind 3/10 Moderate 7% chance of damaging wind over 30 yrs
- Air quality 2/10 Low 0 unhealthy d/yr today · 1 by 30 yrs out
Nearby sold comps map
Loading sold comps map…
Walkable amenities ~0.75 mi
Loading nearby amenities…
Taxation est. · year 1
- Rental income
- $20,640
- − Mortgage interest
- −$6,750
- − Property taxes
- −$1,600
- − Insurance
- −$602
- − Repairs & maintenance
- −$1,651
- − Management
- −$1,651
- − Depreciation
- −$3,505
- Taxable income
- $4,879
- Est. tax owed @ 24.0%
- −$1,171
- After-tax cash flow
- $5,349/yr
For passive investors: Depreciation is non-cash, so a rental often shows a tax loss while cash-flowing — sheltering income. Rental losses are passive: they offset passive income freely, and up to $25,000/yr can offset ordinary (W-2) income if you actively participate and your MAGI is under $100k (phasing out to $0 by $150k); unused losses carry forward. On sale, claimed depreciation is recaptured at up to 25%, and gains may owe capital-gains tax (a 1031 exchange can defer both). Figures are a year-1 estimate at your 24.0% rate — not tax advice; consult a CPA.
Schools (NCES district)
No district data.
Livability — Stamford
No livability data for this city. (Only ~50 U.S. cities are tracked.)
Census & demographics
- Census place
- Stamford, VT
- Population (ZIP)
- 895
Population outlook (Bennington County) Hauer SSP2
- Today (2025)
- 34,407 people
- By 2030
- 32,975 · -4.2%
- By 2040
- 29,711 · -13.6%
- By 2050
- 26,638 · -22.6%
- By 2075
- 21,318 · -38.0%
- By 2100
- 16,086 · -53.2%
Race, ethnicity, and origin ACS 2023
- Neighborhood character
- Predominantly White (95%)
- Race & ethnicity
- White 95% Two or more races 3% Asian 1% Hispanic / Latino 1%
- Common ancestry
- Lithuanian 16% Romanian 6% Slovak 5%
- Foreign-born
- 1% · South Korea
- Languages at home
- 99% English-only · Spanish 1%
Political lean MEDSL · Bennington
- 2024 margin
- Strong D (+22.5) · D 60.0% · R 37.5% · Other 2.6%
- 2008→2024 swing
- -10.9pp toward R · 2008: 33.4pp · 2024: 22.5pp
- All cycles
- 2024: D+22.5 2020: D+27.3 2016: D+22.1 2012: D+33.3 2008: D+33.4
Not yet ingested
- Civics
- —
Market trends
- HPI YoY
- ▲ 0.72%
- Current HPI
- 93.0095
- Rent YoY
- —
- Metro
- —
- State GDP YoY
- —
- F500 in state
- 0
Price history
-27.0% since first listed7 events — show timeline
- 2026-06-17 Listed $120,500 PrimeMLS
- 2017-12-01 Sold (Public Records) $153,000 Public Records
- 2017-11-30 Sold (MLS) $153,000 BCMLS
- 2017-11-30 Sold (MLS) $153,000 PrimeMLS
- 2017-10-16 Pending — PrimeMLS
- 2017-09-11 Listed $165,000 PrimeMLS
- 2017-09-04 Listed $165,000 BCMLS
Property tax history
-4.5%/yrLatest (2024): $1,600 · -30.9% YoY. Source: county tax records.
Cash-flow waterfall
monthlySold comps — $/sqft
last 12 mo · ≤1 miLoading sold comps…